Radiometer Considerations Lectures in Maratea 22 31 May


 from two mirrors produces")
 Diffraction Mirror diameter defines ability of radiometer to resolve two point")


 Impulse or Step Response Function Detector collects incident photons over a")

 Detector Signal to Noise equivalent radiance for infrared detector can be")
 Infrared Calibration Radiometer detectors are assumed to have linear response to")
 Bit Depth Range of radiances expected for earth and atmosphere in")

) (ps) -")


 = c")


, 2001 -06 -04 16: 45 UTC On-orbit correction")


- Slides: 38
Radiometer Considerations Lectures in Maratea 22 – 31 May 2003 Paul Menzel NOAA/NESDIS/ORA
Relevant Material in Applications of Meteorological Satellites CHAPTER 12 - RADIOMETER DESIGN CONSIDERATIONS 12. 3 Design Considerations 12. 3. 1 Diffraction 12. 3. 2 The Impulse Response Function 12. 3. 3 Detector Signal to Noise 12. 3. 4 Infrared Calibration 12. 3. 5 Bit Depth 12 -1 12 -2 12 -3 12 -5
Remote Sensing Instrument Considerations Radiometer Components Optics Detectors Electronics collect incoming radiation separate or disperse the spectral components (dichroics, grating spectrometer, interferometer, prism, . . . ) focus the radiation to field stop respond to the photons with a voltage signal is amplified by the electronics A/D converts into digital counts. Performance Characteristics Responsivity measure of the output per input Detectivity ratio of the responsivity per noise voltage Calibrationattempts to reference the output to known inputs. Design Considerations Diffraction Impulse Response Signal to Noise Infrared Calibration Bit Depth function of the mirror size determines how sharp edges appear how clean is the image enables quantitative use of measurements truncation error can limit precision of data Satellite Orbits Geostationary vs Polar orbiting vs Other
Approaches To Separate Radiation into Spectral Bands radiometer - uses filters to separate spectrum by reflection and transmission (wavelengths are selectively reflected and transmitted) prism - separates spectrum by refraction (different wavelengths bend into different paths) grating spectrometer - spatially separates spectrum by diffraction (wavelets from different slits will be in phase in different locations depending on wavelength) interferometer - separates spectrum by interference patterns spread out temporally (wavelets from different paths will be in phase at different times depending on wavelength)
Separation of Spectra
Spectral Separation with a Prism: longer wavelengths deflected less
Spectral Separation with a Grating: path difference from slits produces positive and negative wavelet interference on screen
Spectral Separation with an Interferometer - path difference (or delay) from two mirrors produces positive and negative wavelet interference
Design Considerations (1) Diffraction Mirror diameter defines ability of radiometer to resolve two point sources on the earth surface. Rayleigh criterion indicates that angle of separation , θ, between two points just resolved (maxima of diffraction pattern of one point lies on minima of diffraction pattern of other point) sin θ = λ / d where d is diameter of mirror and λ is wavelength. Geo satellite mirror diameter of 30 cm at infrared window wavelengths (10 microns) has resolution of about 1 km. This follows from 10 -5 m / 3 x 10 -1 m = 3. 3 x 10 -5 = r / 36, 000 km or r = 1 km = resolution.
Energy distribution from diffraction through a circular aperture Max number energy location of ring Central max Second max Third max Fourth max Fifth max E 0. 084 E 0. 033 E 0. 018 E 0. 011 E 0 1. 22 λ / d 1. 22 2. 23 λ / d 2. 23 3. 24 λ / d 3. 24 4. 24 λ / d 4. 24 5. 24 λ / d Thus for a given aperture size more energy is collected within a given FOV size for shorter vs. longer wavelengths Central 2 3 4 5
Energy distribution of 4 micron radiation going through a geo 30 cm diameter circular aperture to the focal point Max number % Energy radius of source Central max Second max Third max Fourth max Tenth max Twentieth max Fortieth max 82% 91% 94% 95% 98% 99. 5% 0. 58 km 1. 06 km 1. 54 km 2. 02 km 4. 88 km 30. 3 km 50. 6 km Central 2 3 4 5
Energy distribution of 10 micron radiation going through a geo 30 cm diameter circular aperture to the focal point Max number % Energy radius of source Central max Second max Third max Fourth max Tenth max Twentieth max Fortieth max 82% 91% 94% 95% 98% 99. 5% 1. 45 km 2. 65 km 3. 84 km 5. 04 km 12. 2 km 75. 7 km 126. 4 km Central 2 3 4 5
Energy distribution of 10 micron radiation going through a geo 50 cm diameter circular aperture to the focal point Max number % Energy radius of source Central max Second max Third max Fourth max Tenth max Twentieth max Fortieth max 82% 91% 94% 95% 98% 99. 5% 0. 84 km 1. 59 km 2. 30 km 3. 02 km 7. 32 km 45. 4 km 75. 8 km Central 2 3 4 5
Distribution of 10 um energy sources focused by 30 cm mirror onto 112 urad square detector (total detected signal emanating from circle of given size) % of signal emanating from circle with diameter of (FOV = 4 km) 60% 73% 79% one FOV 1. 25 FOV 1. 5 FOV Effect of nearby 220 K clouds on 300 K clear scene for clear sky brightness temperature (CSBT) to be within 1 K clear area must have at least 30 km diameter Rule of thumb is 1% 220 K cloud and 99% 300 K clear sky results in CSBT off by 0. 5 K at 10 microns
Calculated diffraction effects for Geo 30 cm mirror for infrared window radiation with a 2 km radius FOV in a clear scene of brightness temperature 300 K surrounded by clouds of 220, 260, or 280 K. Brightness temperature of a 10 radius clear hole is too cold by about 1. 5 K.
Design Considerations (2) Impulse or Step Response Function Detector collects incident photons over a sampling time and accumulates voltage response, which is filtered electronically. This is characterized by impulse (or step) response function, detailing what response of sensor is to delta (or step) function input signal. Response function is determined from characteristics of prealiasing filter which collects voltage signal from detector at sampling times. Perfect response of detector continuously sampling scene with 100% contrast bar extending one FOV. Scene radiance Detector response
Percentage of total signal appearing in samples preceding and following correlated sample peak; for GOES-8 infrared window samples sample N-2 has 4. 3% of total signal, N-1 has 26. 5%, N peaks with 44. 8%, N+1 has 23. 4%, and N+2 has 1. 0%. This causes smearing of cloud edges and other radiance gradients.
Design Considerations (3) Detector Signal to Noise equivalent radiance for infrared detector can be expressed as NEDR( ) = [Ad Δf] 1/2 / [Ao (Δ ) Ω D* Δ ] where is preamplifier degradation factor Ad is detector area in cm 2 Δf is effective electronic bandwidth of radiometer Ao is mirror aperture area in cm 2 (Δ ) is transmission factor of radiometer optics in spectral interval Δ Ω is solid angle of FOV in steradians D* is specific spectral detectivity of detector in spectral band in cm Hz 1/2 / watt, and Δ is spectral bandwidth of radiometer at wavenumber in cm-1. NEDR for GOES-8 imager
Design Considerations (4) Infrared Calibration Radiometer detectors are assumed to have linear response to infrared radiation, where target output voltage is given by Vt = α Rt + Vo and Rt is target input radiance, α is radiometer responsivity, and Vo is system offset voltage. Calibration consists of determining α and Vo. This is accomplished by exposing radiometer to two different external radiation targets of known radiance. A blackbody of known temperature and space (assumed to emit no measurable radiance) are often used as the two references. If z refers to space, bb blackbody, calibration can be written as where Vz = α Rz + Vo Vbb = α Rbb + Vo α = [Vbb - Vz]/[Rbb - Rz] Vo = [Rbb Vz - Rz Vbb]/[Rbb - Rz] Using Rz=0 this yields Rt = Rbb [Vt - Vz] / [Vbb - Vz].
Design Considerations (5) Bit Depth Range of radiances expected for earth and atmosphere in a given spectral band must be converted to digital counts of fixed bit depth. This introduces truncation error. For n bit data, the radiance range, must be covered in 2 n even increments. GOES-8 imager truncation errors are indicated below.
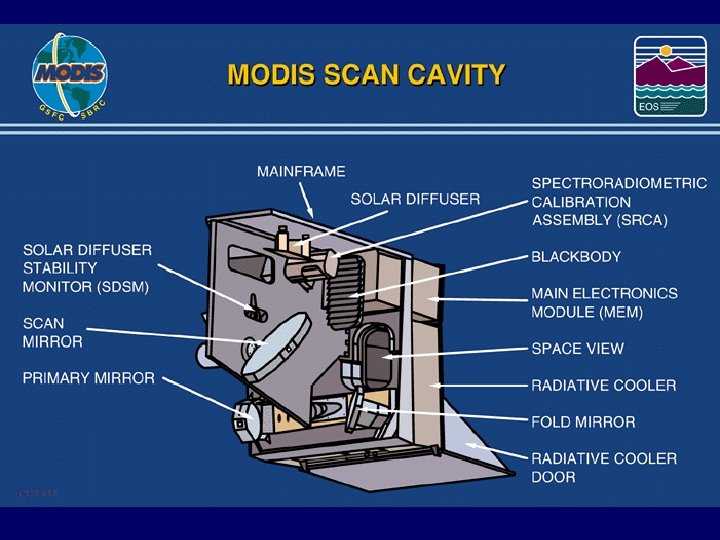
Examples from MODIS Instrument configuration Qualitative radiance considerations IR Cal Val NEDR Image artifacts TPW product validation
Atmospheric Profile Retrieval from MODIS Radiances ps I = sfc B (T(ps)) (ps) - B (T(p)) [ d (p) / dp ] dp. o I 1, I 2, I 3, . . , In are measured with MODIS P(sfc) and T(sfc) come from ground based conventional observations (p) are calculated with physics models Regression relationship is inferred from (1) global set of in situ radiosonde reports, (2) calculation of expected radiances, and (3) statistical regression of observed raob profiles and calculated MODIS radiances Need RT model, estimate of sfc, and MODIS radiances
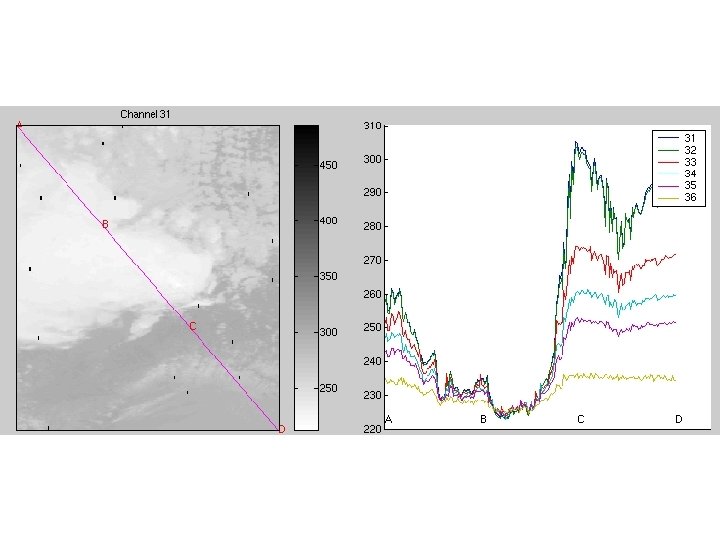
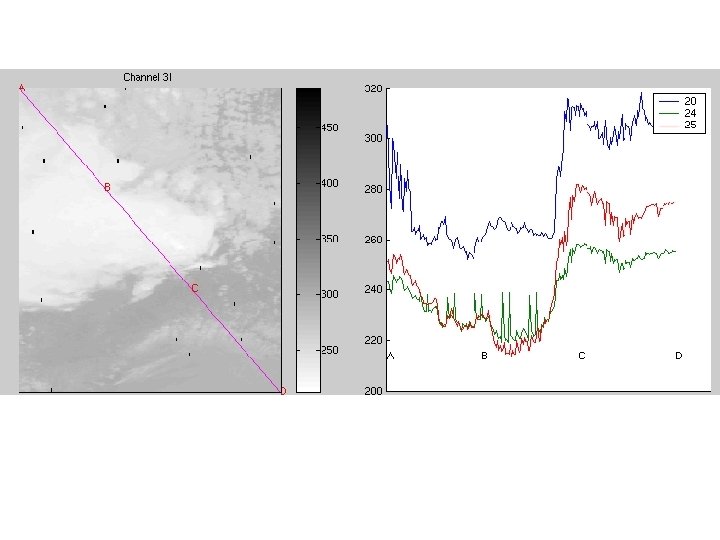
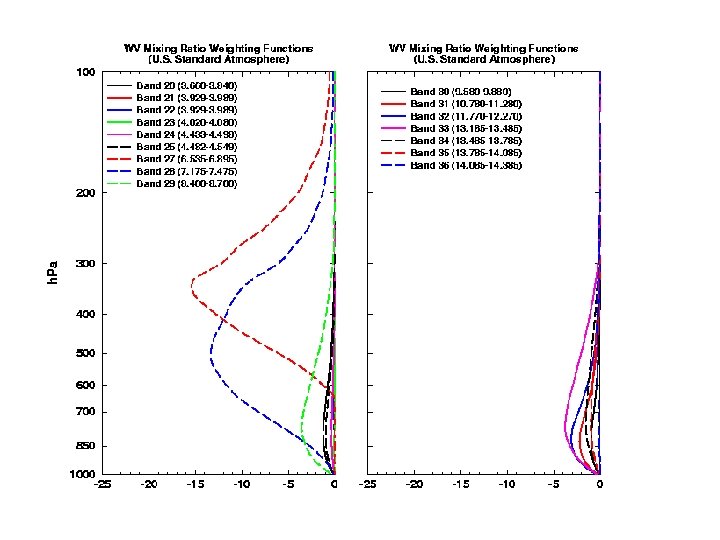
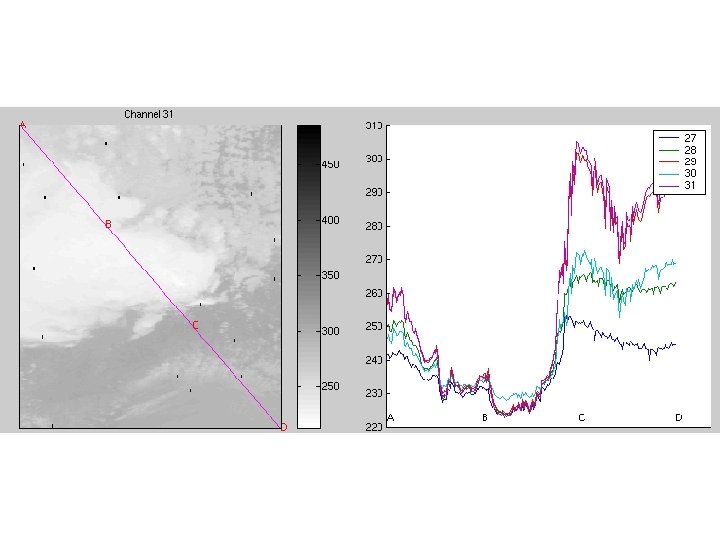
MODIS bands 20 -29 MODIS bands 30 -36
MODIS Emissive Band Cal/Val from ER-2 Platform MAS 11 um • Transfer S-HIS cal to MAS • Co-locate MODIS FOV on MAS • Remove spectral, geometric dependence • WISC-T 2000, SAFARI-2000, TX-2001 MODIS on Terra MODIS FOV Windows MAS, SHIS on ER-2 q 705 km CO 2 20 km H 2 O CO 2
Accounting for Broadband Spectral Response c 2 / T B( , T) = c 1 /{ 5 [e -1] } Summing the Planck function over a spectral response function SR ( ) can be approximated c 2 / eff(a+b. T) B( , T) SR ( ) = B( eff, T) = c 1 /{ eff 5 [e -1] } Adjusted brightness temperature accounts for spectral smearing of the Planck function.
MODIS NEd. R Estimate Band 20 Band 21 Band 22 Band 23 Band 24 Band 25 Band 27 Band 28 Band 29 Band 30 Band 31 Band 32 Band 33 Band 34 Band 35 Band 36 3. 7 um 3. 9 4. 0 4. 45 4. 5 6. 7 7. 3 8. 6 9. 7 11. 0 12. 0 13. 3 13. 6 13. 9 14. 2 . 007 m. W/m 2/ster/cm-1. 02. 04. 025. 03. 045. 08. 07. 25. 2. 3. 3. 4. 6. 4. 5 Based on Earth Scene Data Day 01153, 20: 10 UTC Clear scenes of the Pacific Ocean Note: Some SG present in MWIR Used 150 x 28 box (420 data points per detector)
MODIS Terra
MODIS Terra cont.
MODIS Aqua
MODIS Band 27 (6. 7 m), 2001 -06 -04 16: 45 UTC On-orbit correction largely effective, but temporal dependence of the correction is evident in testing. Original L 1 B (V 003) Destriped
Band 27; 6. 77 um
Band 34 Noisy Detectors
Baja 11 um Pre launch correction 14. 3 um Post launch correction 14. 3 um Considerable effort required to tune the correction of the optical leak at 11 um for MODIS. Estimated accuracy limited to 12% by residual optical crosstalk influence in atmospheric bands.