Quality Improvement in the Retail Setting Stan Jeppesen

- Slides: 47
Quality Improvement in the Retail Setting Stan Jeppesen, Pharm. D. Washington State Board of Pharmacy
Objectives Provide an introduction into flow chart analysis n Identify simple processes for monitoring system integrity and identifying opportunities for process improvement n Identify basic principles of a PDSA (Plan, Do, Study, Act) cycle n
Objectives Review basic principles of Continuous Quality Improvement (CQI) that apply to conducting PDSA cycles and data collection n Provide a simple examples of two PDSA cycles n Identify how the PDSA cycles can be applied in the retail setting n
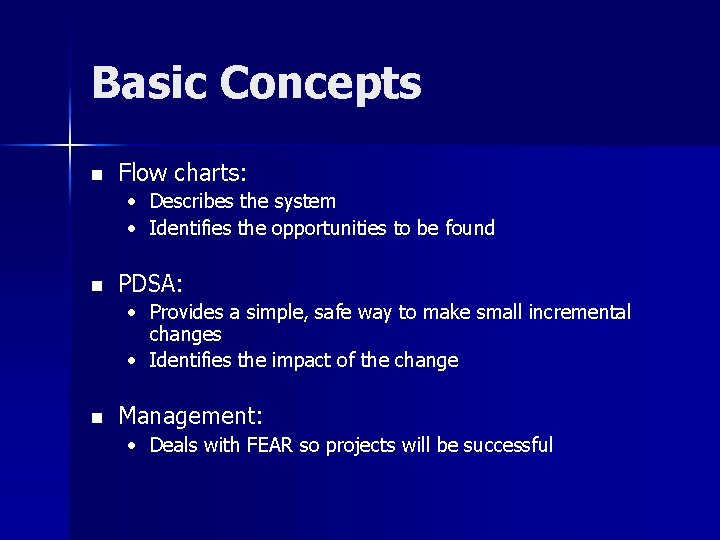
Basic Concepts n Flow charts: • Describes the system • Identifies the opportunities to be found n PDSA: • Provides a simple, safe way to make small incremental changes • Identifies the impact of the change n Management: • Deals with FEAR so projects will be successful
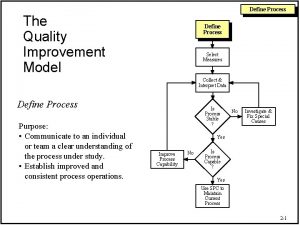
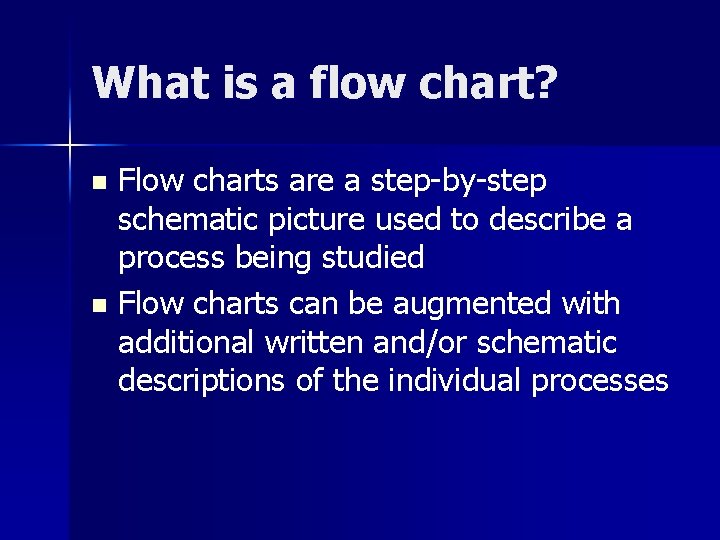
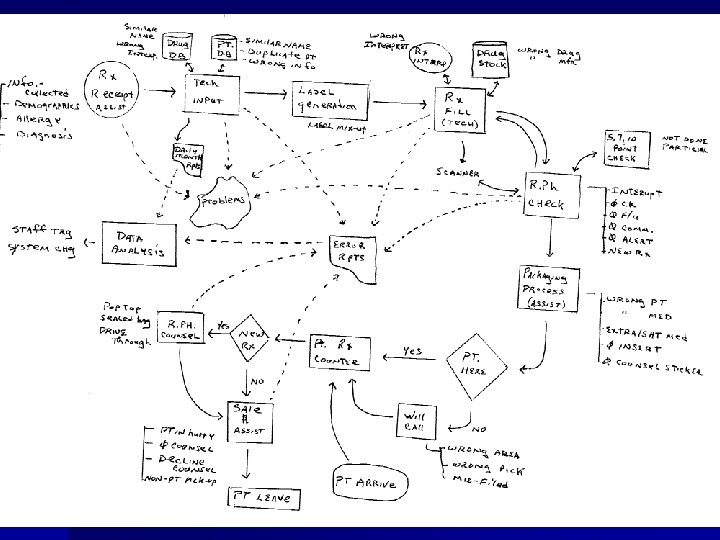
What is a flow chart? Flow charts are a step-by-step schematic picture used to describe a process being studied n Flow charts can be augmented with additional written and/or schematic descriptions of the individual processes n
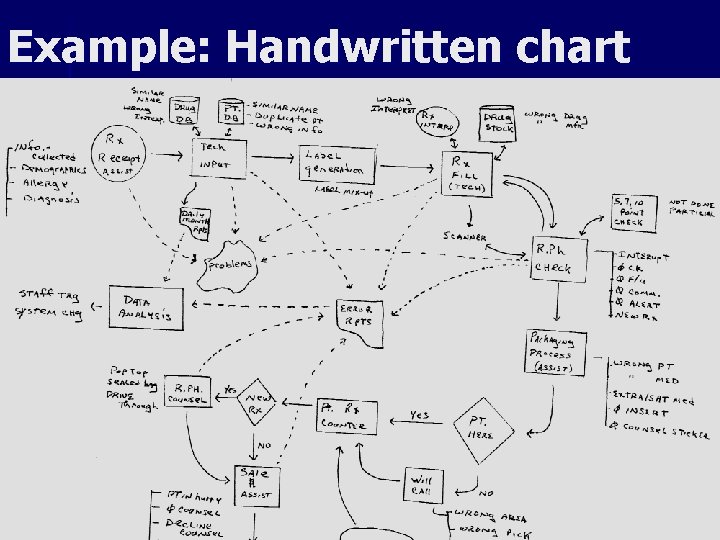
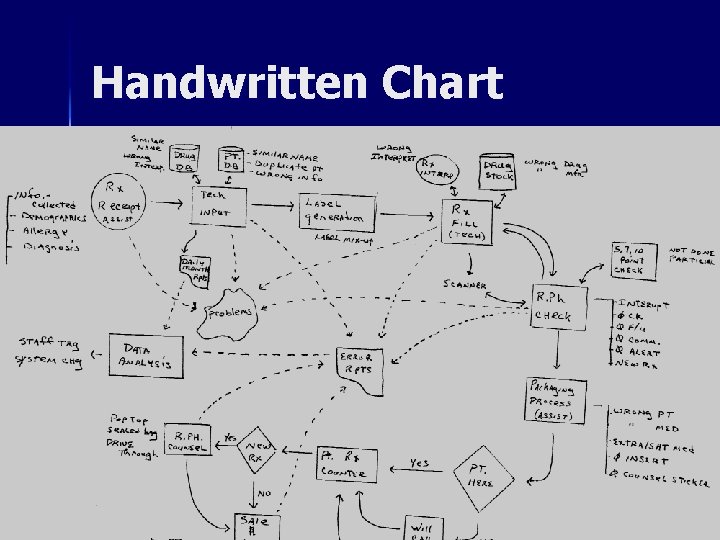
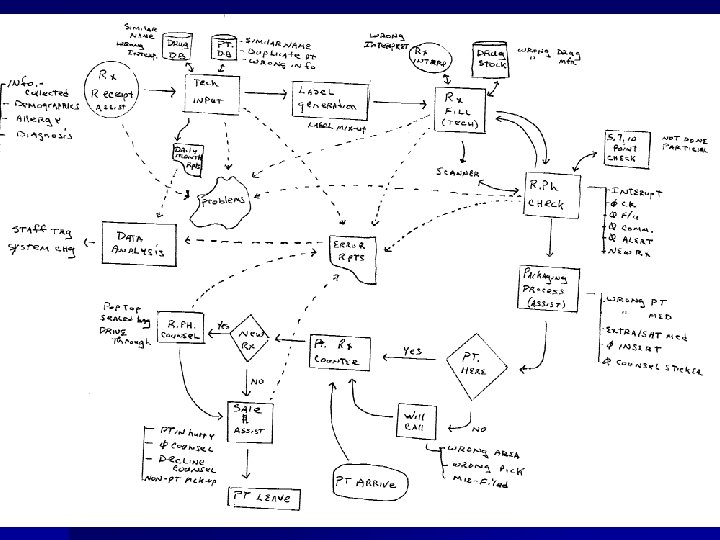
Example: Handwritten chart
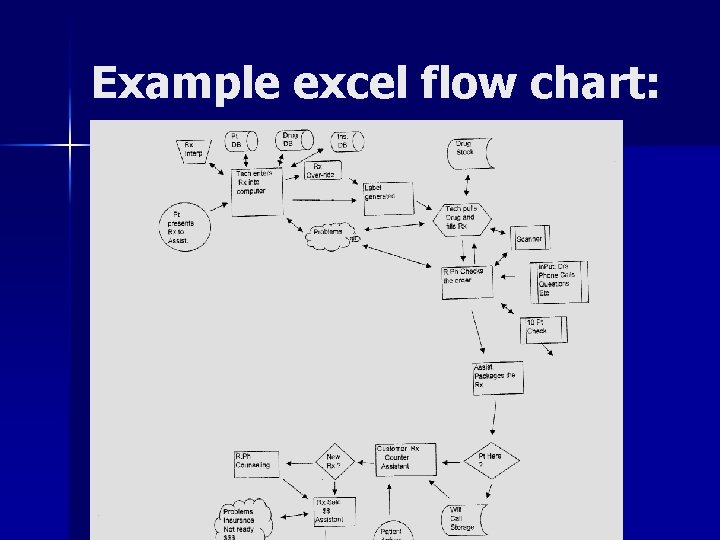
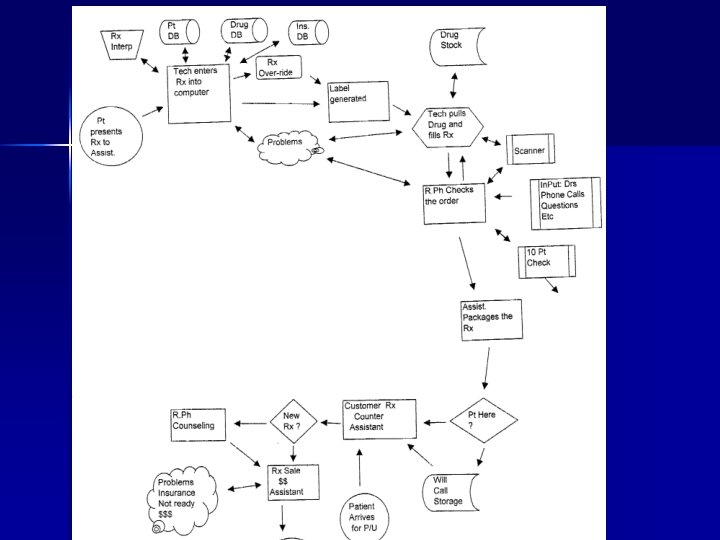
Example excel flow chart:
What does it do for you? n Provides common reference points n Standard language to use when talking about an existing process n Describes new improved system(s).
What does it do for you? n It allows you to easily describe an entire process n Allows for identification of processes and procedures n It is a powerful communication tool
Why Use It? n To help identify the root cause of a problem n To help Identify opportunities for improvement(s)
Reference Attachments n See example flow chart attachments n See example data collection tools
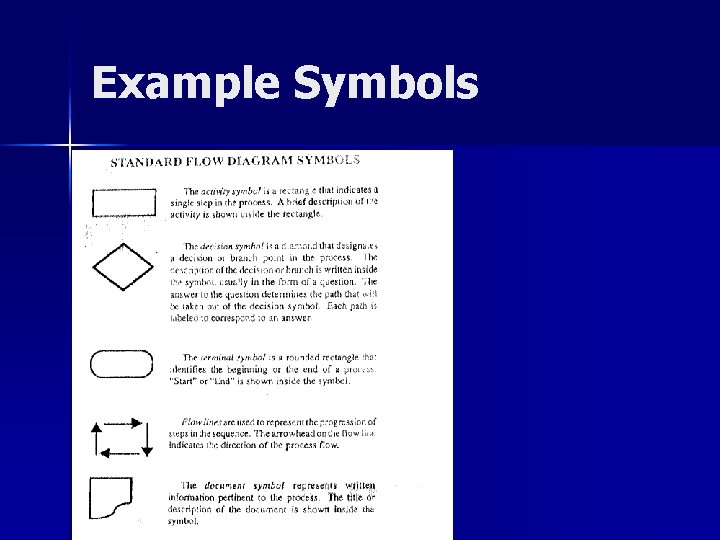
Example Symbols
Handwritten Chart
Basic flow chart
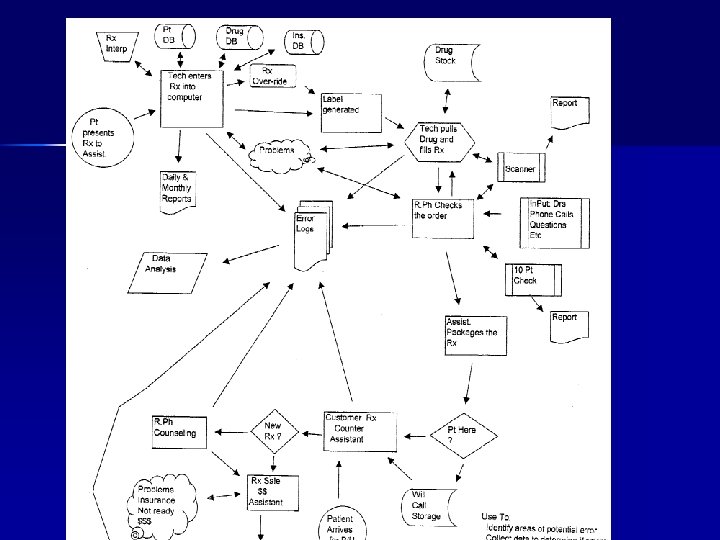
Flow chart c logs
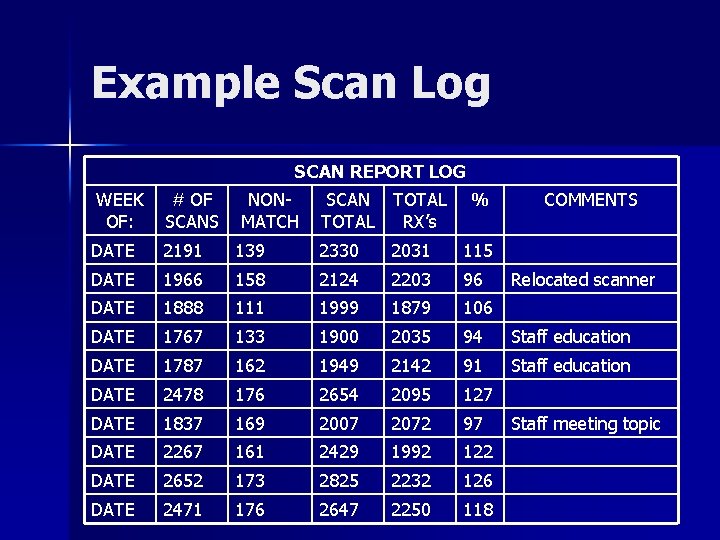
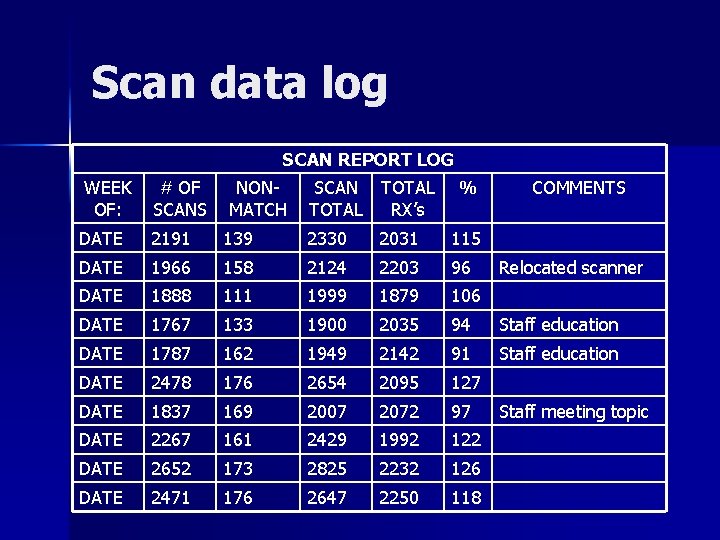
Example Scan Log SCAN REPORT LOG WEEK OF: # OF SCANS NONMATCH SCAN TOTAL RX’s % COMMENTS DATE 2191 139 2330 2031 115 DATE 1966 158 2124 2203 96 DATE 1888 111 1999 1879 106 DATE 1767 133 1900 2035 94 Staff education DATE 1787 162 1949 2142 91 Staff education DATE 2478 176 2654 2095 127 DATE 1837 169 2007 2072 97 DATE 2267 161 2429 1992 122 DATE 2652 173 2825 2232 126 DATE 2471 176 2647 2250 118 Relocated scanner Staff meeting topic
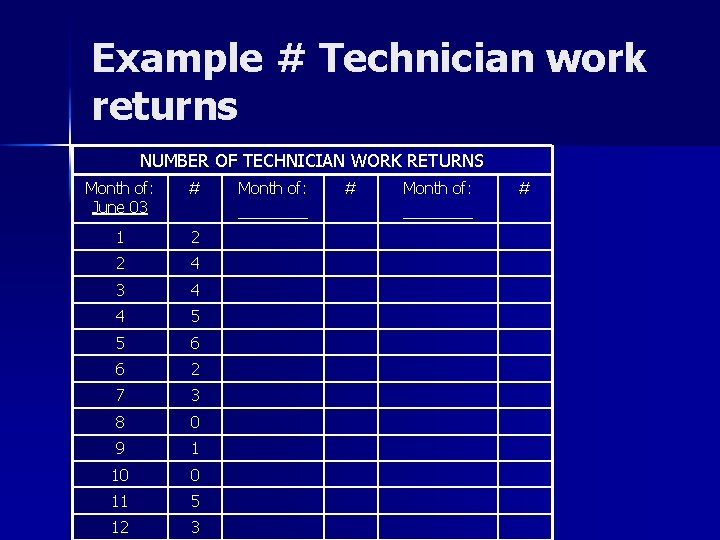
Example # Technician work returns NUMBER OF TECHNICIAN WORK RETURNS Month of: June 03 # 1 2 2 4 3 4 4 5 5 6 6 2 7 3 8 0 9 1 10 0 11 5 12 3 Month of: ________ #
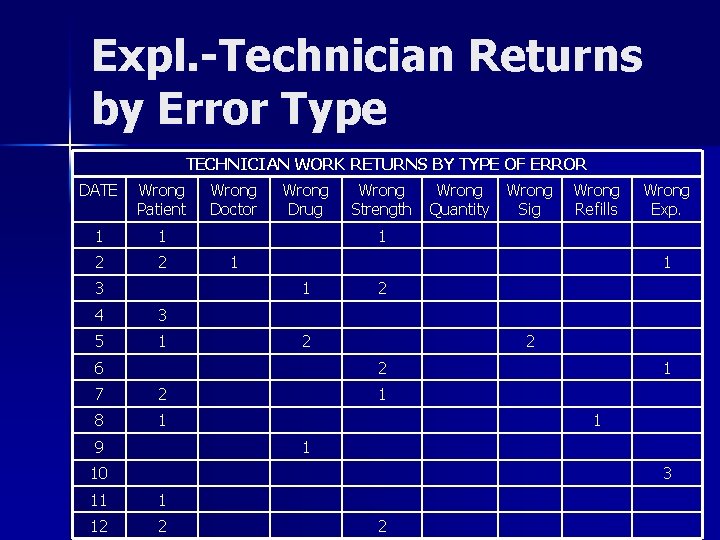
Expl. -Technician Returns by Error Type TECHNICIAN WORK RETURNS BY TYPE OF ERROR DATE Wrong Patient 1 1 2 2 3 Wrong Doctor Wrong Drug 3 5 1 Wrong Quantity Wrong Sig Wrong Refills 1 1 2 2 6 2 2 7 2 8 1 9 Wrong Exp. 1 1 4 Wrong Strength 1 1 10 3 11 1 12 2 2
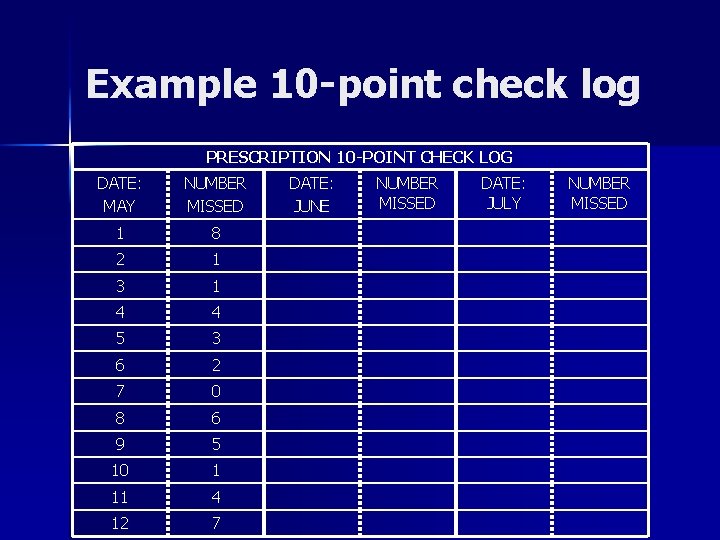
Example 10 -point check log PRESCRIPTION 10 -POINT CHECK LOG DATE: MAY NUMBER MISSED 1 8 2 1 3 1 4 4 5 3 6 2 7 0 8 6 9 5 10 1 11 4 12 7 DATE: JUNE NUMBER MISSED DATE: JULY NUMBER MISSED
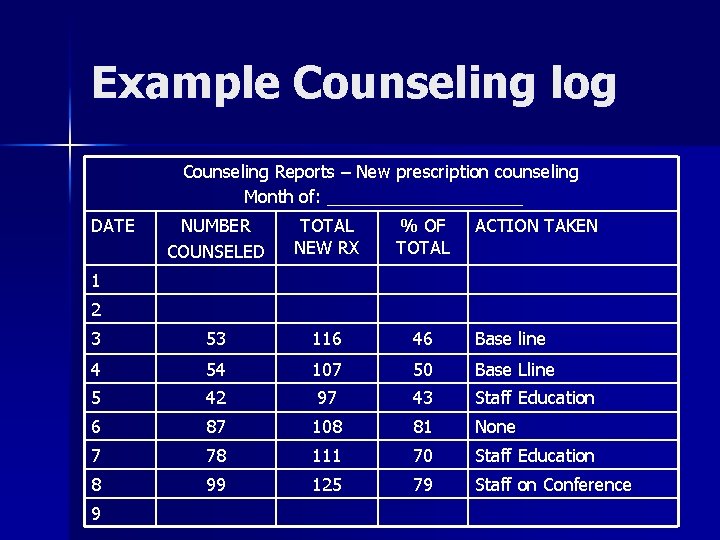
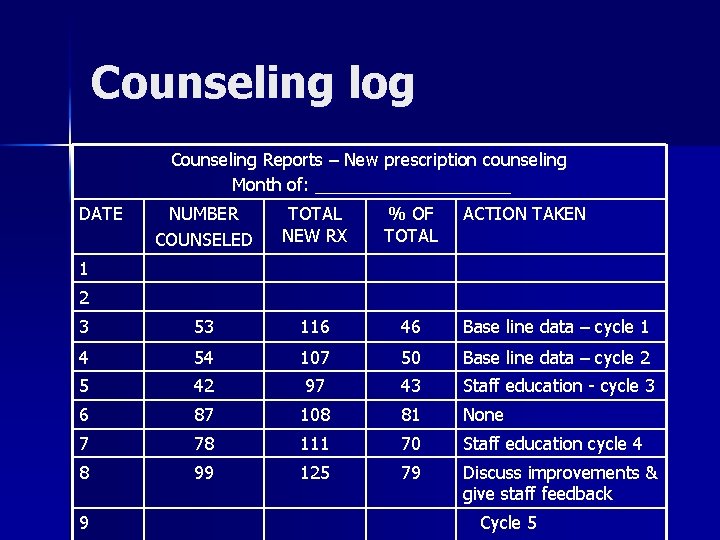
Example Counseling log Counseling Reports – New prescription counseling Month of: __________ DATE NUMBER COUNSELED TOTAL NEW RX % OF TOTAL ACTION TAKEN 3 53 116 46 Base line 4 54 107 50 Base Lline 5 42 97 43 Staff Education 6 87 108 81 None 7 78 111 70 Staff Education 8 99 125 79 Staff on Conference 1 2 9
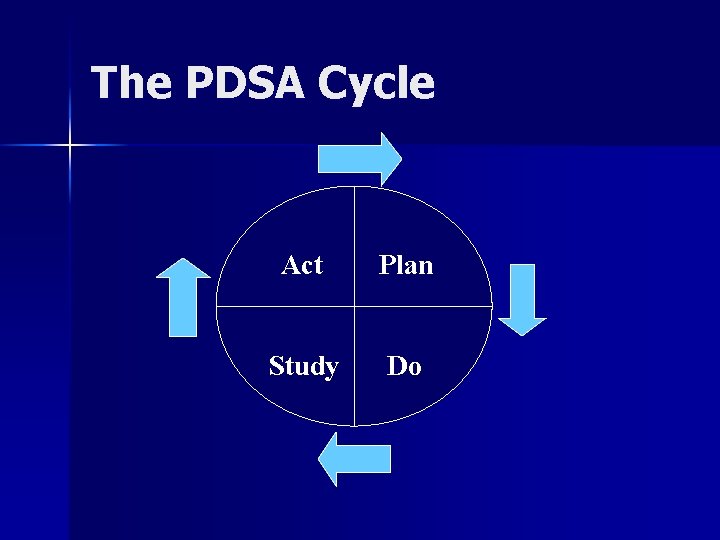
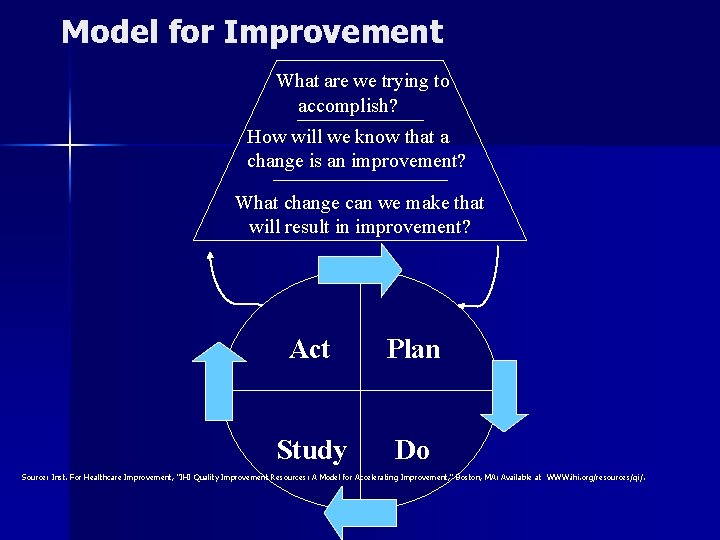
The PDSA Cycle Act Plan Study Do
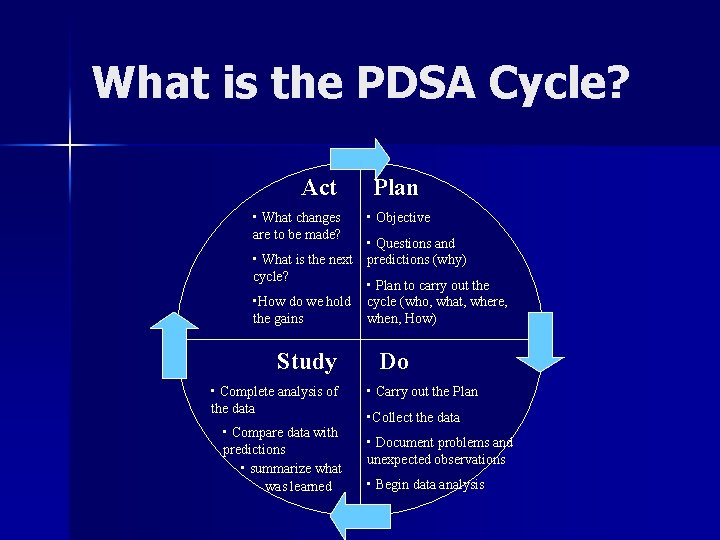
What is the PDSA Cycle? Act • What changes are to be made? Plan • Objective • Questions and • What is the next predictions (why) cycle? • Plan to carry out the • How do we hold cycle (who, what, where, the gains when, How) Study • Complete analysis of the data • Compare data with predictions • summarize what was learned Do • Carry out the Plan • Collect the data • Document problems and unexpected observations • Begin data analysis
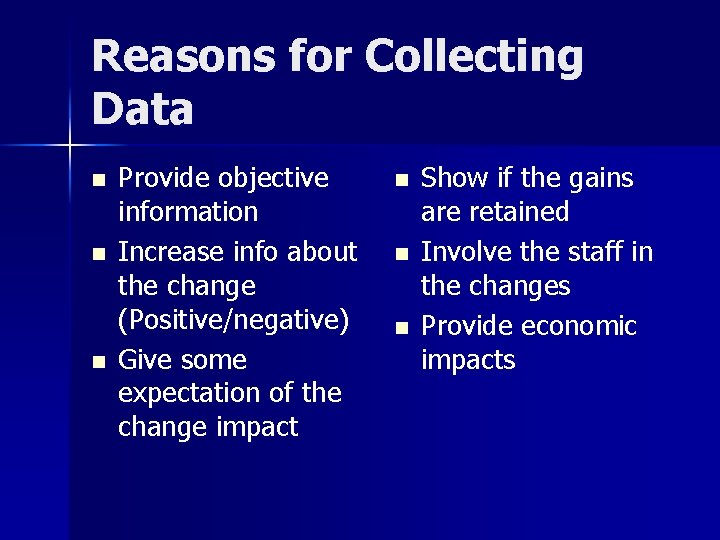
Reasons for Collecting Data n n n Provide objective information Increase info about the change (Positive/negative) Give some expectation of the change impact n n n Show if the gains are retained Involve the staff in the changes Provide economic impacts
Model for Improvement What are we trying to accomplish? How will we know that a change is an improvement? What change can we make that will result in improvement? Act Plan Study Do Source: Inst. For Healthcare Improvement, “IHI Quality Improvement Resources: A Model for Accelerating Improvement, ” Boston, MA: Available at WWW. ihi. org/resources/qi/.
Example Handwritten flow chart
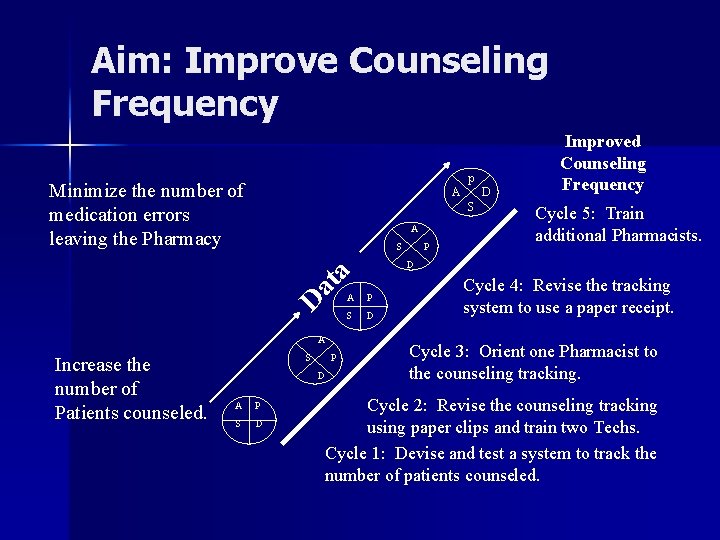
Aim: Improve Counseling Frequency p Minimize the number of medication errors leaving the Pharmacy A D S A S P Improved Counseling Frequency Cycle 5: Train additional Pharmacists. D at a D A Increase the number of Patients counseled. S P D A P S D Cycle 4: Revise the tracking system to use a paper receipt. Cycle 3: Orient one Pharmacist to the counseling tracking. Cycle 2: Revise the counseling tracking using paper clips and train two Techs. Cycle 1: Devise and test a system to track the number of patients counseled.
Counseling log Counseling Reports – New prescription counseling Month of: __________ DATE NUMBER COUNSELED TOTAL NEW RX % OF TOTAL ACTION TAKEN 3 53 116 46 Base line data – cycle 1 4 54 107 50 Base line data – cycle 2 5 42 97 43 Staff education - cycle 3 6 87 108 81 None 7 78 111 70 Staff education cycle 4 8 99 125 79 Discuss improvements & give staff feedback 1 2 9 Cycle 5
Counseling – flow chart
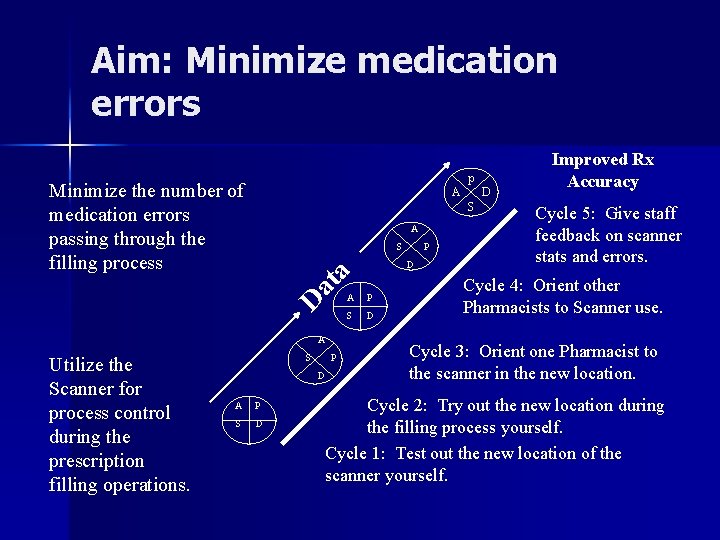
Aim: Minimize medication errors p Minimize the number of medication errors passing through the filling process A A S P D at a D A Utilize the Scanner for process control during the prescription filling operations. D S S P D A P S D Improved Rx Accuracy Cycle 5: Give staff feedback on scanner stats and errors. Cycle 4: Orient other Pharmacists to Scanner use. Cycle 3: Orient one Pharmacist to the scanner in the new location. Cycle 2: Try out the new location during the filling process yourself. Cycle 1: Test out the new location of the scanner yourself.
Scan data log SCAN REPORT LOG WEEK OF: # OF SCANS NONMATCH SCAN TOTAL RX’s % COMMENTS DATE 2191 139 2330 2031 115 DATE 1966 158 2124 2203 96 DATE 1888 111 1999 1879 106 DATE 1767 133 1900 2035 94 Staff education DATE 1787 162 1949 2142 91 Staff education DATE 2478 176 2654 2095 127 DATE 1837 169 2007 2072 97 DATE 2267 161 2429 1992 122 DATE 2652 173 2825 2232 126 DATE 2471 176 2647 2250 118 Relocated scanner Staff meeting topic
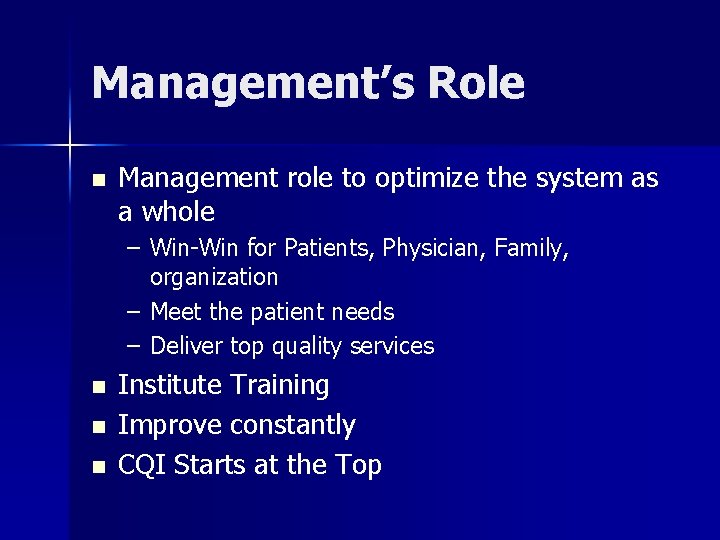
Management’s Role n Management role to optimize the system as a whole – Win-Win for Patients, Physician, Family, organization – Meet the patient needs – Deliver top quality services n n n Institute Training Improve constantly CQI Starts at the Top
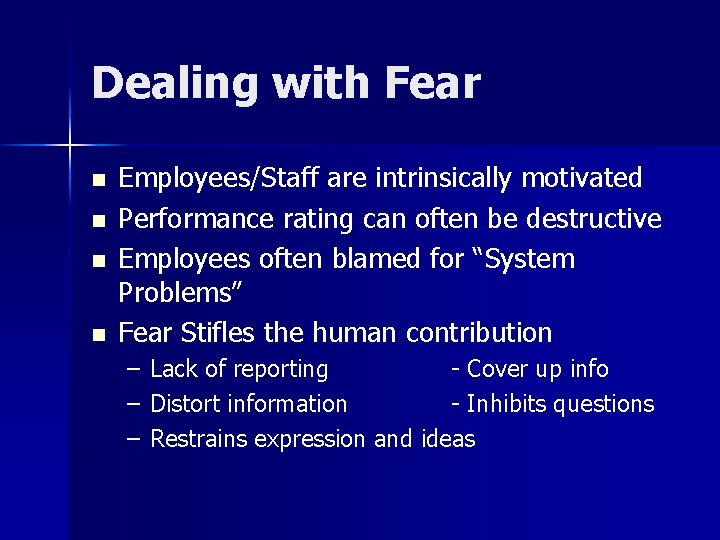
Dealing with Fear n n Employees/Staff are intrinsically motivated Performance rating can often be destructive Employees often blamed for “System Problems” Fear Stifles the human contribution – – – Lack of reporting - Cover up info Distort information - Inhibits questions Restrains expression and ideas
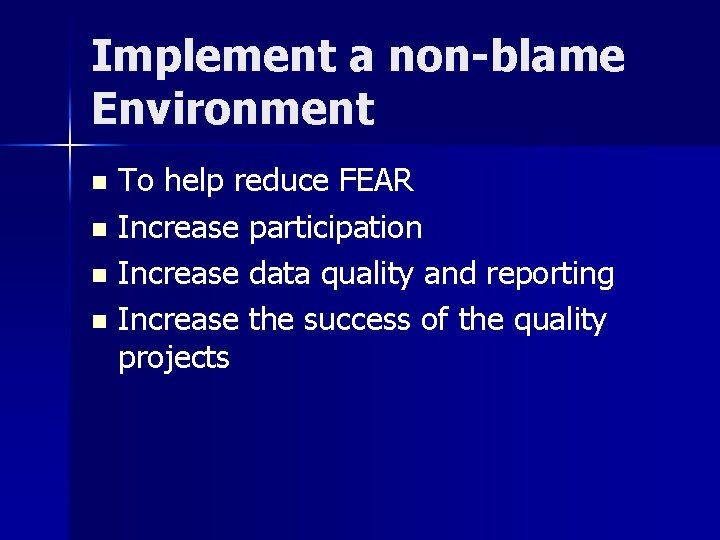
Implement a non-blame Environment To help reduce FEAR n Increase participation n Increase data quality and reporting n Increase the success of the quality projects n
Summary n Flow charts: • Describes the system • Identifies the opportunities to be found n PDSA: • Provides a simple, safe way to make small incremental changes • Identifies the impact of the change n Management: • Deals with FEAR so projects will be successful
Summary n n n Keep it simple Make it easy This is Not Hard Keep it a learning experience Have fun with it
Reach High for Quality
Questions? • Stan Jeppesen, Pharm. D. • Investigator for the Washington State Board of Pharmacy • Stan. Jeppesen@doh. wa. gov • (206) 528 -0732 Seattle Office
References n n n Kohn LT, Corrigan JM, Donaldson MS. To Error is Human. Institute of Medicine, National Academy Press 1999. Institute for Healthcare Improvement, BMJ Publishing Group. www. Quality. Health. Care. org Juran JM. Juan on Quality by Design. The Free Press, 1992. Deming WE. Out of the Crisis. Cambridge, MA; MIT Press 1986. Pharmacists Quality Improvement Project I, February 21, 2002. Qualis Health. www. qualishealth. org Pharmacists Quality Improvement Project II, March 14, 2003. Qualis Health. www. qualishealth. org
When an Error Occurs What do you do? ? n What does the patient want? n What is your liability? n How do you handle it? n
When an Error Occurs What do you do? Complete an error report? n Admit no guilt or participation? n Determine the cause or who? n Hope the incident goes away? n
What does the patient want? An acknowledgement of the error n An admission of guilt n An admission of alarm over the potential harm n That the cause will be fixed and not repeated n That they or someone else won’t get hurt in the future n
Why do patient report errors No sense or admission of caring n Fear that “they” will do it again and hurt someone n Denial by the staff that they made a mistake n No apology n It has occurred twice before n They made it appear to my fault n
What is Your Liability? Has the patient been injured? n Did the patient suffer a financial loss? n
What are we afraid of? Lawsuits ? Legal Liability ? n Lower the Patient trust. . ? n Disclosure of embarrassing situation? n Revealing a personal failure? n Self-esteem n ? n
What should patient be informed of? What happened n What the error was n Why error happened n What has been learned –how it will be prevented n How sorry you are…the apology n