Process of Science Using mathematics and computational thinking

 and defining problems (for engineering)")


 The WAP is the location where the ACC is closest")

 that")


- Slides: 57
Process of Science
Using mathematics and computational thinking Asking questions (for science) and defining problems (for engineering) Engaging in argument from evidence Planning and carrying out investigations Constructing explanations (for science) and designing solutions (for engineering) Developing and using models Obtaining, evaluating, and communicating information Analyzing and interpreting data
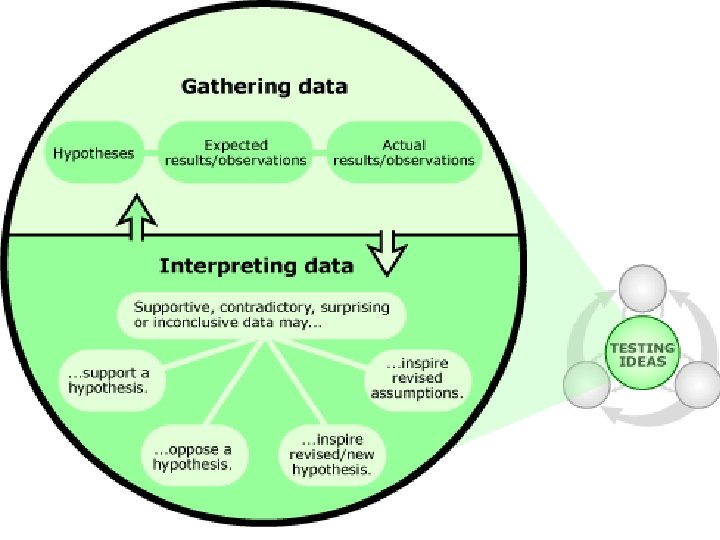
The Process of Science Diagram a flowchart of the process of science, labeling all major steps in the process.
Which best matches your model? Source: http: //undsci. berkeley. edu/
Science is an iterative process at all stages Source: http: //undsci. berkeley. edu/
Penguin Foraging Simulations & Graphing
Lunch? What do you like to eat for lunch? How far did you have to travel to get your lunch?
Penguins Lunch? What do penguins eat for lunch? How far do penguins have to travel to get their lunch?
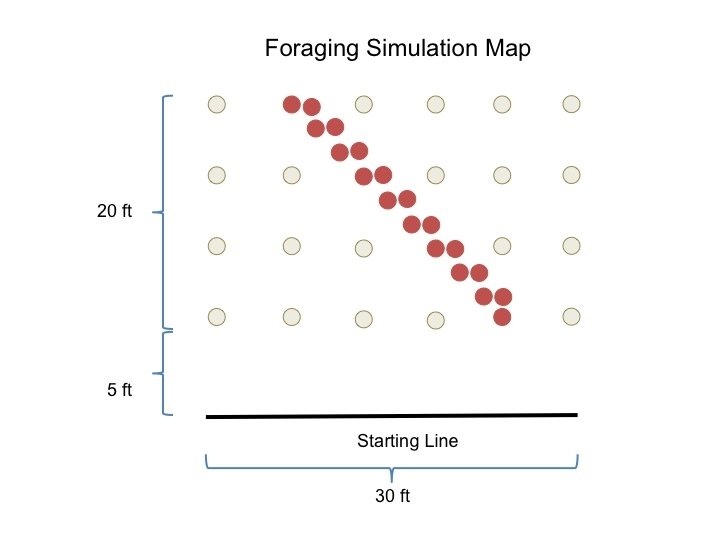
Adélie Penguin Simulation Only one goes at a time, other stays back to care for/protect chick. Objective = to collect as many krill (beads) as possible for chick. Two rounds total. Each round = 1 minute long. Plastic bag = stomach to fill. Collect krill using hand not holding plastic bag (your beak). Collect one krill from a bucket at a time. Need to change buckets before collecting next krill. But following krill can be from original bucket. Can stand lean over bucket (no kneeling or sitting). Cannot pick krill off of floor.
Adélie Penguin Simulation Data Round/Partner Round 1 Raw Data Round 1 Averaged Data Round 2 Raw Data Round 2 Averaged Data Convergence Zone Color Beads (Pink/Red) Other Color Beads (White)
Adélie Penguin Simulation Data
Adélie Penguin Simulation Results Which color of beads was there more of in each round? Did the difference between red and white beads change across the rounds (over time)? Which colors did you pick up more of during the game? Why?
Daily Questions 1. What influences where Adélie penguins forage for food?
Process of Science Reflection: Simulations & Graphing
The Process of Science How does the penguin activity mimic the scientific process?
The Process of Science How do we help students recognize how the activity mimics the process of science?
Process of Science Reflection: Authentic Data
Understanding data visualizations http: //www. pewinternet. org/2015/09/10/what-the-public-knows-and-does-not-know-about-science/
Nonsense Data Activity Debrief What aspects did you find surprising? What implications could this have on how you teach with data to your students? What helps us make sense of data?
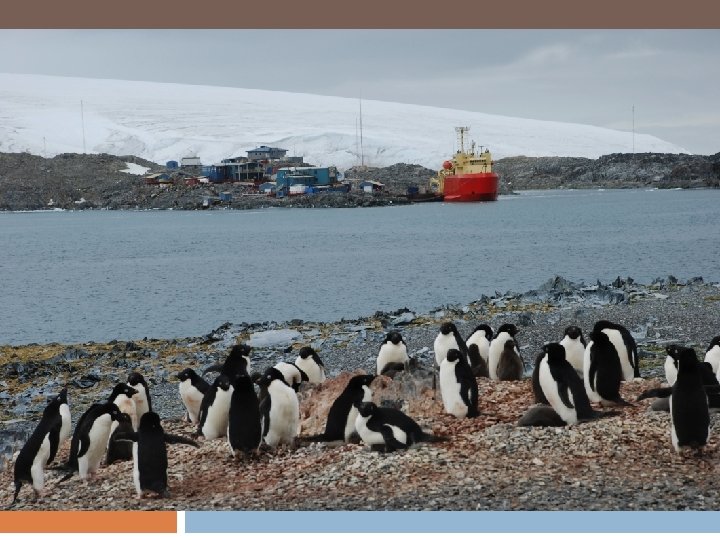
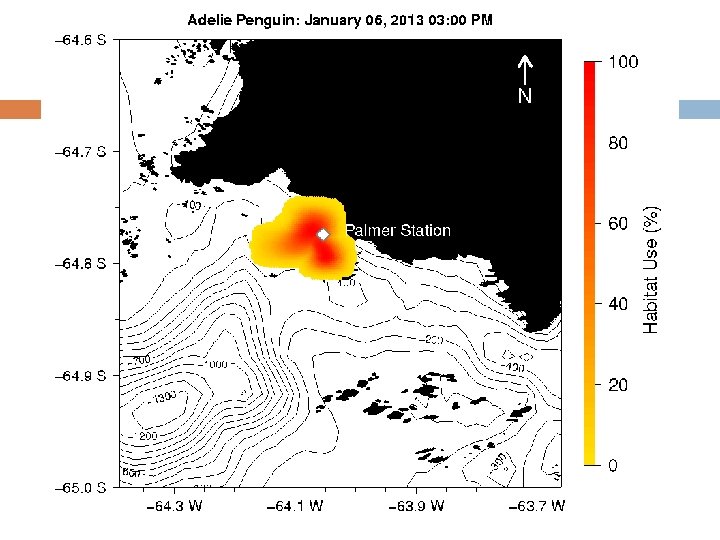
N Palmer Station
Satellite Tags
Why work with data? Take ~2 minutes to reflect on and write down your ideas to one or both of these prompts: 1) What is the pedagogical value of having students work with real data? 2) How can working with data help achieve science learning objectives?
Data Literacy = ability to ask and answer meaningful questions by collecting, analyzing, and making sense of data encountered in our everyday lives
Data visualization reading Students often do not know: ● where to start looking, ● how to make sense of what they see, ● how to relate it to other concepts being discussed in class.
Three Levels of Engagement with Data Visualizations
Once you have data in a data table and/or visualization OR model output. . .
Orientation - What is there on the page? Things that students are doing to answer the question Example Determining what kind of graph it is I am looking at a line graph. . . Determining what the axes are / what the variables are …of average air temperature (°C) and time (year). Understanding the context of the data (metadata/data provenance, sort of) I need to know what temperature and time are and how the data on temperature and time were collected.
Then. . .
Interpretation - What does the data on the page show? Things that students are doing to answer the question Example Using pattern recognition to I see an increasing pattern. determine what is going on in the data in relation to the axes and other points. Determining if there are outliers. There are no obvious outliers, but there are some data points missing from the dataset. Determining the variation/range of the data. There is a lot of inter-annual variation. The average air temperature data ranges from a little over 10°C to around 14°C overall. But in the beginning of the time series it ranges from around 10°C to 13°C and at the end of the time series it ranges from around 12°C to 14°C. Deciding what the pattern in the data is showing with respect to the variables. Therefore the air temperature has been increasing over the time period of the data.
Finally. . .
Synthesis - What does that allow me to explain (with/about what is not on the page)? Things that students are doing to answer the question Articulating what that means with respect to things off of the page. Example The overall trend of increasing average air temperature means that organisms that live in New York City have experienced a 2°C increase in air temperature over the last 130 years. Articulating why that could be. There may be another factor, not graphed in this data figure, that is influencing air temperature during the time series. Relating the findings to prior Climate change has resulted in increased air knowledge of broader science temperatures in some areas since around the 1850 s. concepts. These data are of air temperature from the 1880 s to 2010 s and the overall pattern is increasing. Therefore, these data indicate that climate change could be resulting in an increased average air temperature in New York City.
REMEMBER - all three of levels are critical to truly understand make sense of data!
Plankton to Penguins – Modeling
Scientific Models What are scientific models? Why are they useful?
Scientific Models What are scientific models? Why are they useful? Let’s use an example to demonstrate how to elevate a food web game into a demonstration for your students of how scientists make and refine models.
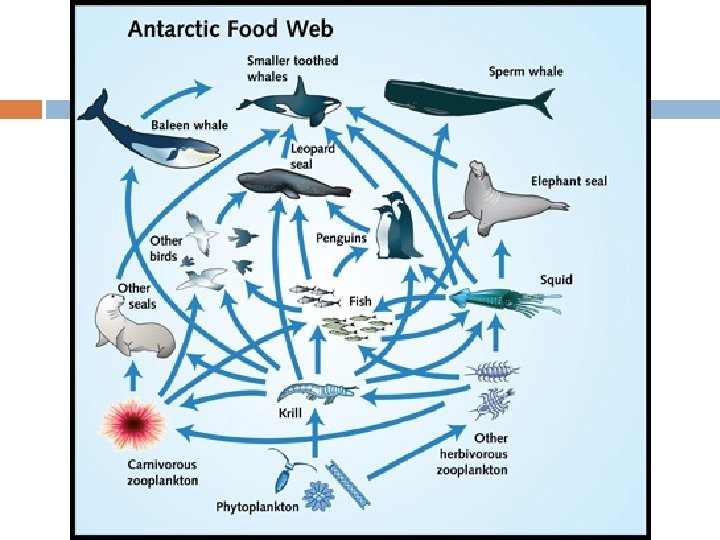
Antarctic Food Web
Krill in Antarctic Food Webs Phytoplankton
Krill Swarms Phytoplankton
Antarctic Circumpolar Current (ACC) The WAP is the location where the ACC is closest to the continent
Using the WAP as zone to study how rapid warming can alter food webs Seawater heat content 9 -2 Qslope (x 10 J m 9 J m ) -2) Heat content (x 10 50 -year changes in winter air temperature Martinson et al. 2008 °C Fastest winter warming location on Earth Increase of 6°C in the past 50 years Increase in ocean heat content
Food Web Game Instructions Each person a predator (icefish, whale, seal, penguin, petral) that feeds on zooplankton. Predator card says what and how much food needed per round (season). Set up Round 1 board: krill (red/pink/orange beads) go beneath ice sheet, salps (white/black/grey beads) go in the open water. Objective = to collect enough food to survive the season. Two rounds total. Each round = 1 turn each. Collect enough food/beads (krill or salps) so you have energy to last to the next round (season). Not enough food = not enough energy = tired, but safe. Record in the Antarctic Food Web Data Table how much food each consumed in the round (season). Play Round 2. Two rounds not enough energy = leave ecosystem.
Post-Game Discussion How did the Food Web game mimic a scientific model? How could the game be used to refine a scientific model? In what other ways can you use activities to demonstrate this important process of science (building and refining models to test ideas)
Pulling it All Together
The Process of Science What aspects of the process of science do we want to get across to our students? What are we trying to help them accomplish in terms of their understanding of the process of science?
The Process of Science How do we help students recognize how an activity mimics the process of science? What else can we add into our teaching/classes to highlight and illuminate the process of science?
How to Share Your Expertise with Scientists
Expert to Novice What do you do to translate science for your students (novice learners)? How do you anticipate giving feedback to the scientists to help them translate their science?
Key Principles of “Experts” vs “Novices” Experts Novices Notice features & meaningful patterns Often focus on surface attributes. noticed by novices Knowledge organized around “big ideas” that guide thinking. Problems approached with focus on concepts & rationale for why they apply. Don’t “chunk information. ” Knowledge is memorized in lists of facts & laws, & so problem solving requires searching for correct formulas, equations, & rules to plug & manipulate. Flexibly & selectively retrieve important & relevant aspects of their knowledge. They are less likely to know the conditions under which specific knowledge is applied. Slide developed by Catherine Halverson (UC-Berkel
From: Ambrose et al. 2012. How Learning Wo
Which is Expert? Novice? Why? From: Ambrose et al. 2012. How Learning Wo
Translating your Expertise for a Novice How do you convey the most important parts of your teaching for a non-expert audience (parents, media, town council, general public, etc. ) Would you use the same strategies for a different audience? Really complex or simple topics?
Strategies for translating science Let’s discuss strategies for helping scientists translate their science to a novice audience