Practice I think it is colder in Philadelphia







- Slides: 113
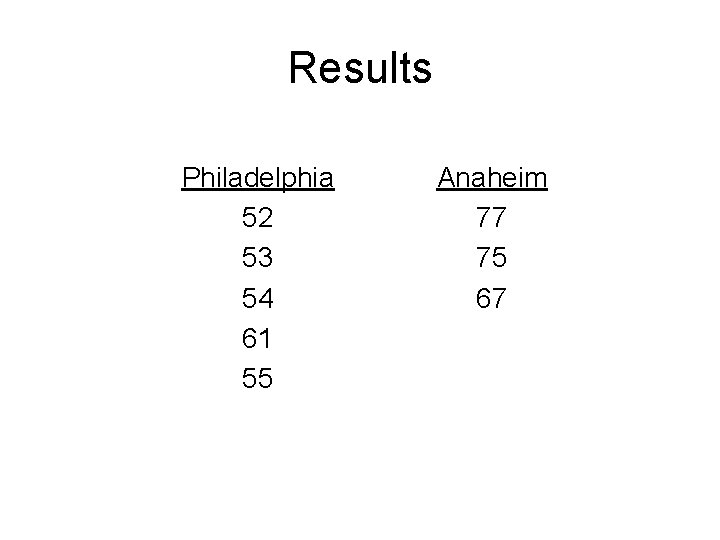
Practice • I think it is colder in Philadelphia than in Anaheim ( =. 10). • To test this, I got temperatures from these two places on the Internet.
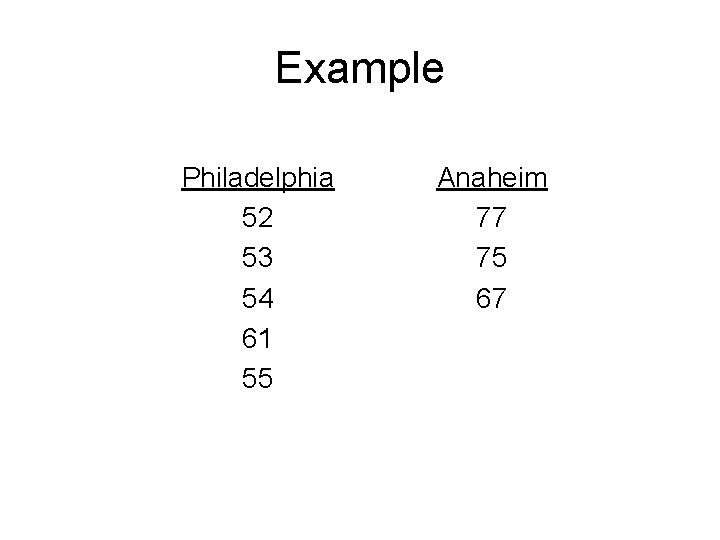
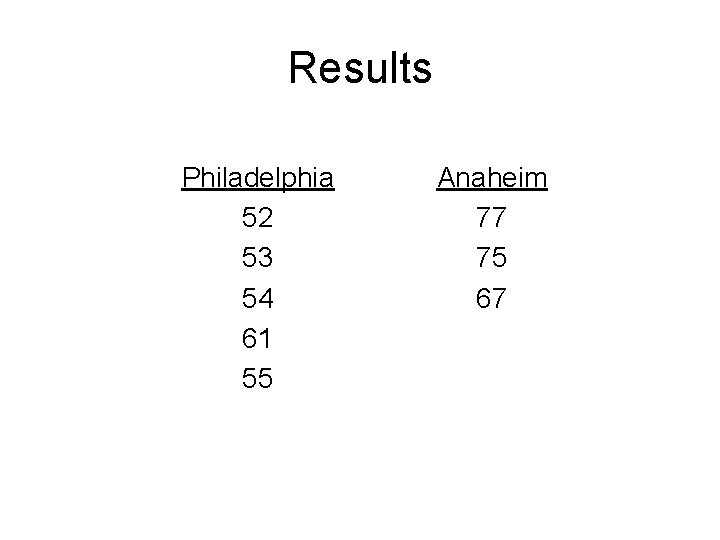
Results Philadelphia 52 53 54 61 55 Anaheim 77 75 67
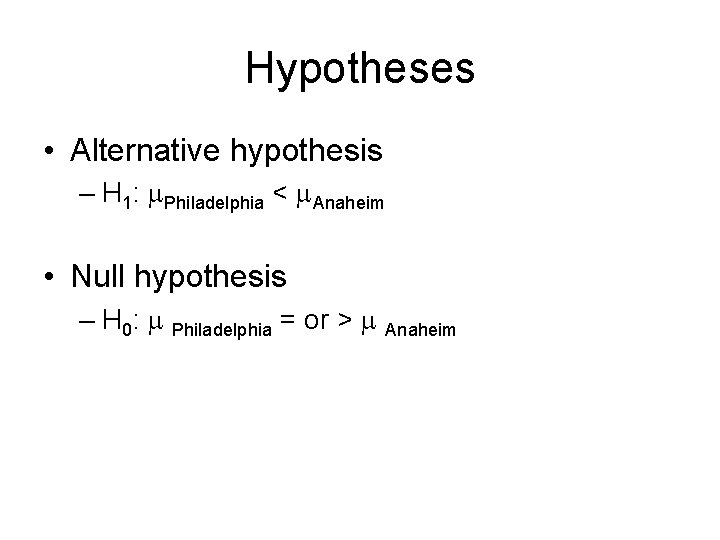
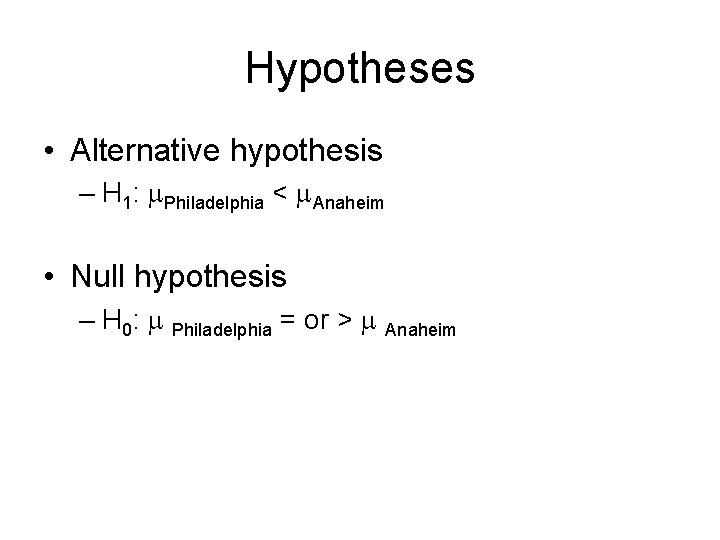
Hypotheses • Alternative hypothesis – H 1: Philadelphia < Anaheim • Null hypothesis – H 0: Philadelphia = or > Anaheim
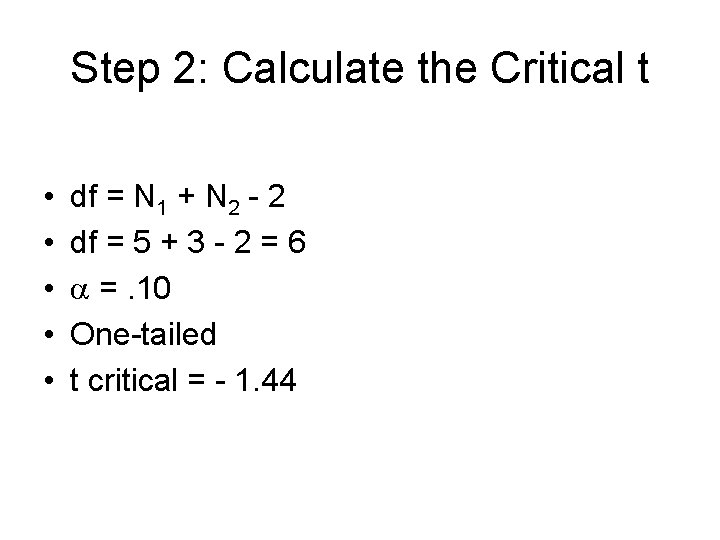
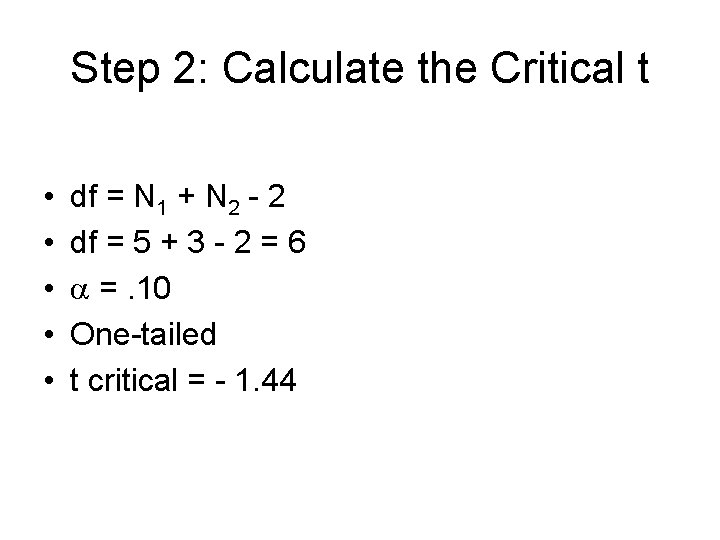
Step 2: Calculate the Critical t • • • df = N 1 + N 2 - 2 df = 5 + 3 - 2 = 6 =. 10 One-tailed t critical = - 1. 44
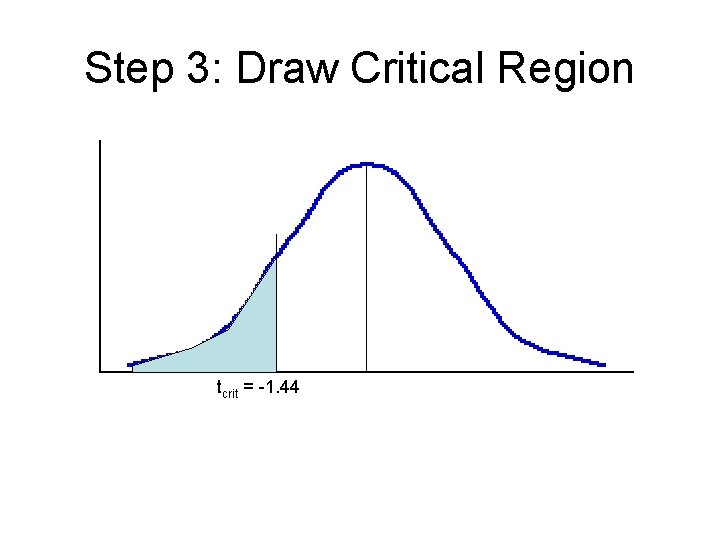
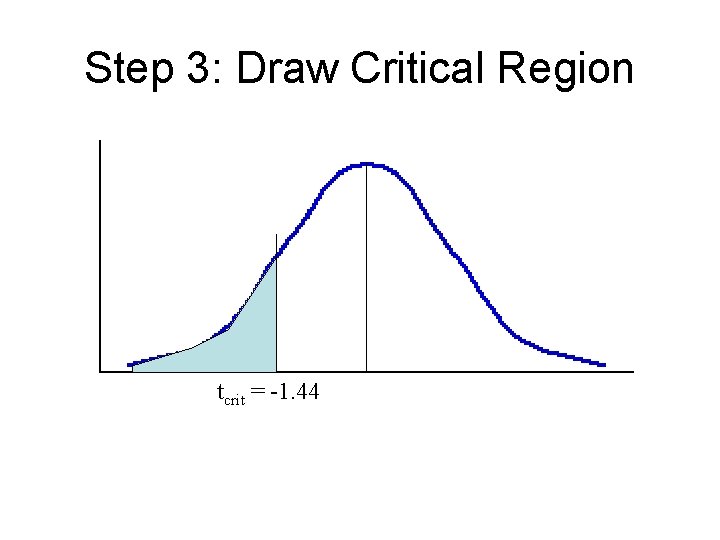
Step 3: Draw Critical Region tcrit = -1. 44
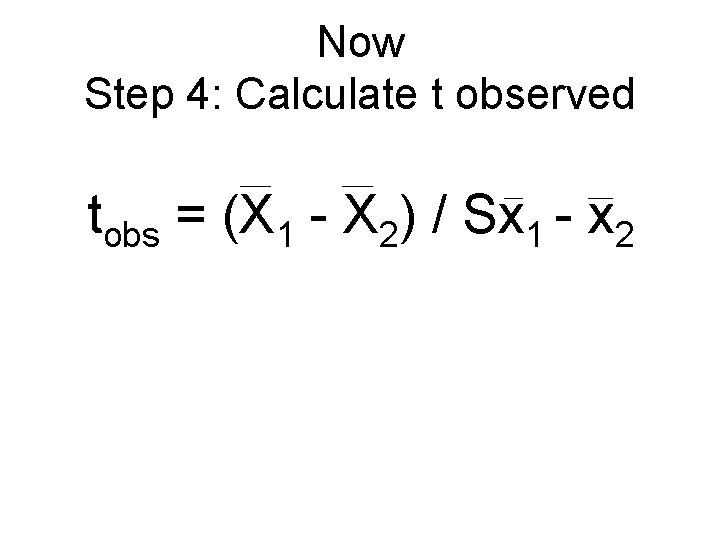
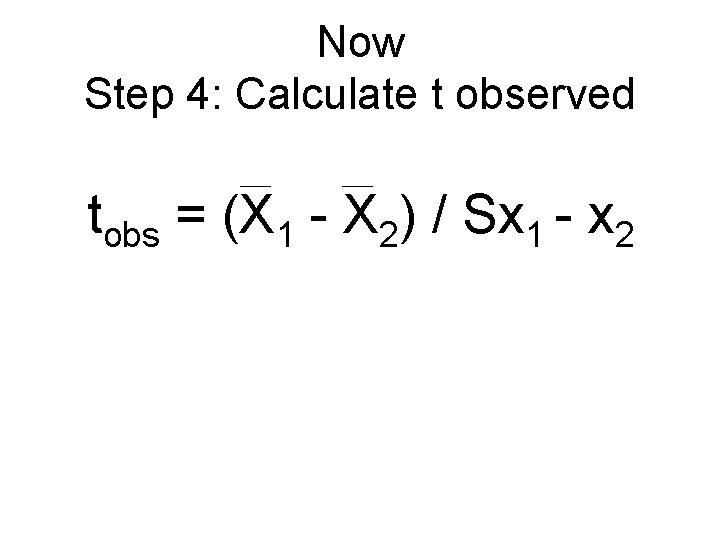
Now Step 4: Calculate t observed tobs = (X 1 - X 2) / Sx 1 - x 2
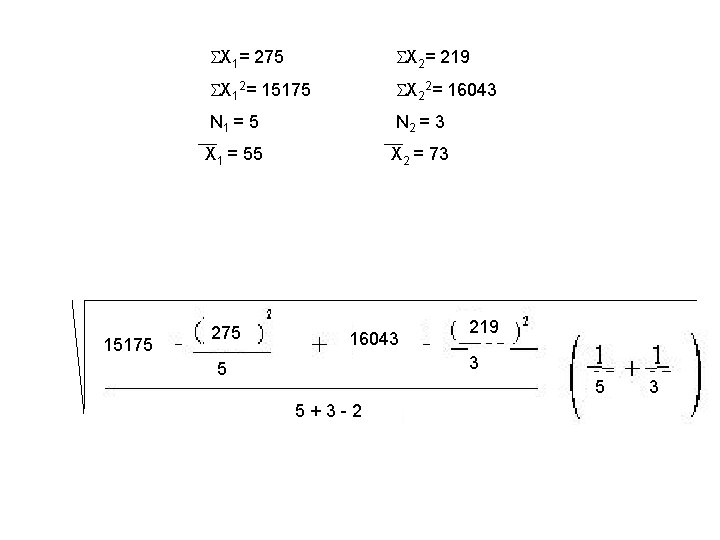
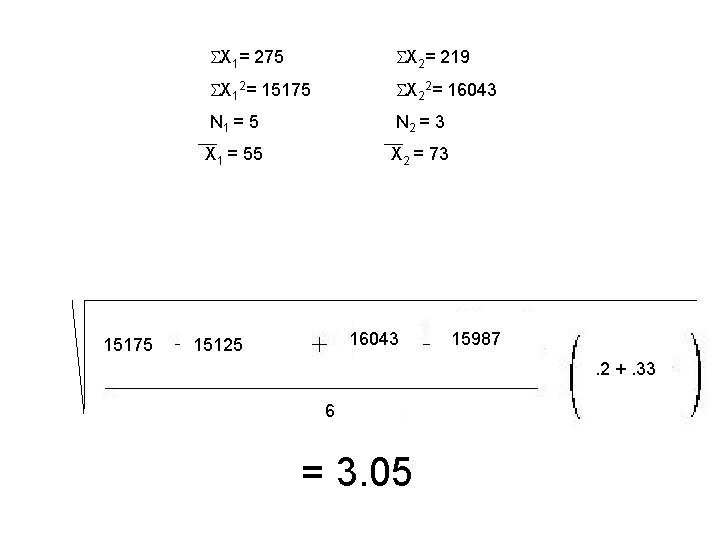
15175 X 1= 275 X 2= 219 X 12= 15175 X 22= 16043 N 1 = 5 N 2 = 3 X 1 = 55 X 2 = 73 275 16043 219 3 5 5 5+3 -2 3
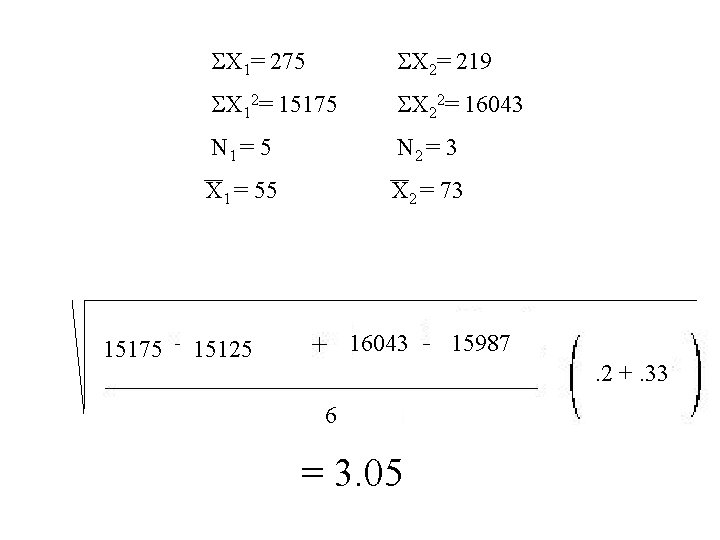
15175 X 1= 275 X 2= 219 X 12= 15175 X 22= 16043 N 1 = 5 N 2 = 3 X 1 = 55 X 2 = 73 275 15125 5 16043 6 = 3. 05 219 15987 3 . 2 +. 33 5 3
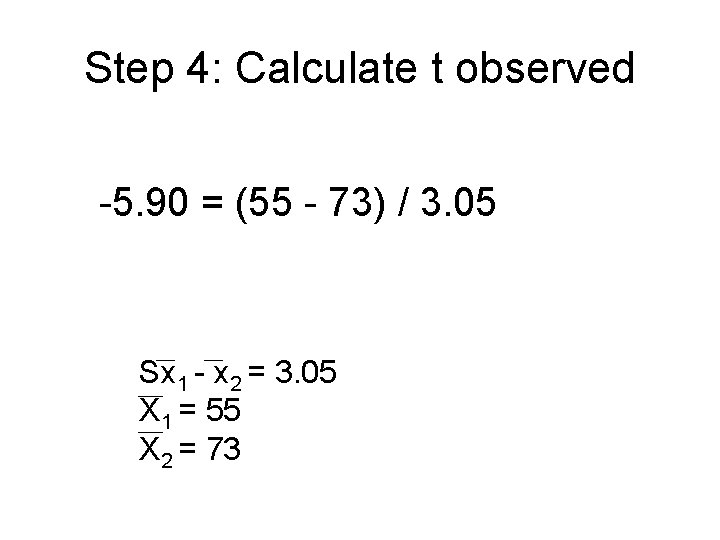
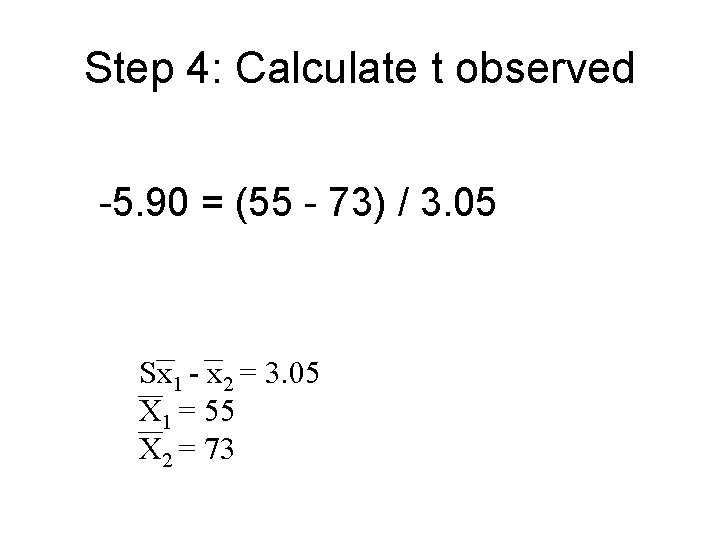
Step 4: Calculate t observed -5. 90 = (55 - 73) / 3. 05 Sx 1 - x 2 = 3. 05 X 1 = 55 X 2 = 73
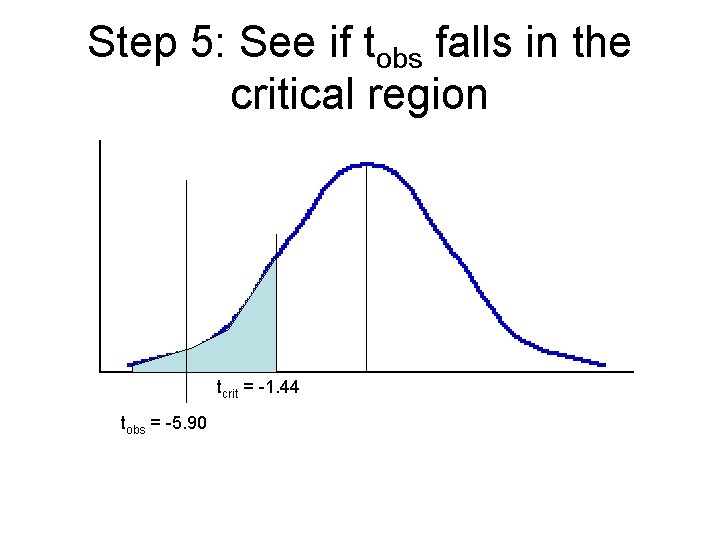
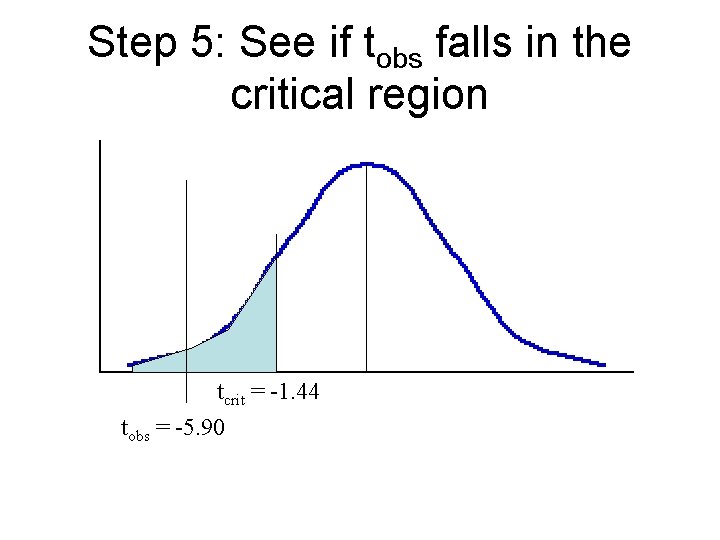
Step 5: See if tobs falls in the critical region tcrit = -1. 44 tobs = -5. 90
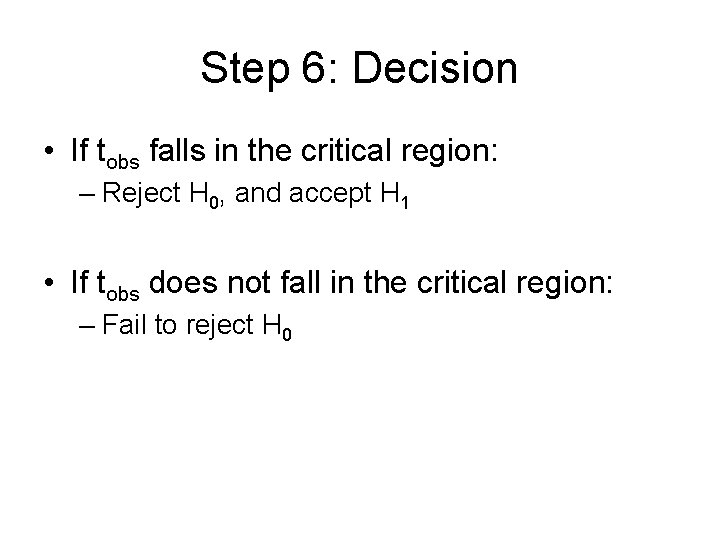
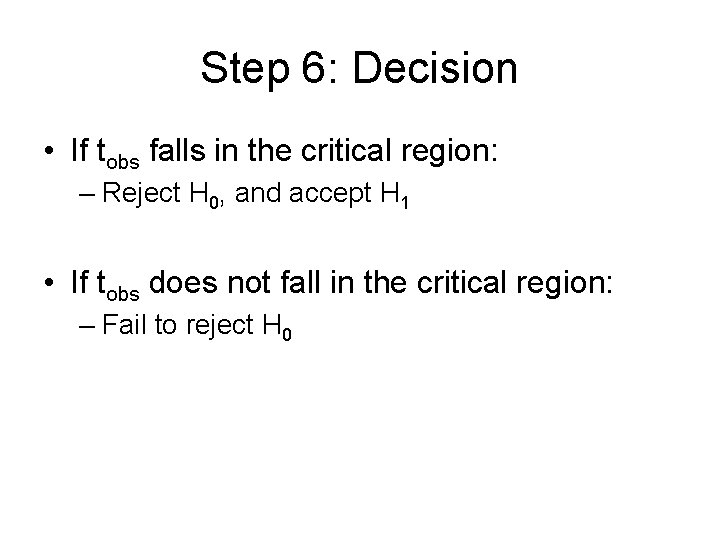
Step 6: Decision • If tobs falls in the critical region: – Reject H 0, and accept H 1 • If tobs does not fall in the critical region: – Fail to reject H 0
Step 7: Put answer into words • We Reject H 0, and accept H 1 • Philadelphia is significantly ( =. 10) colder than Anaheim.
So far. . • We have been doing independent samples designs • The observations in one group were not linked to the observations in the other group
Example Philadelphia 52 53 54 61 55 Anaheim 77 75 67
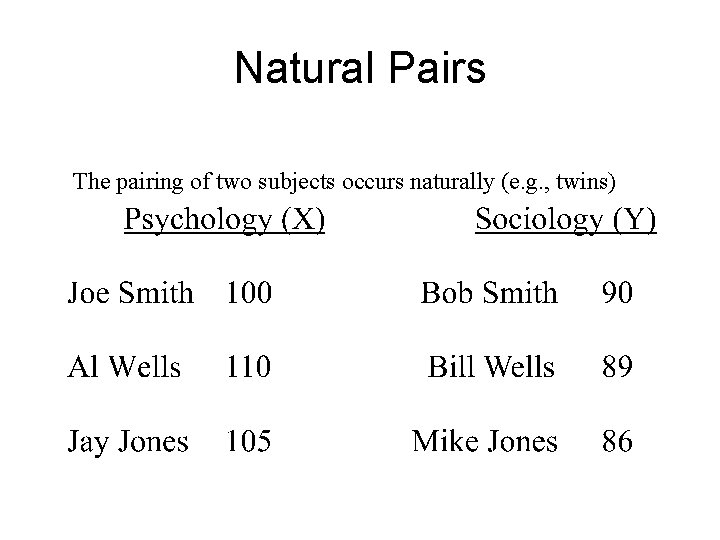
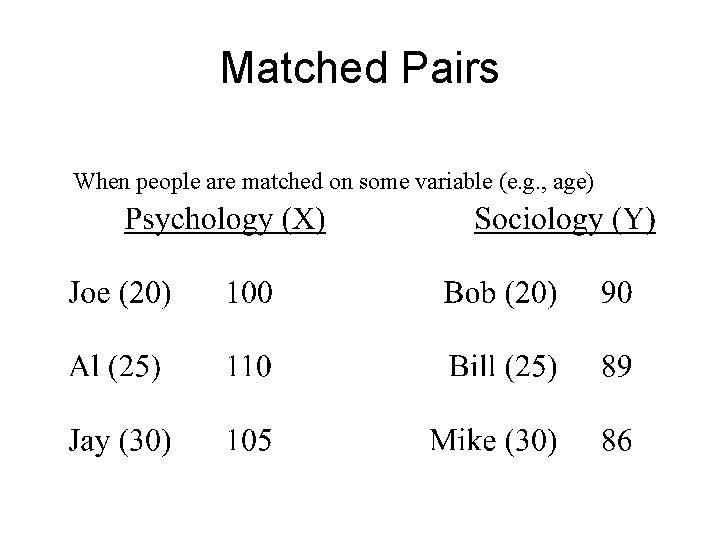
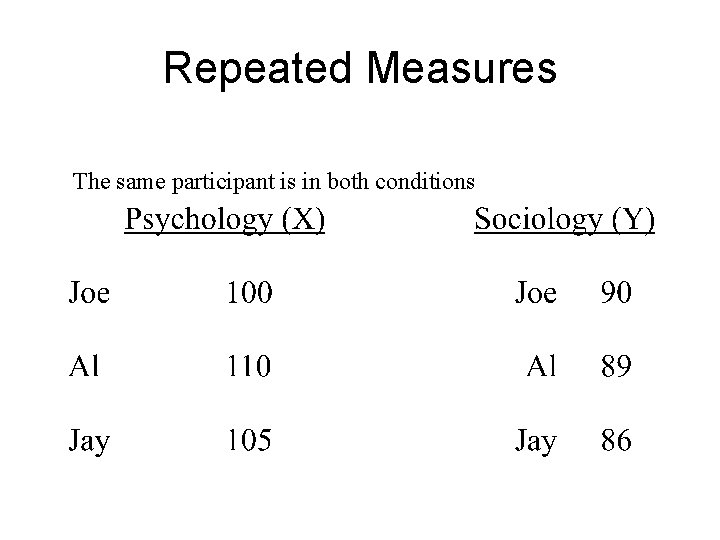
Matched Samples Design • This can happen with: – Natural pairs – Matched pairs – Repeated measures
Natural Pairs The pairing of two subjects occurs naturally (e. g. , twins)
Matched Pairs When people are matched on some variable (e. g. , age)
Repeated Measures The same participant is in both conditions
Matched Samples Design • In this type of design you label one level of the variable X and the other Y • There is a logical reason for paring the X value and the Y value
Matched Samples Design • The logic and testing of this type of design is VERY similar to what you have already done!
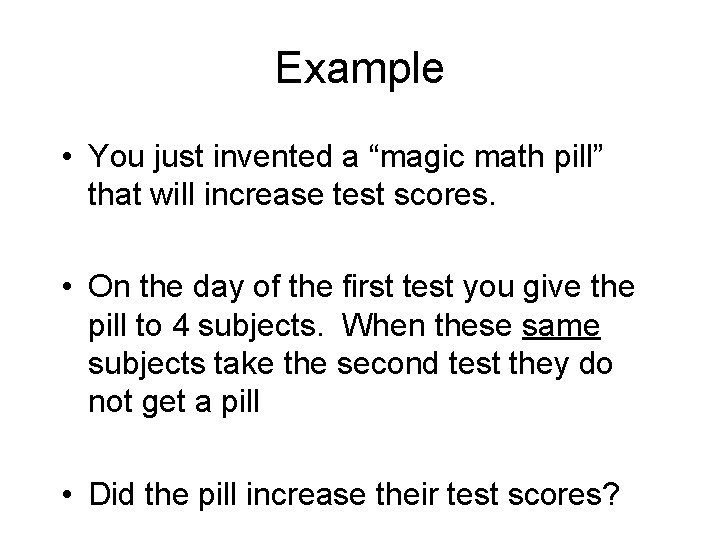
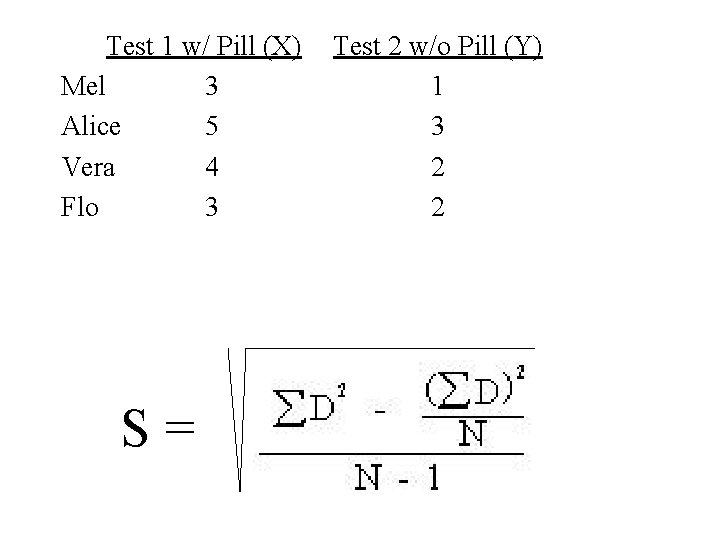
Example • You just invented a “magic math pill” that will increase test scores. • On the day of the first test you give the pill to 4 subjects. When these same subjects take the second test they do not get a pill • Did the pill increase their test scores?
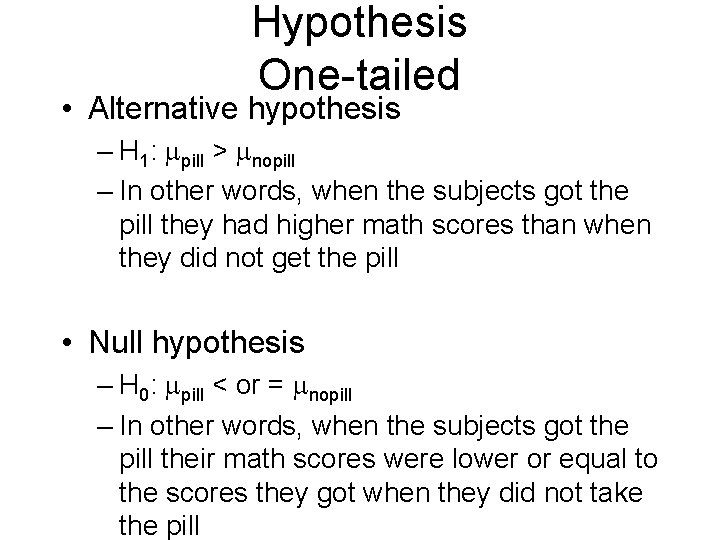
Hypothesis One-tailed • Alternative hypothesis – H 1: pill > nopill – In other words, when the subjects got the pill they had higher math scores than when they did not get the pill • Null hypothesis – H 0: pill < or = nopill – In other words, when the subjects got the pill their math scores were lower or equal to the scores they got when they did not take the pill
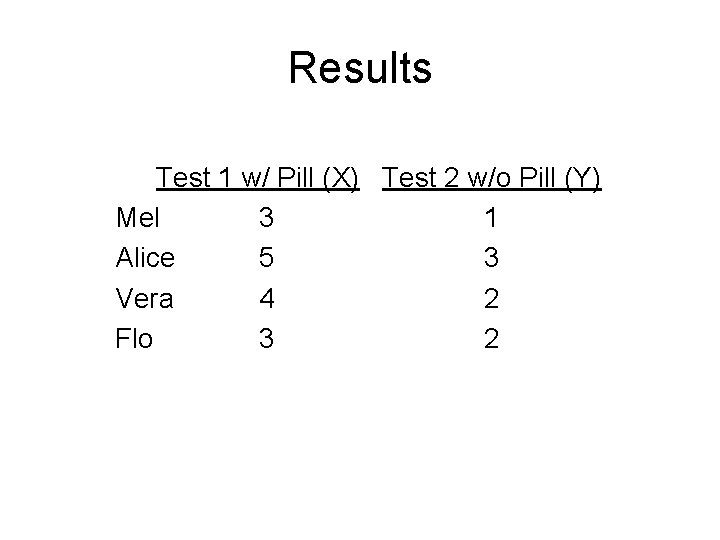
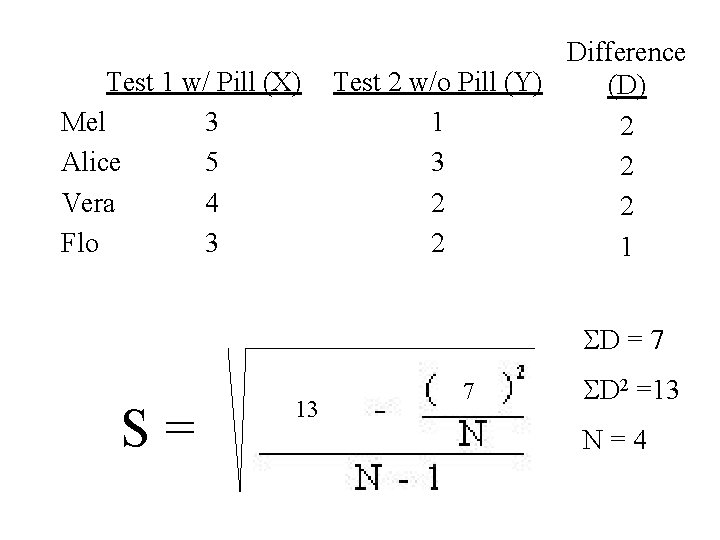
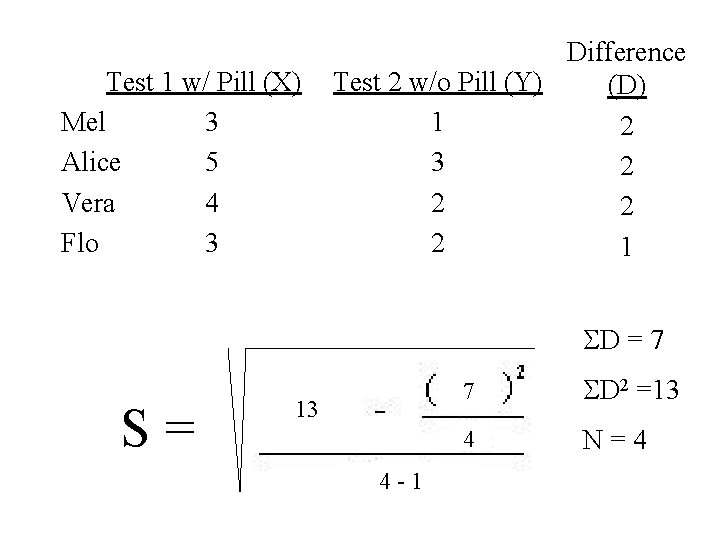
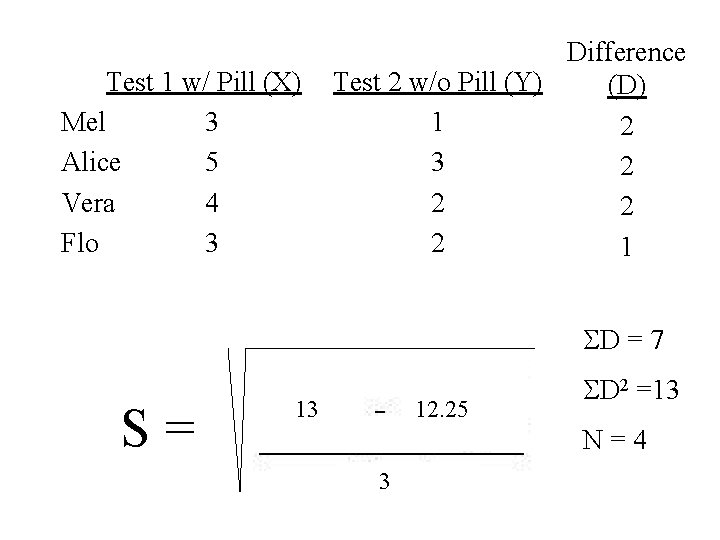
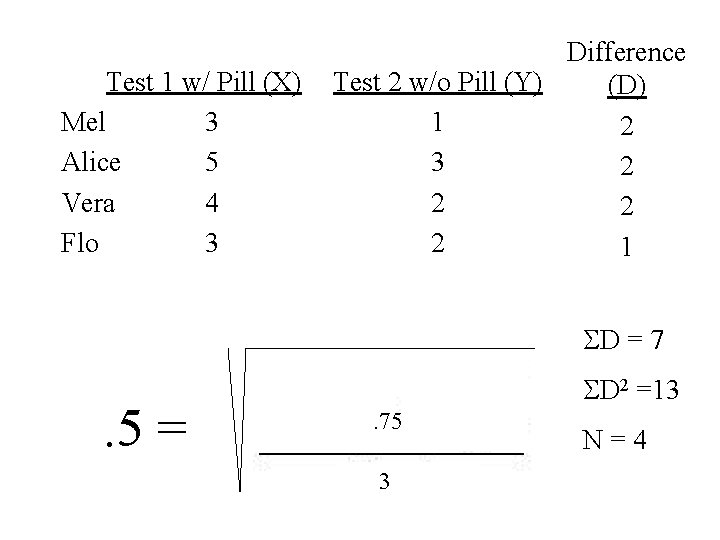
Results Test 1 w/ Pill (X) Test 2 w/o Pill (Y) Mel 3 1 Alice 5 3 Vera 4 2 Flo 3 2
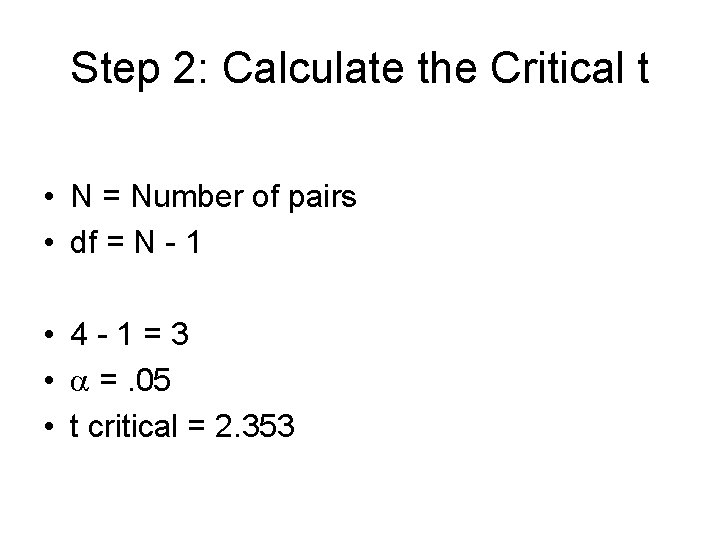
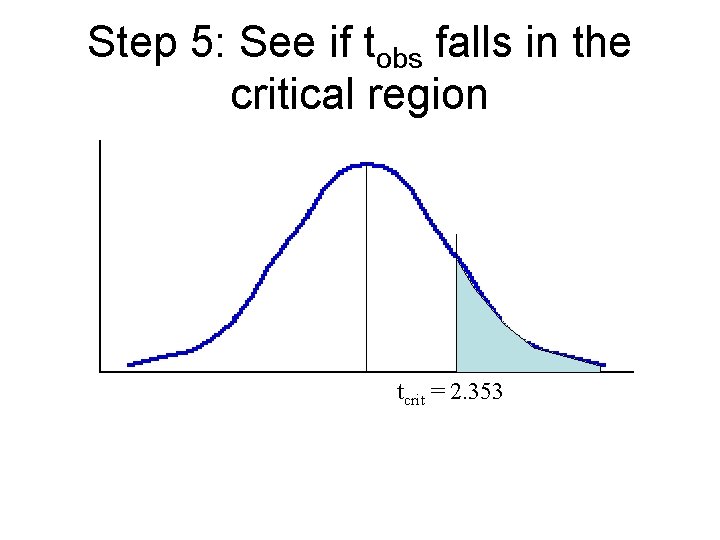
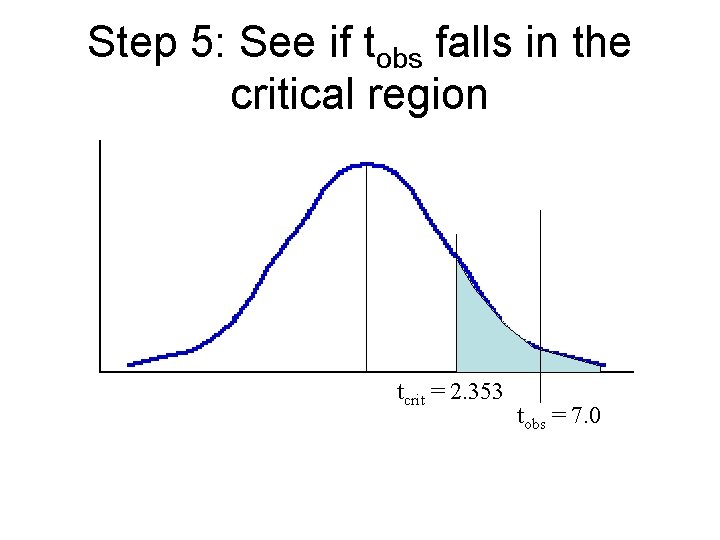
Step 2: Calculate the Critical t • N = Number of pairs • df = N - 1 • 4 -1=3 • =. 05 • t critical = 2. 353
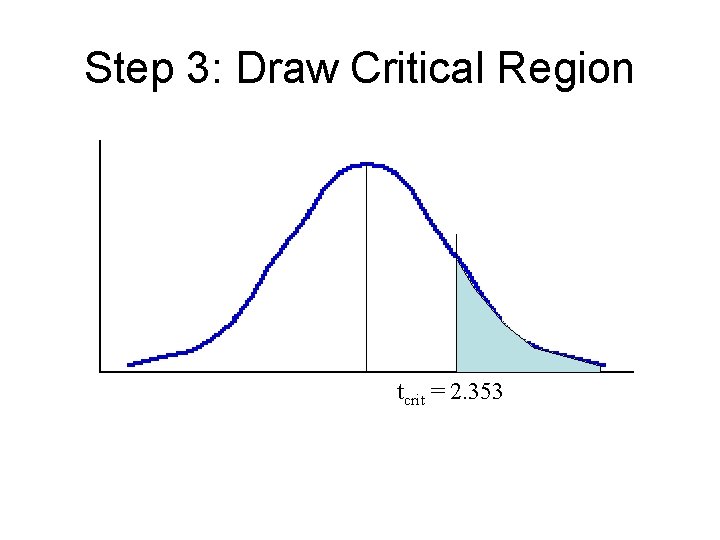
Step 3: Draw Critical Region tcrit = 2. 353
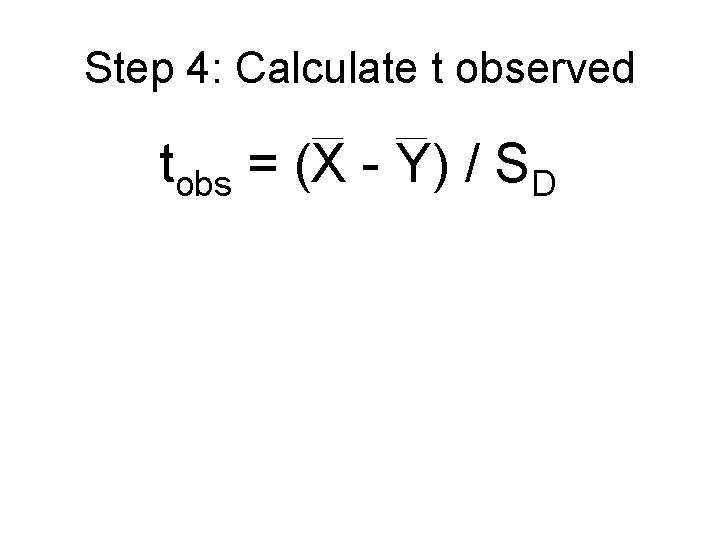
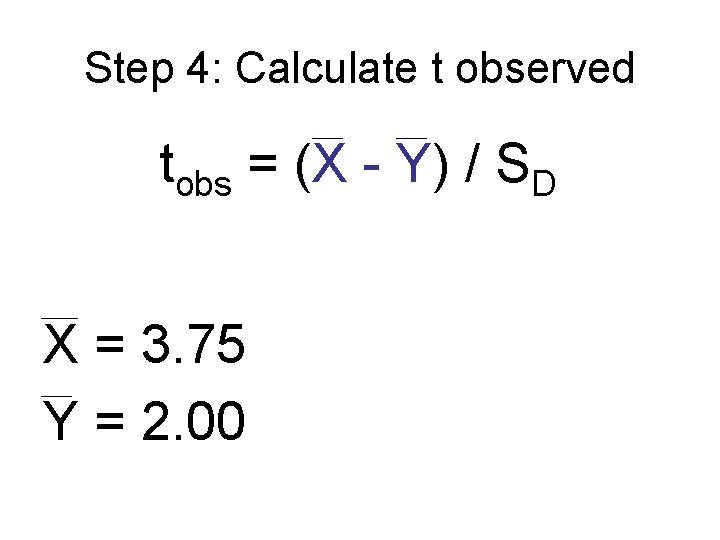
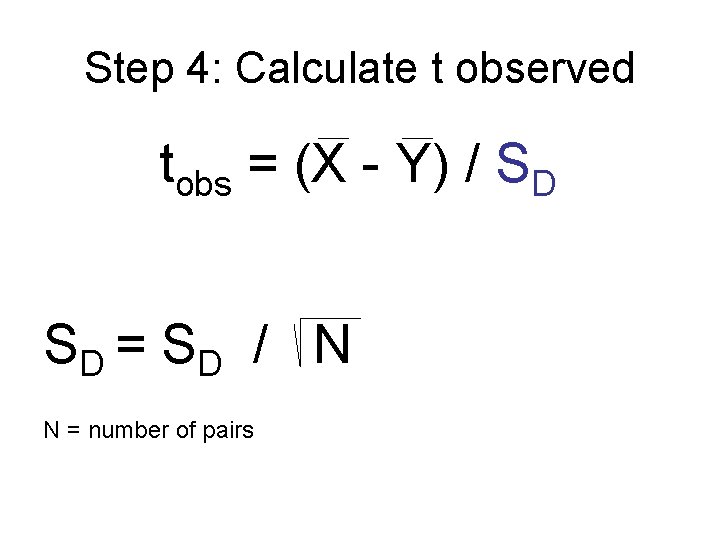
Step 4: Calculate t observed tobs = (X - Y) / SD
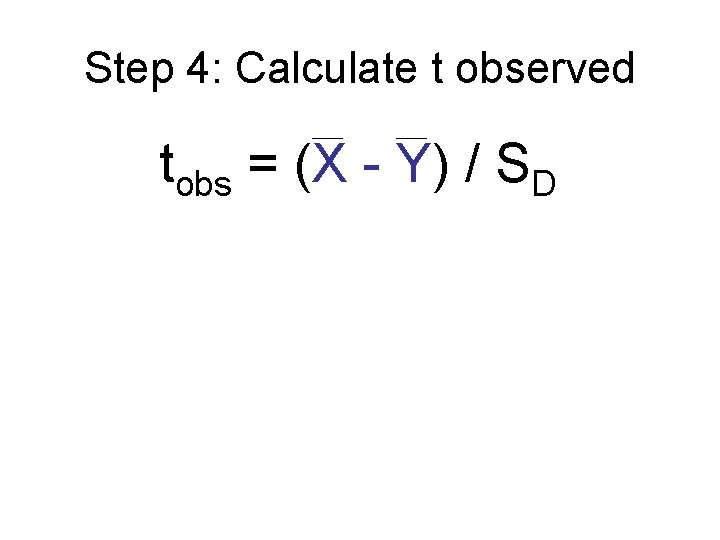
Step 4: Calculate t observed tobs = (X - Y) / SD
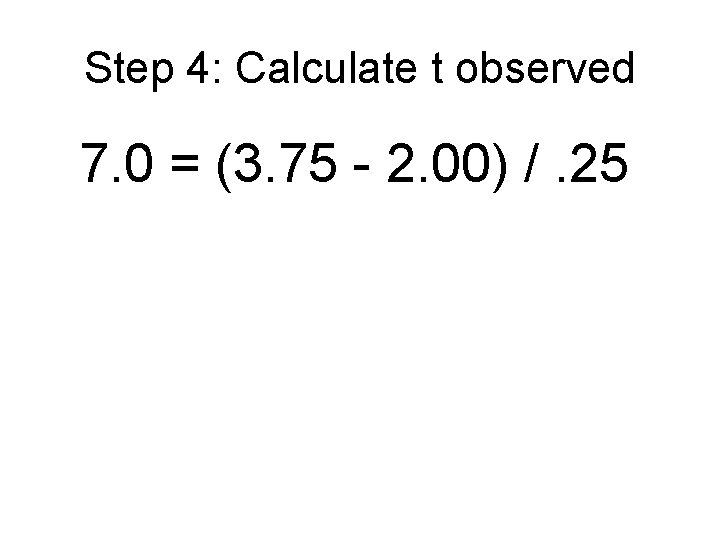
Step 4: Calculate t observed tobs = (X - Y) / SD X = 3. 75 Y = 2. 00
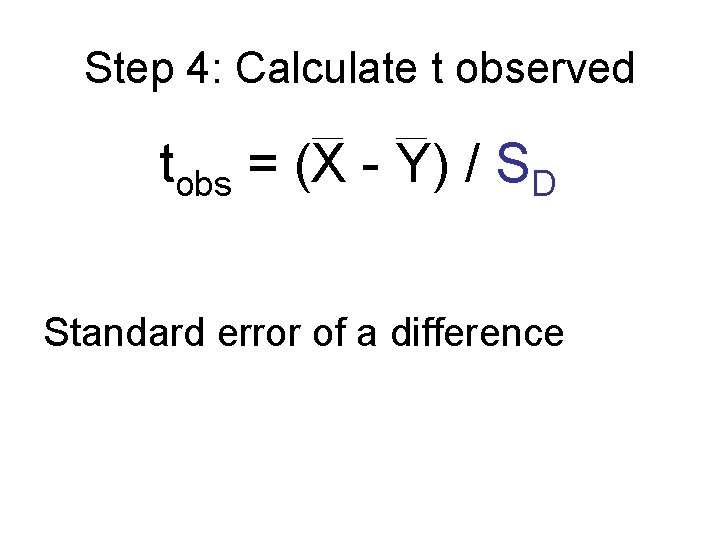
Step 4: Calculate t observed tobs = (X - Y) / SD Standard error of a difference
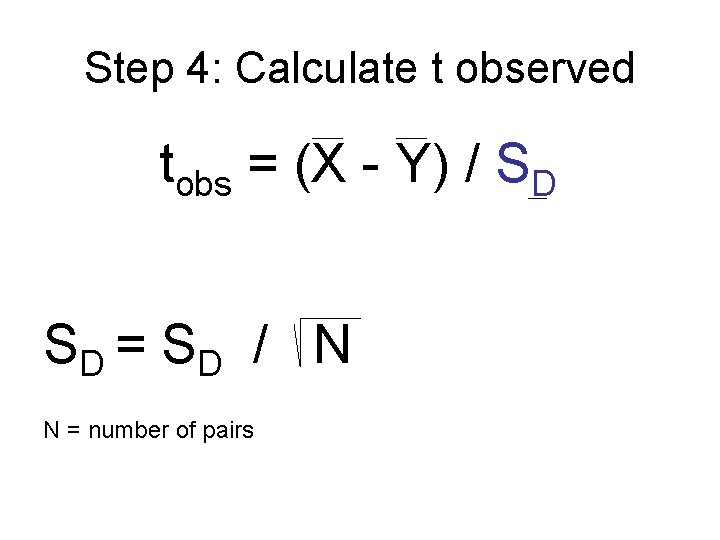
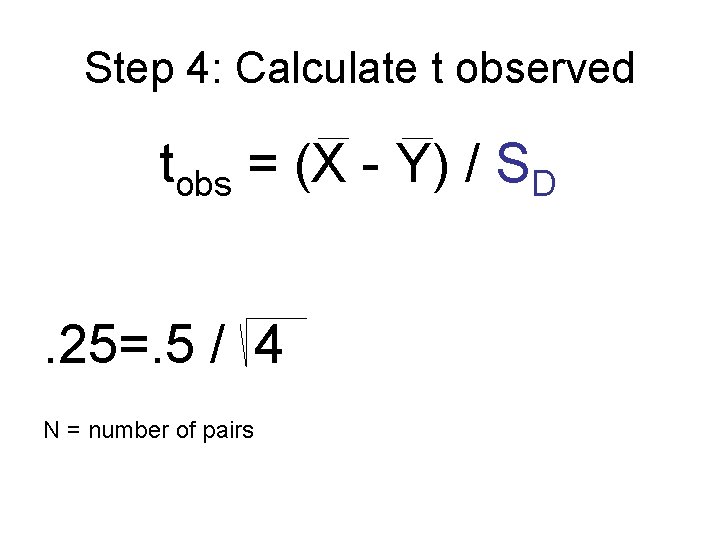
Step 4: Calculate t observed tobs = (X - Y) / SD SD = S D / N N = number of pairs
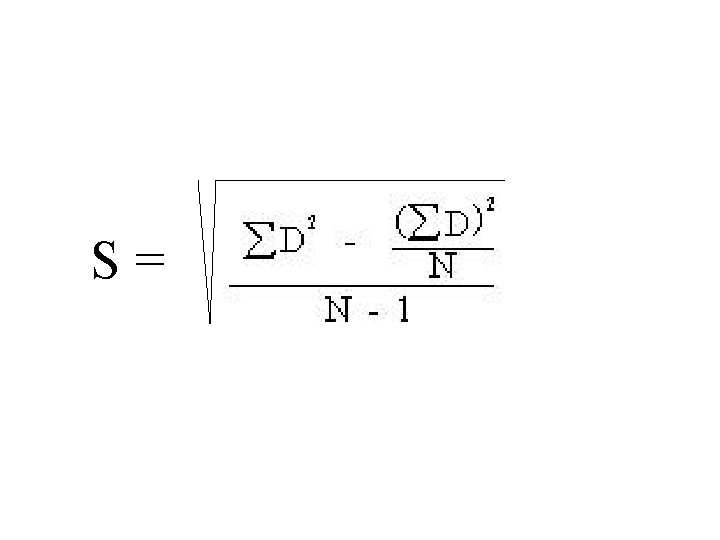
S=
Test 1 w/ Pill (X) Mel 3 Alice 5 Vera 4 Flo 3 S= Test 2 w/o Pill (Y) 1 3 2 2
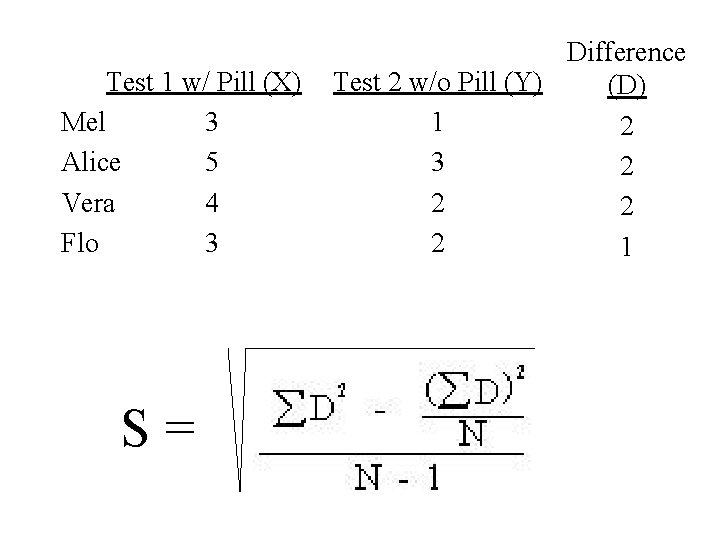
Test 1 w/ Pill (X) Mel 3 Alice 5 Vera 4 Flo 3 S= Difference Test 2 w/o Pill (Y) (D) 1 2 3 2 2 1
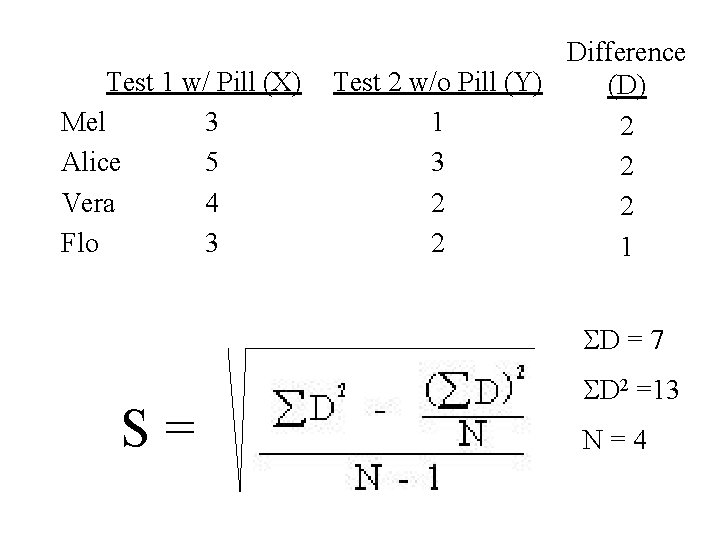
Test 1 w/ Pill (X) Mel 3 Alice 5 Vera 4 Flo 3 Difference Test 2 w/o Pill (Y) (D) 1 2 3 2 2 1 D = 7 S= D 2 =13 N=4
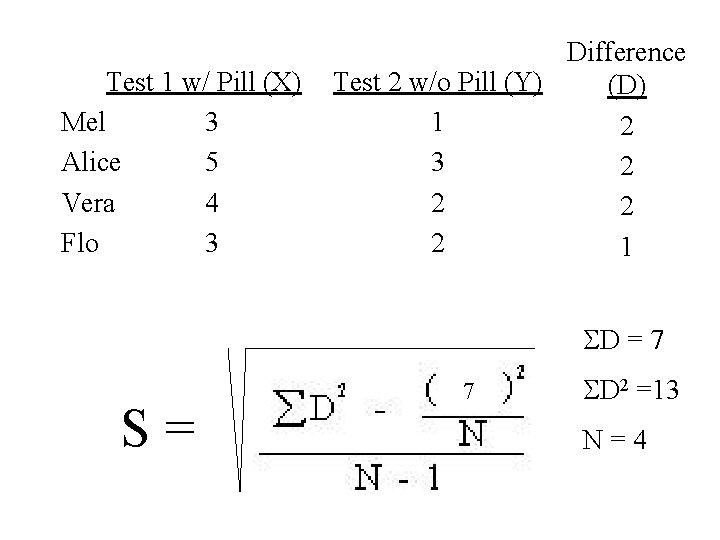
Test 1 w/ Pill (X) Mel 3 Alice 5 Vera 4 Flo 3 Difference Test 2 w/o Pill (Y) (D) 1 2 3 2 2 1 D = 7 S= 7 D 2 =13 N=4
Test 1 w/ Pill (X) Mel 3 Alice 5 Vera 4 Flo 3 Difference Test 2 w/o Pill (Y) (D) 1 2 3 2 2 1 D = 7 S= 13 7 D 2 =13 N=4
Test 1 w/ Pill (X) Mel 3 Alice 5 Vera 4 Flo 3 Difference Test 2 w/o Pill (Y) (D) 1 2 3 2 2 1 D = 7 S= 13 4 -1 7 D 2 =13 4 N=4
Test 1 w/ Pill (X) Mel 3 Alice 5 Vera 4 Flo 3 Difference Test 2 w/o Pill (Y) (D) 1 2 3 2 2 1 D = 7 S= 7 12. 25 4 13 3 D 2 =13 N=4
Test 1 w/ Pill (X) Mel 3 Alice 5 Vera 4 Flo 3 Difference Test 2 w/o Pill (Y) (D) 1 2 3 2 2 1 D = 7 . 5 = . 75 3 7 D 2 =13 4 N=4
Step 4: Calculate t observed tobs = (X - Y) / SD SD = S D / N N = number of pairs
Step 4: Calculate t observed tobs = (X - Y) / SD. 25=. 5 / 4 N = number of pairs
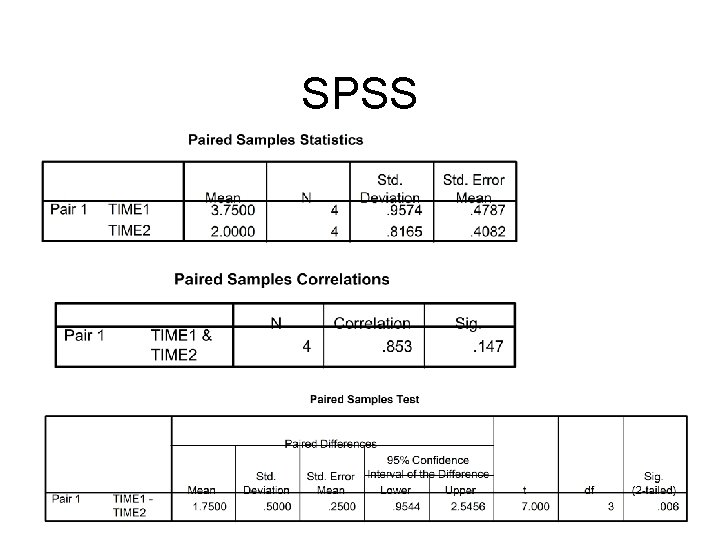
Step 4: Calculate t observed 7. 0 = (3. 75 - 2. 00) /. 25
Step 5: See if tobs falls in the critical region tcrit = 2. 353
Step 5: See if tobs falls in the critical region tcrit = 2. 353 tobs = 7. 0
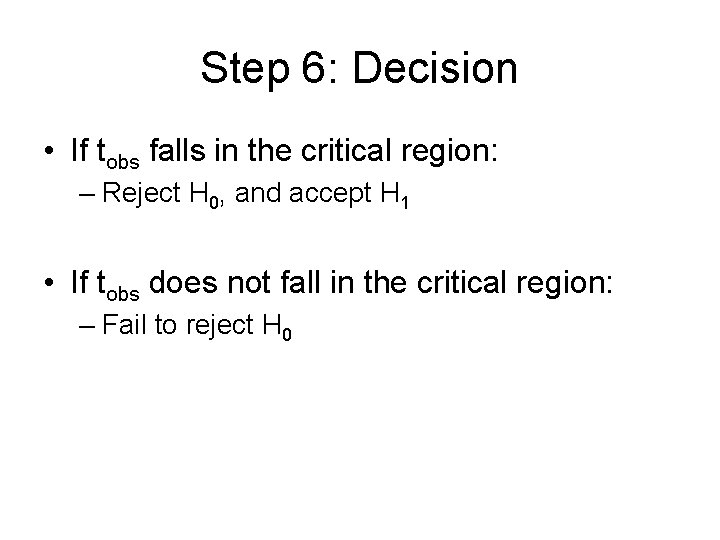
Step 6: Decision • If tobs falls in the critical region: – Reject H 0, and accept H 1 • If tobs does not fall in the critical region: – Fail to reject H 0
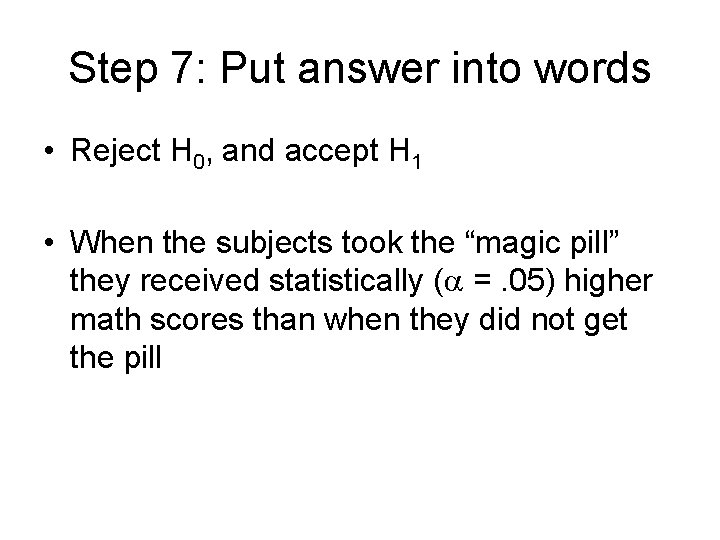
Step 7: Put answer into words • Reject H 0, and accept H 1 • When the subjects took the “magic pill” they received statistically ( =. 05) higher math scores than when they did not get the pill
SPSS
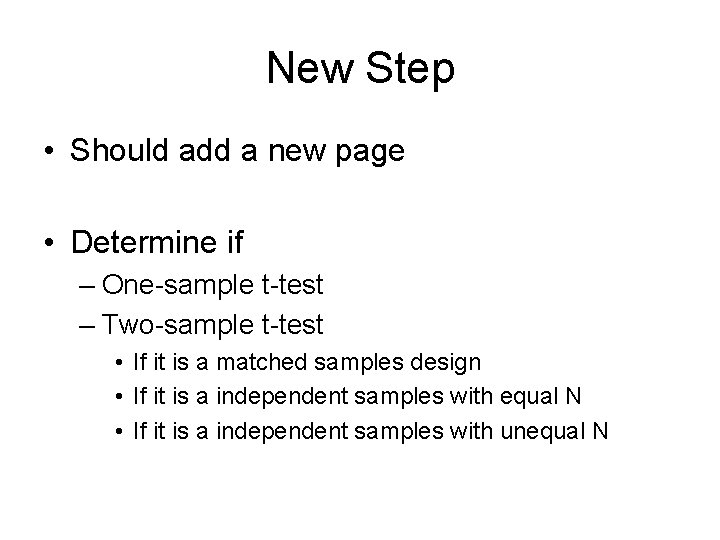
New Step • Should add a new page • Determine if – One-sample t-test – Two-sample t-test • If it is a matched samples design • If it is a independent samples with equal N • If it is a independent samples with unequal N
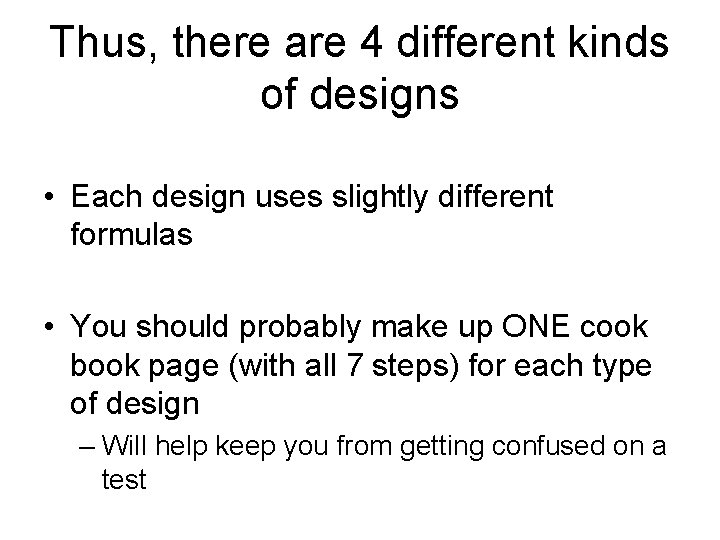
Thus, there are 4 different kinds of designs • Each design uses slightly different formulas • You should probably make up ONE cook book page (with all 7 steps) for each type of design – Will help keep you from getting confused on a test
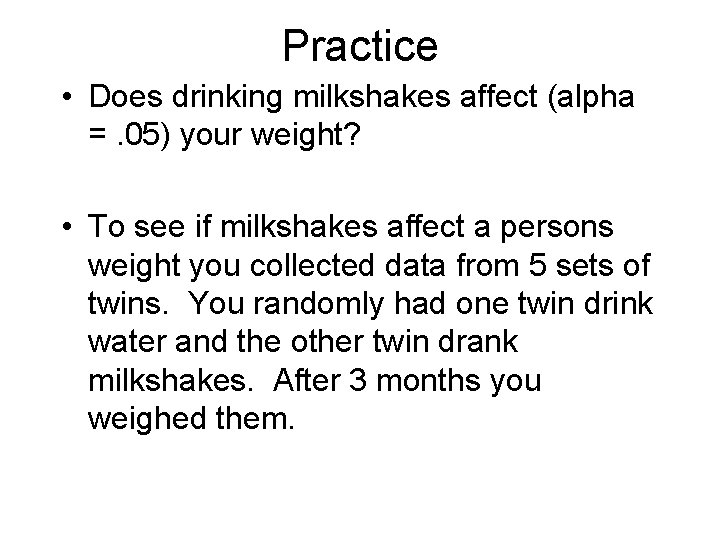
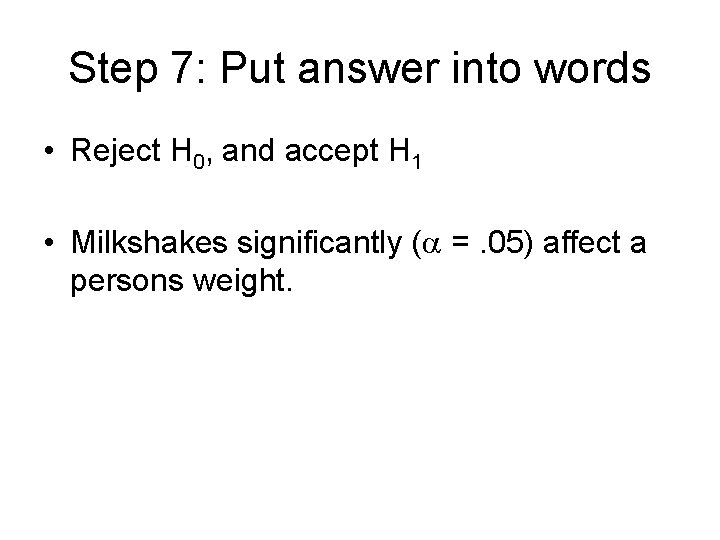
Practice • Does drinking milkshakes affect (alpha =. 05) your weight? • To see if milkshakes affect a persons weight you collected data from 5 sets of twins. You randomly had one twin drink water and the other twin drank milkshakes. After 3 months you weighed them.
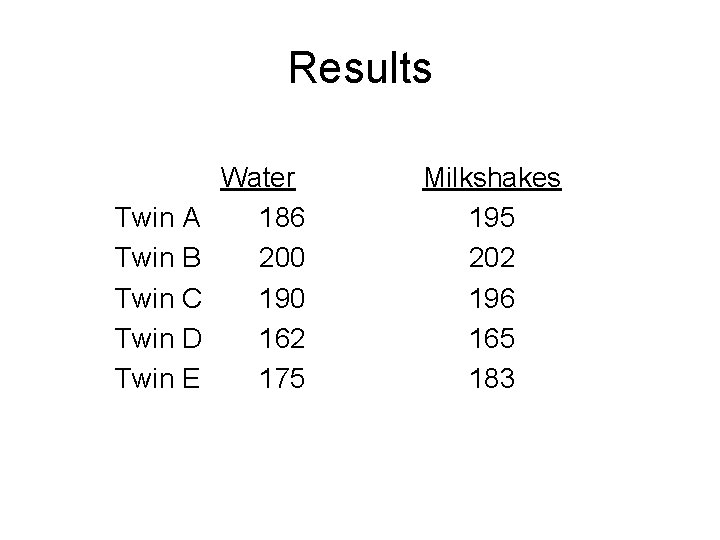
Results Twin A Twin B Twin C Twin D Twin E Water 186 200 190 162 175 Milkshakes 195 202 196 165 183
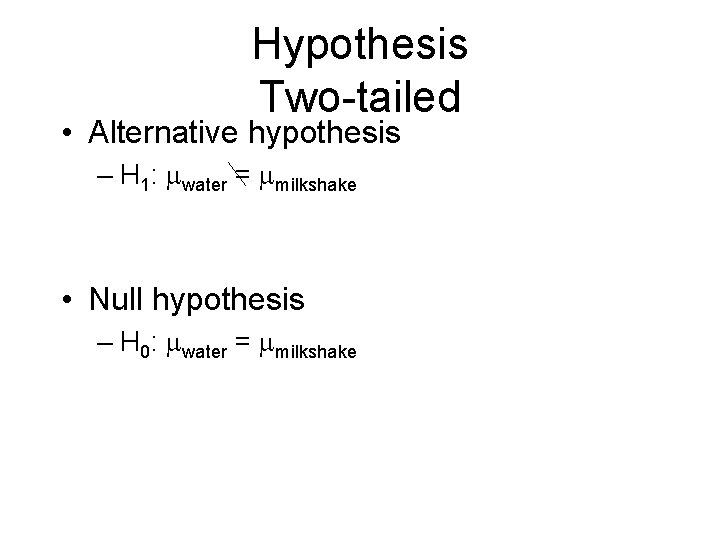
Hypothesis Two-tailed • Alternative hypothesis – H 1: water = milkshake • Null hypothesis – H 0: water = milkshake
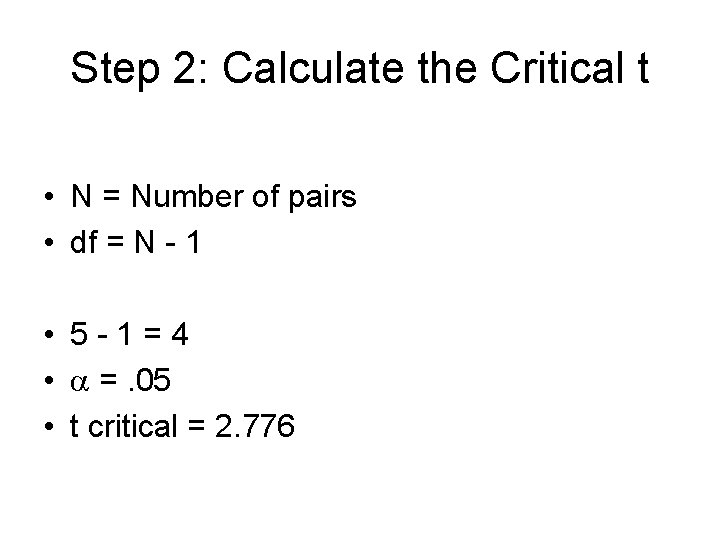
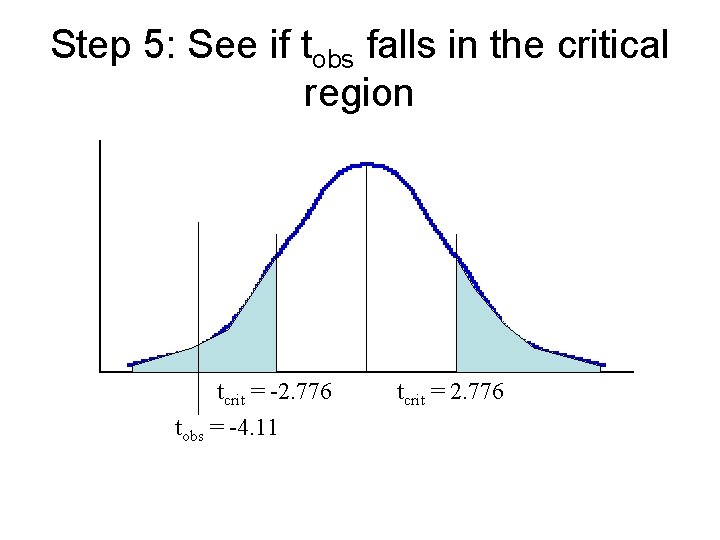
Step 2: Calculate the Critical t • N = Number of pairs • df = N - 1 • 5 -1=4 • =. 05 • t critical = 2. 776
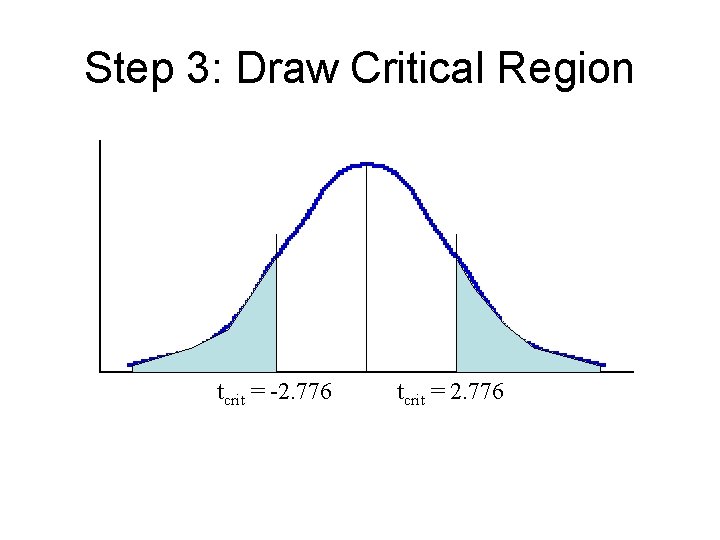
Step 3: Draw Critical Region tcrit = -2. 776 tcrit = 2. 776
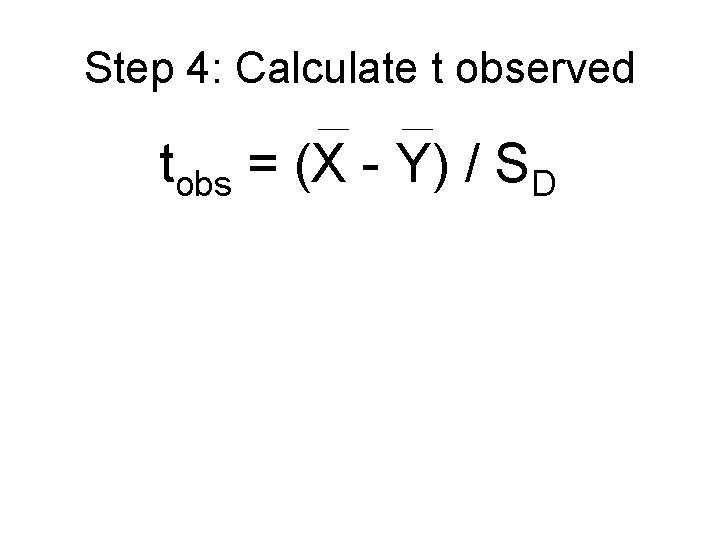
Step 4: Calculate t observed tobs = (X - Y) / SD
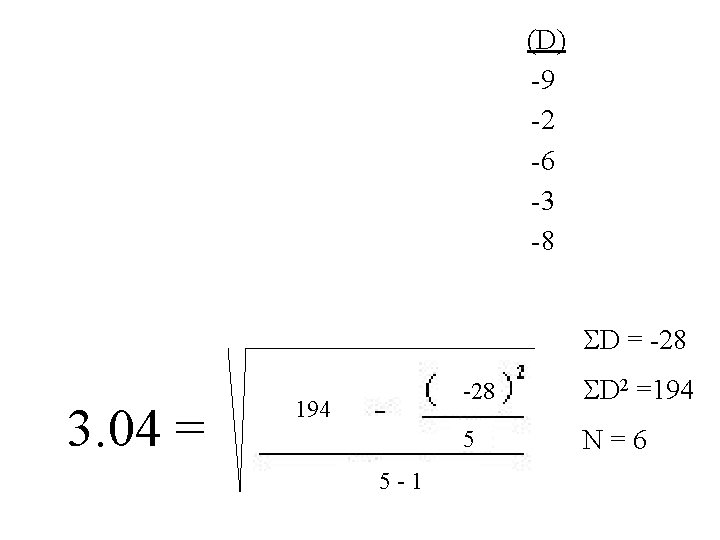
(D) -9 -2 -6 -3 -8 D = -28 3. 04 = 194 5 -1 -28 D 2 =194 5 N=6
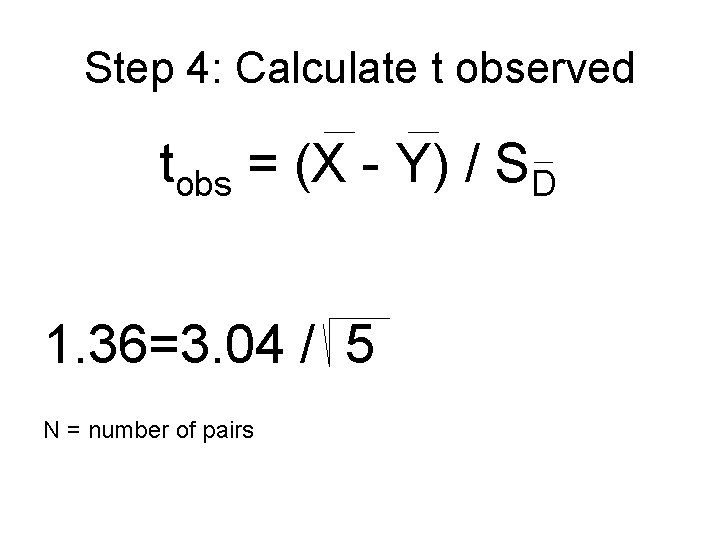
Step 4: Calculate t observed tobs = (X - Y) / SD 1. 36=3. 04 / 5 N = number of pairs
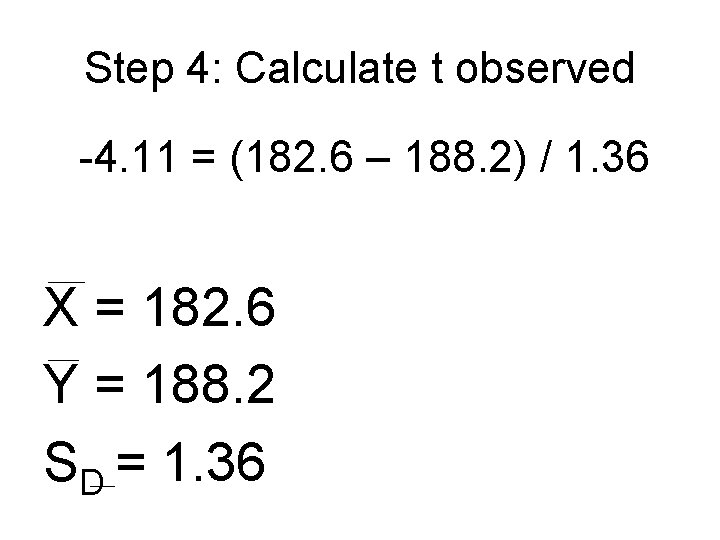
Step 4: Calculate t observed -4. 11 = (182. 6 – 188. 2) / 1. 36 X = 182. 6 Y = 188. 2 SD = 1. 36
Step 5: See if tobs falls in the critical region tcrit = -2. 776 tobs = -4. 11 tcrit = 2. 776
Step 6: Decision • If tobs falls in the critical region: – Reject H 0, and accept H 1 • If tobs does not fall in the critical region: – Fail to reject H 0
Step 7: Put answer into words • Reject H 0, and accept H 1 • Milkshakes significantly ( =. 05) affect a persons weight.
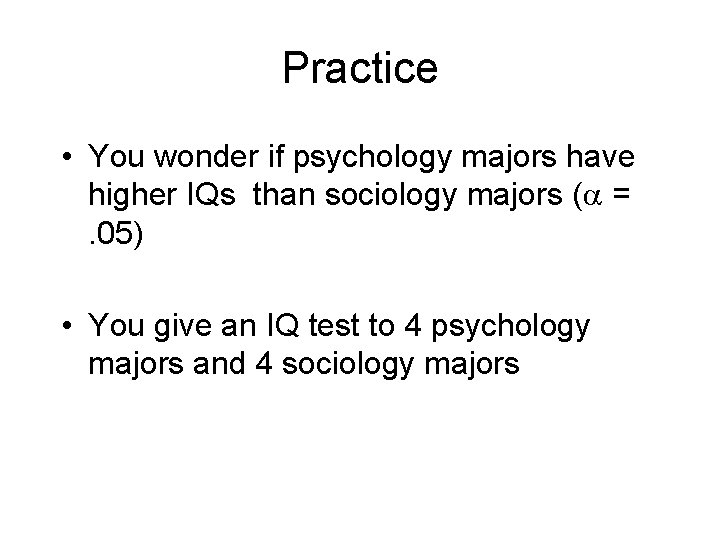
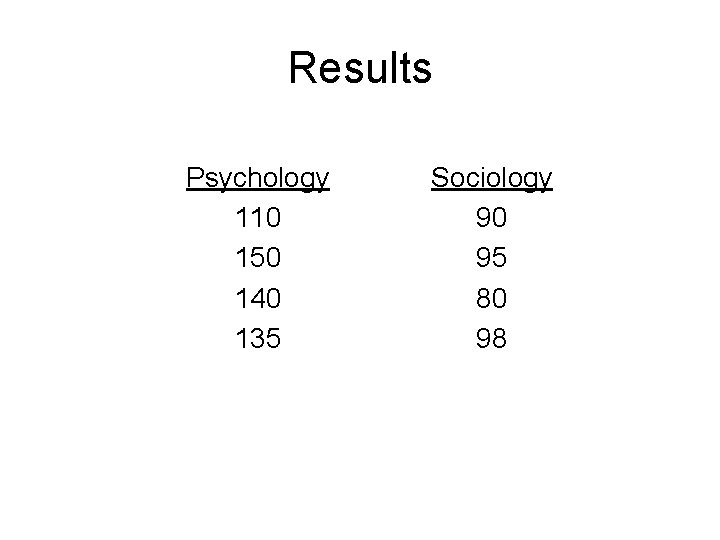
Practice • You wonder if psychology majors have higher IQs than sociology majors ( =. 05) • You give an IQ test to 4 psychology majors and 4 sociology majors
Results Psychology 110 150 140 135 Sociology 90 95 80 98
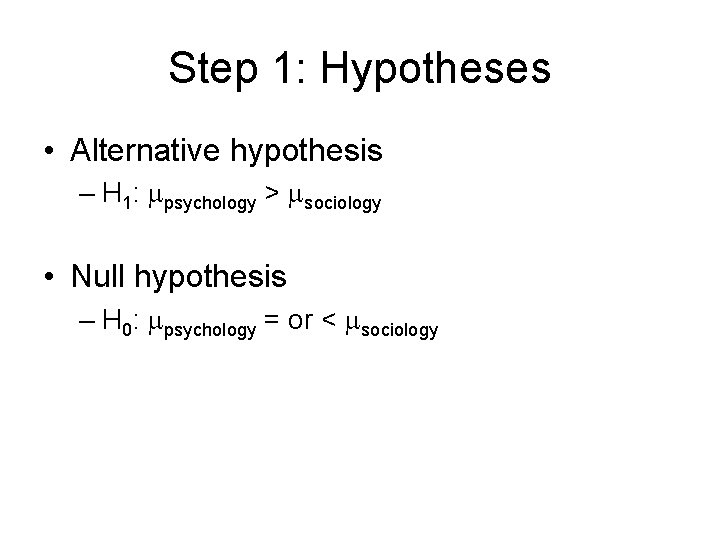
Step 1: Hypotheses • Alternative hypothesis – H 1: psychology > sociology • Null hypothesis – H 0: psychology = or < sociology
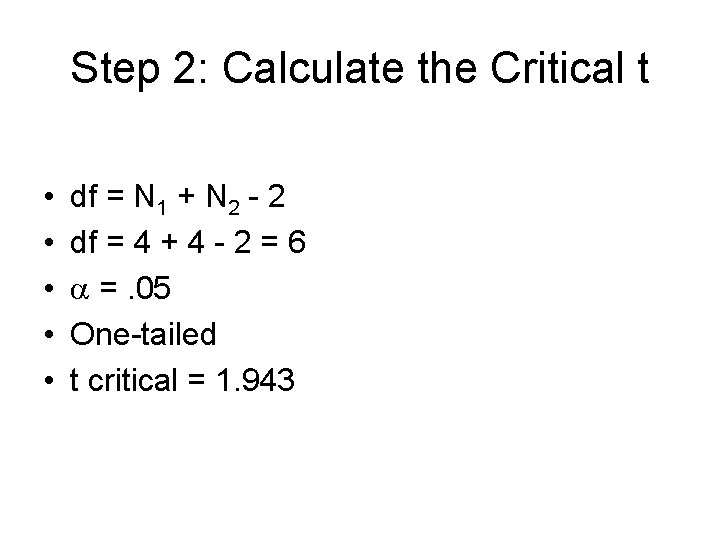
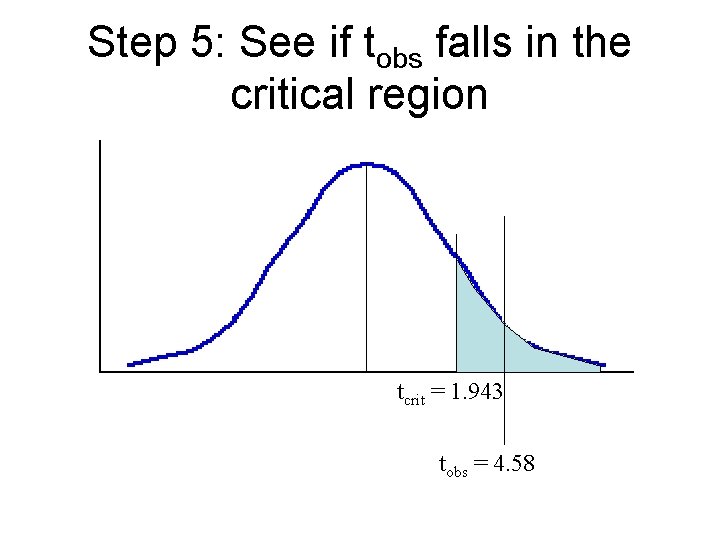
Step 2: Calculate the Critical t • • • df = N 1 + N 2 - 2 df = 4 + 4 - 2 = 6 =. 05 One-tailed t critical = 1. 943
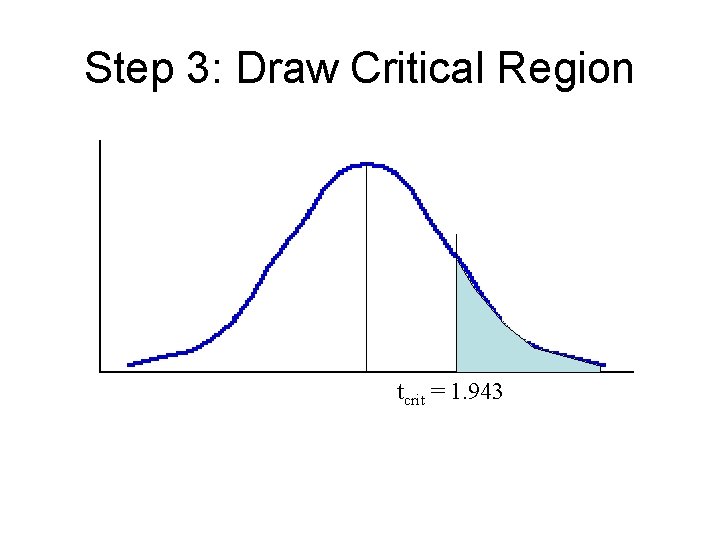
Step 3: Draw Critical Region tcrit = 1. 943
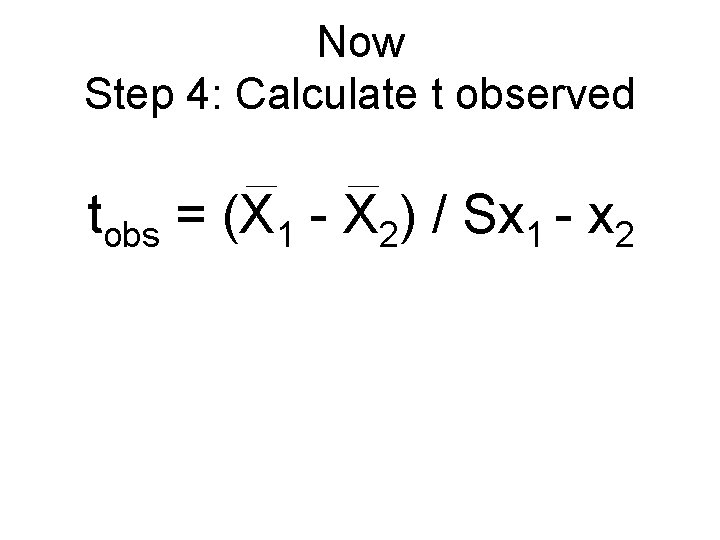
Now Step 4: Calculate t observed tobs = (X 1 - X 2) / Sx 1 - x 2
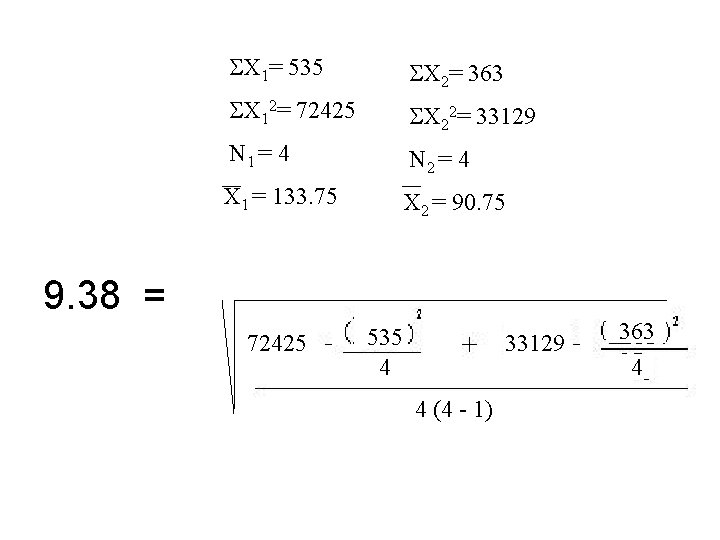
X 1= 535 X 2= 363 X 12= 72425 X 22= 33129 N 1 = 4 N 2 = 4 X 1 = 133. 75 X 2 = 90. 75 9. 38 = 72425 535 4 33129 4 (4 - 1) 363 4
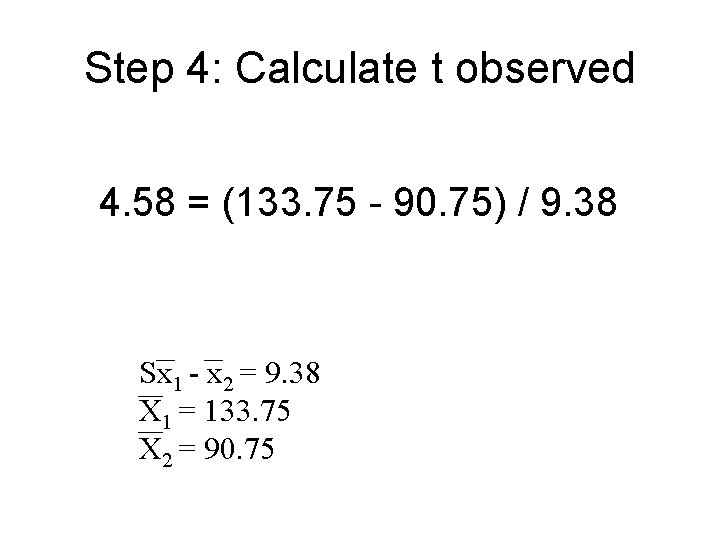
Step 4: Calculate t observed 4. 58 = (133. 75 - 90. 75) / 9. 38 Sx 1 - x 2 = 9. 38 X 1 = 133. 75 X 2 = 90. 75
Step 5: See if tobs falls in the critical region tcrit = 1. 943 tobs = 4. 58
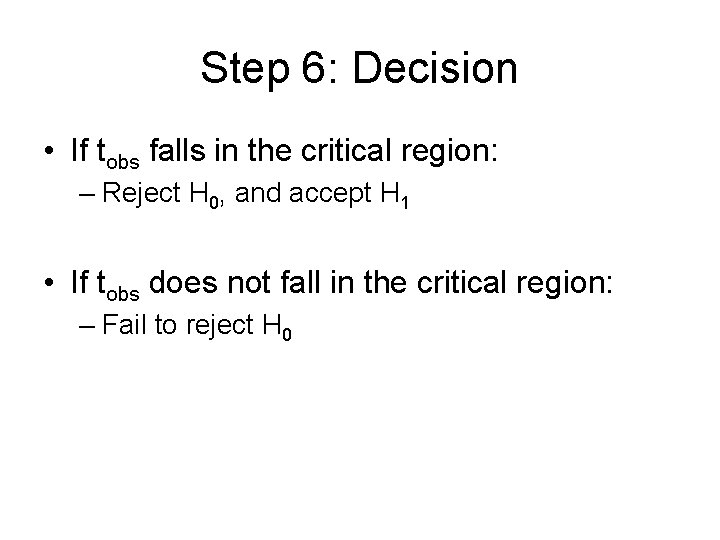
Step 6: Decision • If tobs falls in the critical region: – Reject H 0, and accept H 1 • If tobs does not fall in the critical region: – Fail to reject H 0
Step 7: Put answer into words • We Reject H 0, and accept H 1 • Psychology majors have significantly ( =. 05) higher IQs than sociology majors.
Practice • I think it is colder in Philadelphia than in Anaheim ( =. 10). • To test this, I got temperatures from these two places on the Internet.
Results Philadelphia 52 53 54 61 55 Anaheim 77 75 67
Hypotheses • Alternative hypothesis – H 1: Philadelphia < Anaheim • Null hypothesis – H 0: Philadelphia = or > Anaheim
Step 2: Calculate the Critical t • • • df = N 1 + N 2 - 2 df = 5 + 3 - 2 = 6 =. 10 One-tailed t critical = - 1. 44
Step 3: Draw Critical Region tcrit = -1. 44
Now Step 4: Calculate t observed tobs = (X 1 - X 2) / Sx 1 - x 2
15175 X 1= 275 X 2= 219 X 12= 15175 X 22= 16043 N 1 = 5 N 2 = 3 X 1 = 55 X 2 = 73 275 15125 5 16043 6 = 3. 05 219 15987 3 . 2 +. 33 5 3
Step 4: Calculate t observed -5. 90 = (55 - 73) / 3. 05 Sx 1 - x 2 = 3. 05 X 1 = 55 X 2 = 73
Step 5: See if tobs falls in the critical region tcrit = -1. 44 tobs = -5. 90
Step 6: Decision • If tobs falls in the critical region: – Reject H 0, and accept H 1 • If tobs does not fall in the critical region: – Fail to reject H 0
Step 7: Put answer into words • We Reject H 0, and accept H 1 • Philadelphia is significantly ( =. 10) colder than Anaheim.
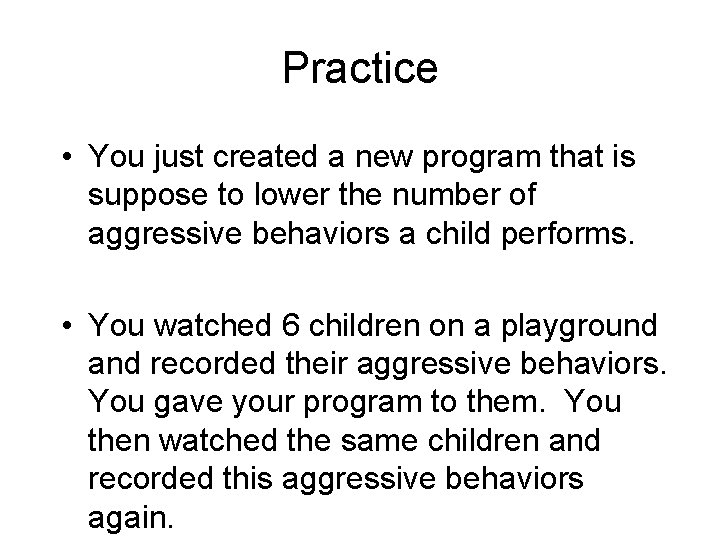
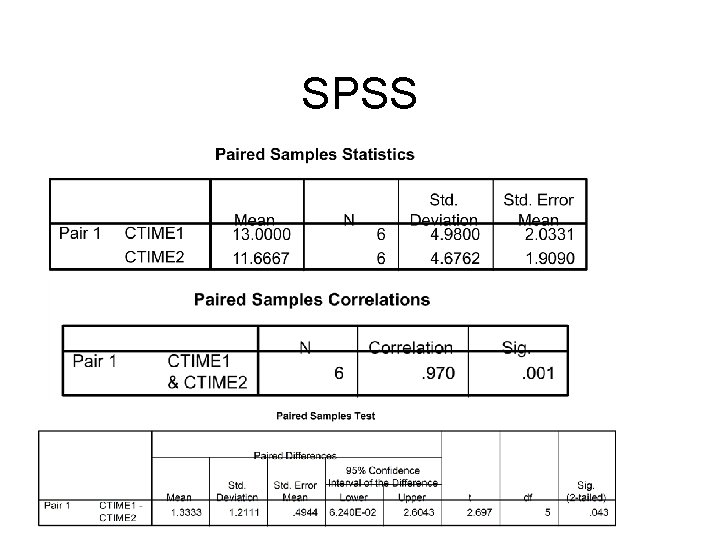
Practice • You just created a new program that is suppose to lower the number of aggressive behaviors a child performs. • You watched 6 children on a playground and recorded their aggressive behaviors. You gave your program to them. You then watched the same children and recorded this aggressive behaviors again.
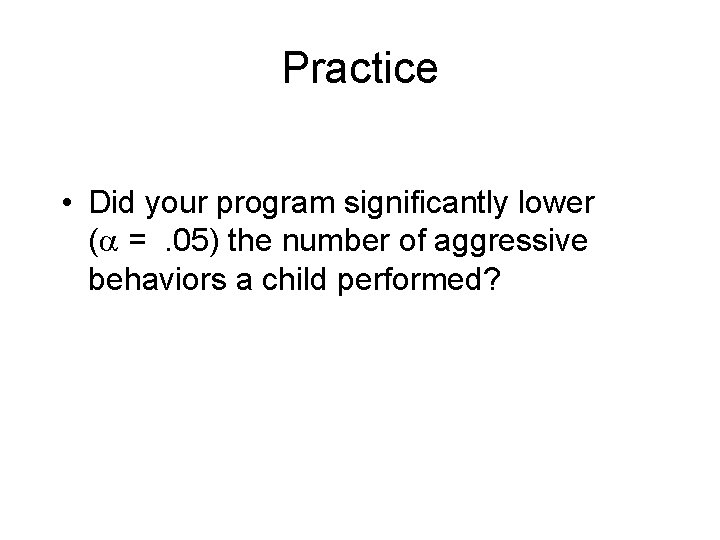
Practice • Did your program significantly lower ( =. 05) the number of aggressive behaviors a child performed?
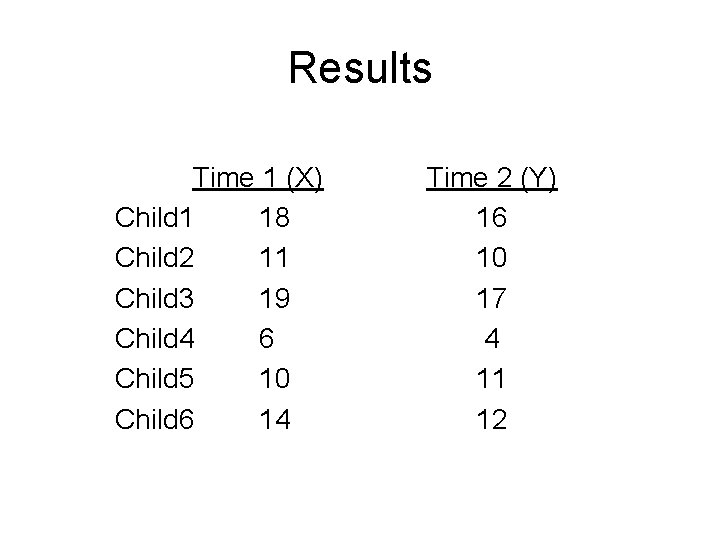
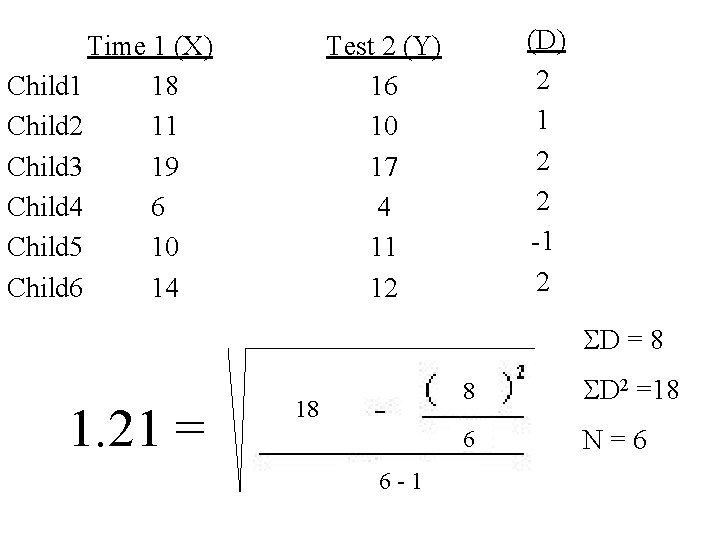
Results Time 1 (X) Child 1 18 Child 2 11 Child 3 19 Child 4 6 Child 5 10 Child 6 14 Time 2 (Y) 16 10 17 4 11 12
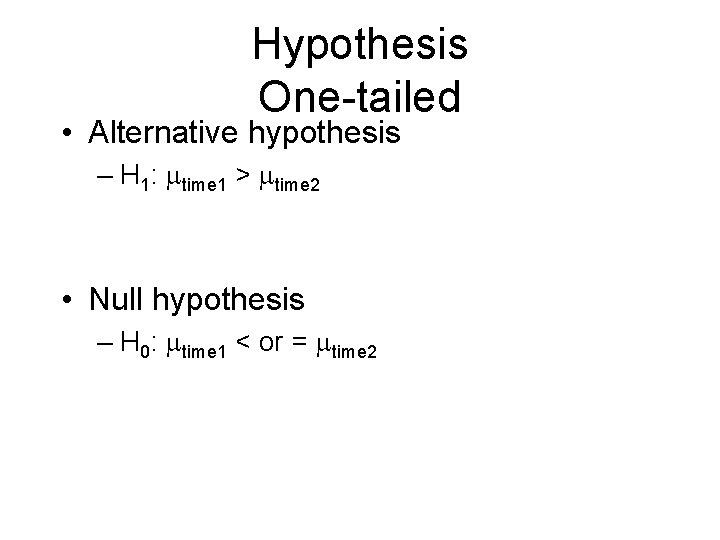
Hypothesis One-tailed • Alternative hypothesis – H 1: time 1 > time 2 • Null hypothesis – H 0: time 1 < or = time 2
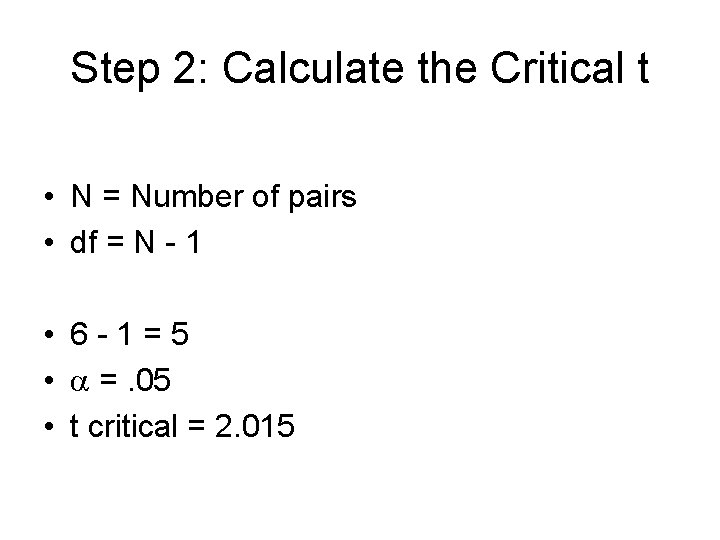
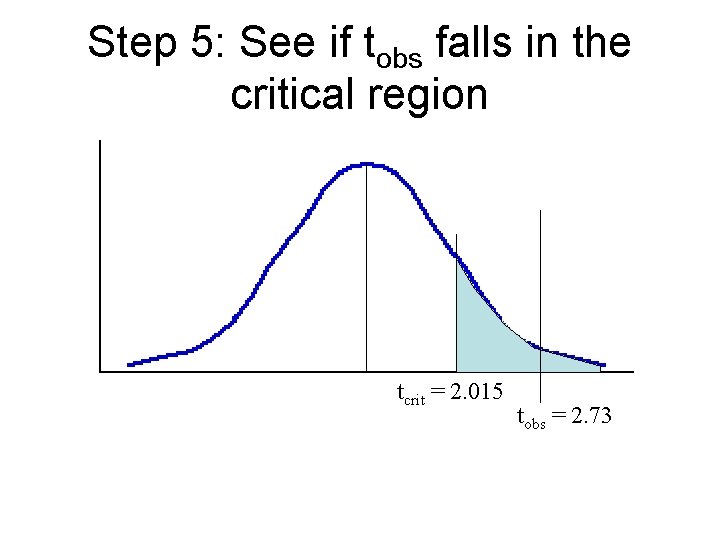
Step 2: Calculate the Critical t • N = Number of pairs • df = N - 1 • 6 -1=5 • =. 05 • t critical = 2. 015
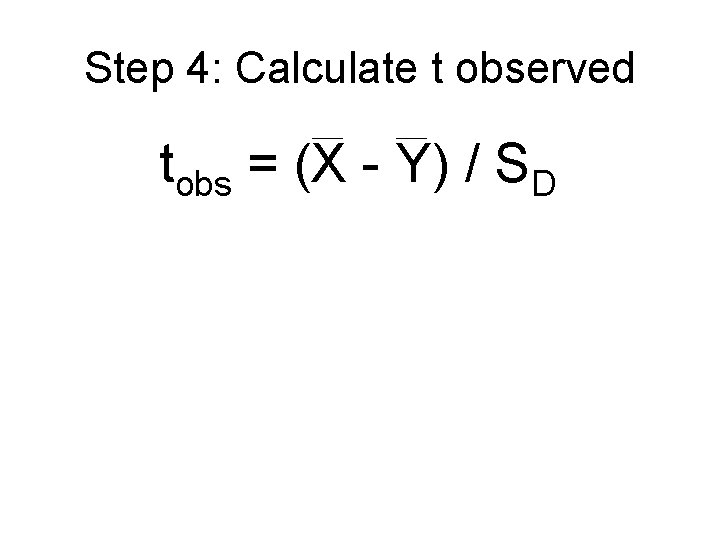
Step 4: Calculate t observed tobs = (X - Y) / SD
Time 1 (X) Child 1 18 Child 2 11 Child 3 19 Child 4 6 Child 5 10 Child 6 14 (D) 2 1 2 2 -1 2 Test 2 (Y) 16 10 17 4 11 12 D = 8 1. 21 = 18 6 -1 8 D 2 =18 6 N=6
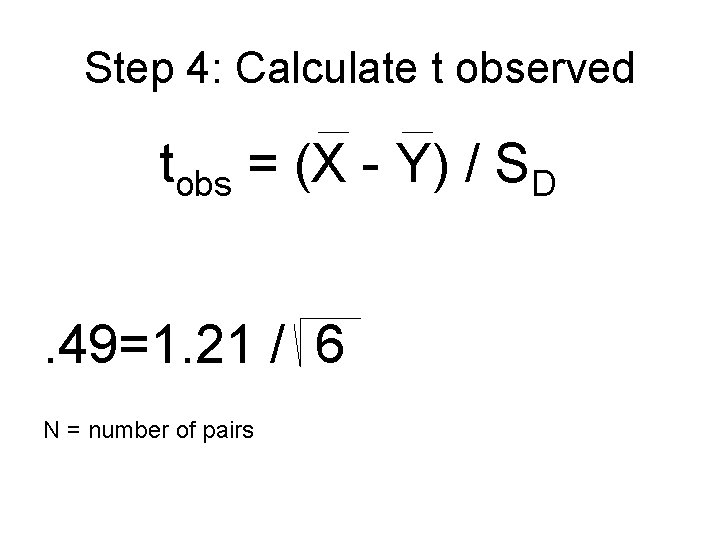
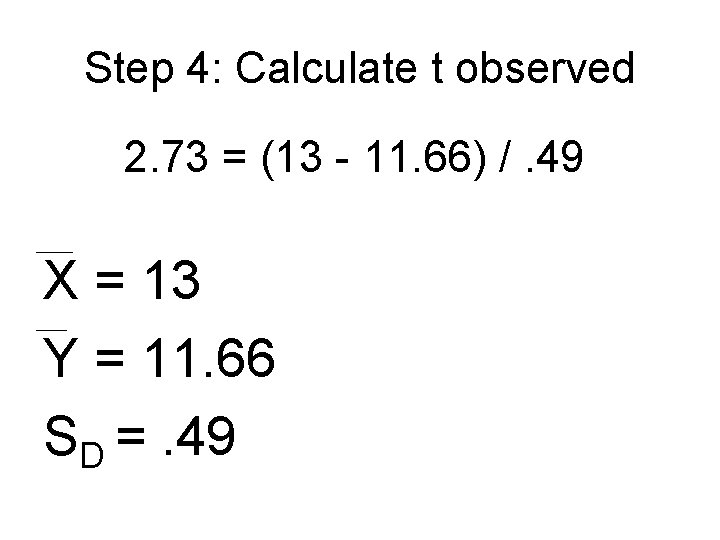
Step 4: Calculate t observed tobs = (X - Y) / SD. 49=1. 21 / 6 N = number of pairs
Step 4: Calculate t observed 2. 73 = (13 - 11. 66) /. 49 X = 13 Y = 11. 66 SD =. 49
Step 5: See if tobs falls in the critical region tcrit = 2. 015 tobs = 2. 73
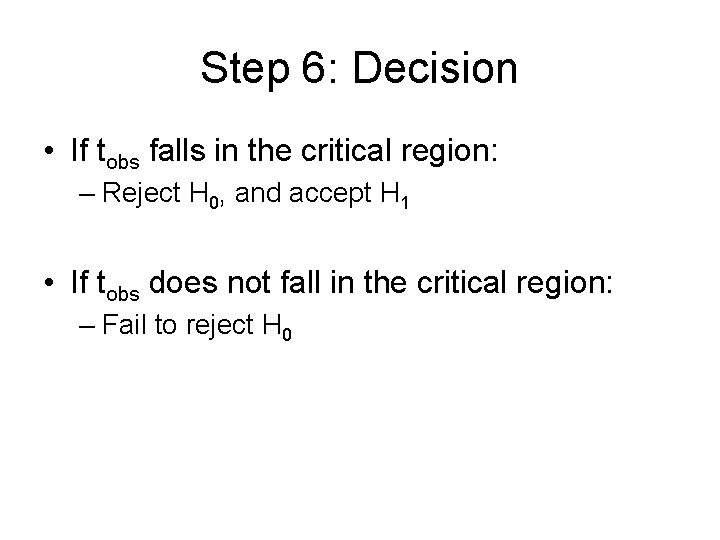
Step 6: Decision • If tobs falls in the critical region: – Reject H 0, and accept H 1 • If tobs does not fall in the critical region: – Fail to reject H 0
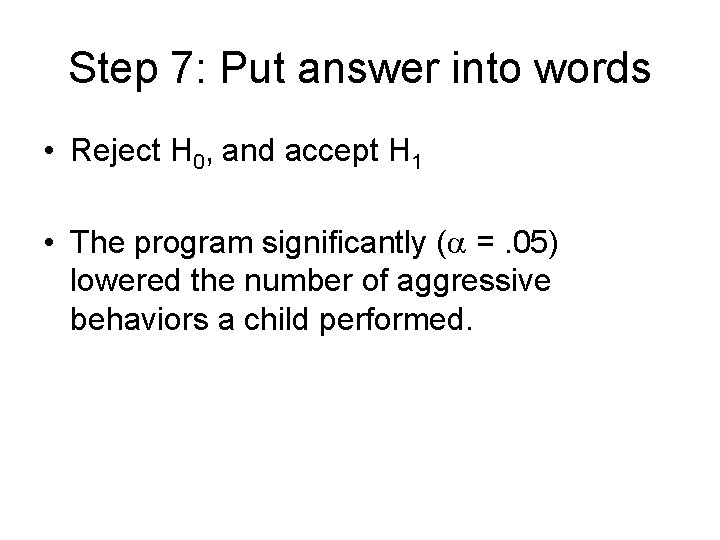
Step 7: Put answer into words • Reject H 0, and accept H 1 • The program significantly ( =. 05) lowered the number of aggressive behaviors a child performed.
SPSS
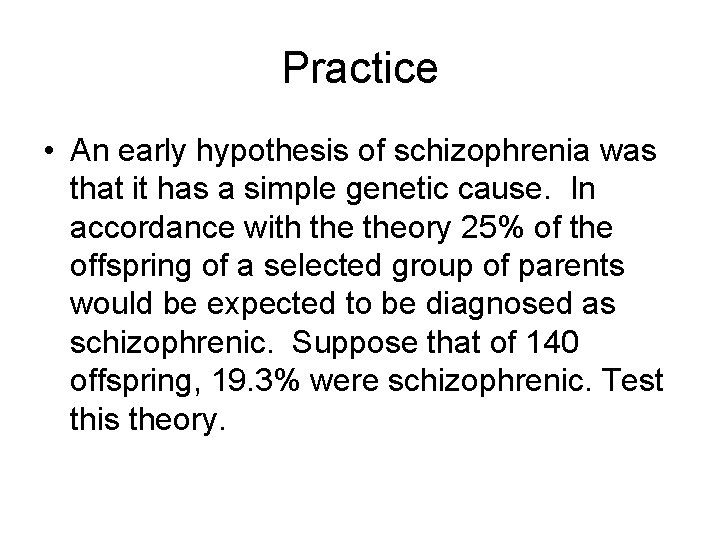
Practice • An early hypothesis of schizophrenia was that it has a simple genetic cause. In accordance with theory 25% of the offspring of a selected group of parents would be expected to be diagnosed as schizophrenic. Suppose that of 140 offspring, 19. 3% were schizophrenic. Test this theory.
• Goodness of fit chi-square • Make sure you compute the Chi square with the frequencies. • Chi square observed = 2. 439 • Critical = 3. 84 • These data are consistent with theory!
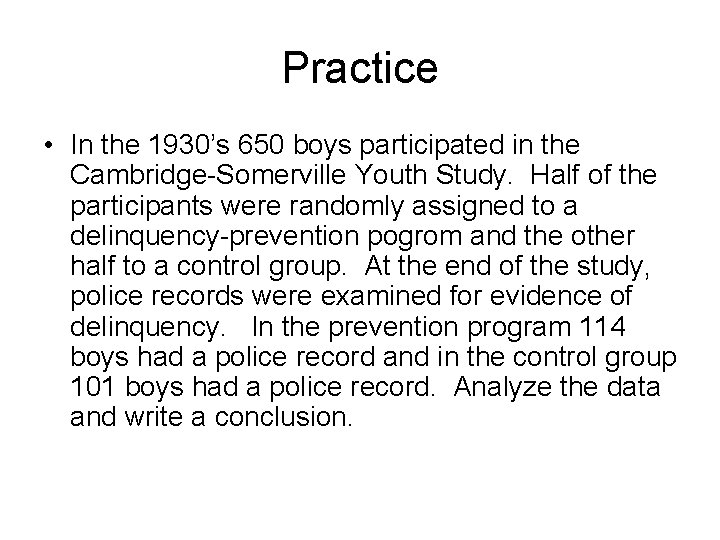
Practice • In the 1930’s 650 boys participated in the Cambridge-Somerville Youth Study. Half of the participants were randomly assigned to a delinquency-prevention pogrom and the other half to a control group. At the end of the study, police records were examined for evidence of delinquency. In the prevention program 114 boys had a police record and in the control group 101 boys had a police record. Analyze the data and write a conclusion.
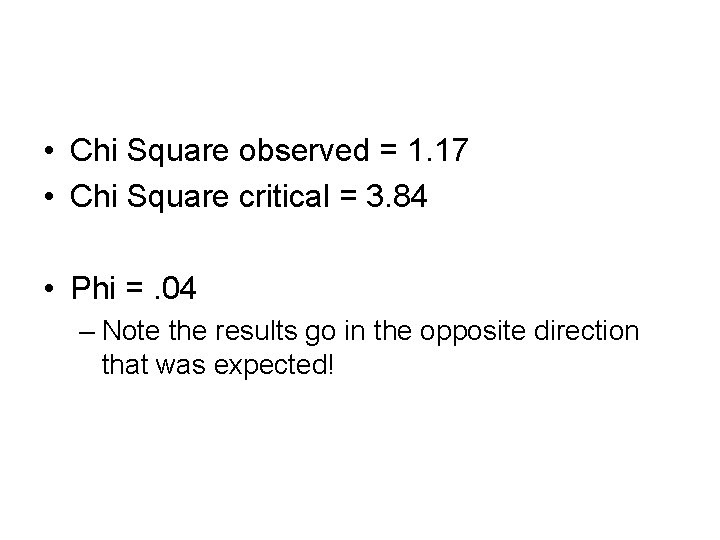
• Chi Square observed = 1. 17 • Chi Square critical = 3. 84 • Phi =. 04 – Note the results go in the opposite direction that was expected!
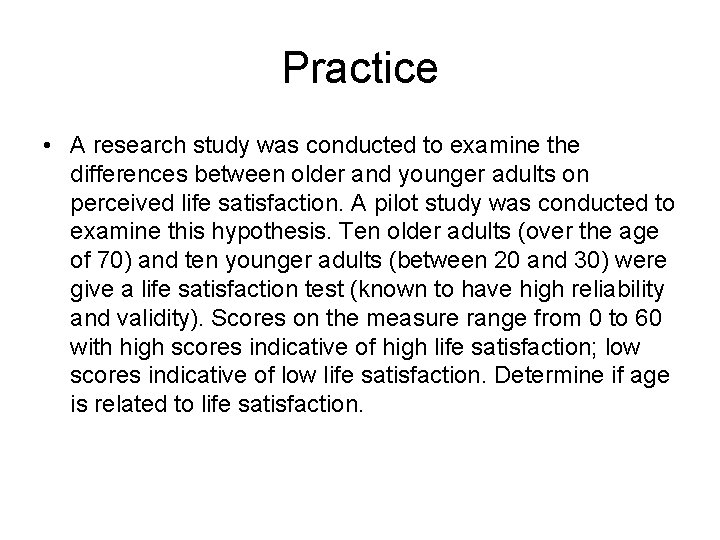
Practice • A research study was conducted to examine the differences between older and younger adults on perceived life satisfaction. A pilot study was conducted to examine this hypothesis. Ten older adults (over the age of 70) and ten younger adults (between 20 and 30) were give a life satisfaction test (known to have high reliability and validity). Scores on the measure range from 0 to 60 with high scores indicative of high life satisfaction; low scores indicative of low life satisfaction. Determine if age is related to life satisfaction.
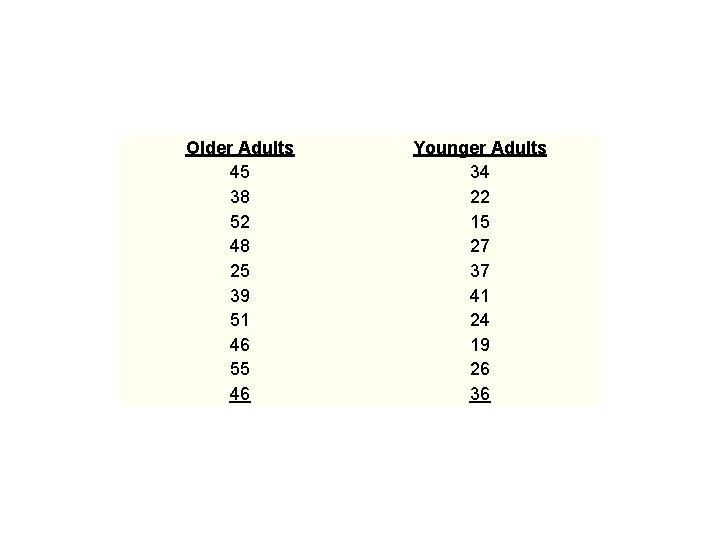
Older Adults 45 38 52 48 25 39 51 46 55 46 Younger Adults 34 22 15 27 37 41 24 19 26 36
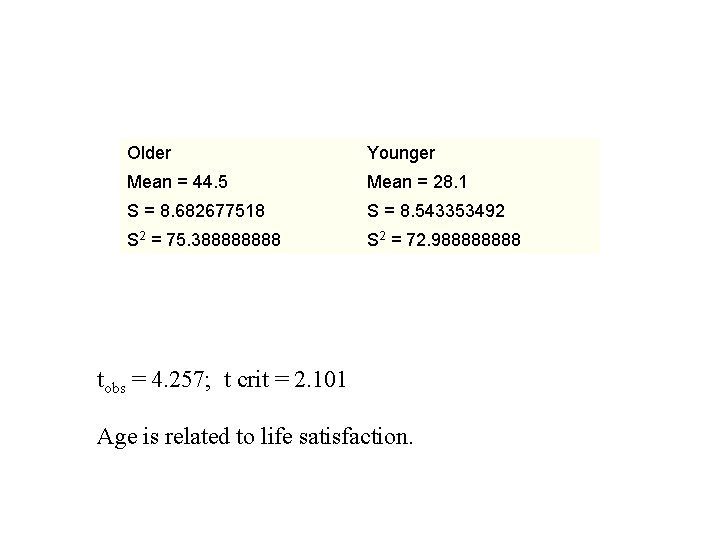
Older Younger Mean = 44. 5 Mean = 28. 1 S = 8. 682677518 S = 8. 543353492 S 2 = 75. 38888 S 2 = 72. 98888 tobs = 4. 257; t crit = 2. 101 Age is related to life satisfaction.
Practice • Sleep researchers decide to test the impact of REM sleep deprivation on a computerized assembly line task. Subjects are required to participate in two nights of testing. On each night of testing the subject is allowed a total of four hours of sleep. However, on one of the nights, the subject is awakened immediately upon achieving REM sleep. Subjects then took a cognitive test which assessed errors in judgment. Did sleep deprivation lower the subjects cognitive ability?
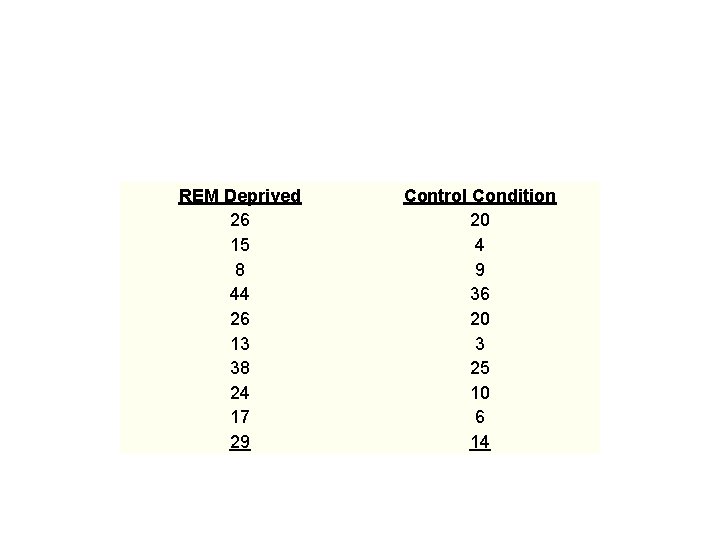
REM Deprived 26 15 8 44 26 13 38 24 17 29 Control Condition 20 4 9 36 20 3 25 10 6 14
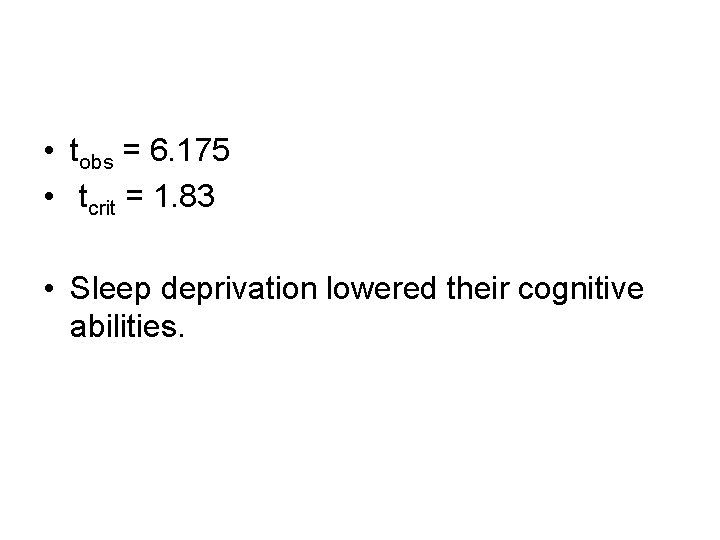
• tobs = 6. 175 • tcrit = 1. 83 • Sleep deprivation lowered their cognitive abilities.
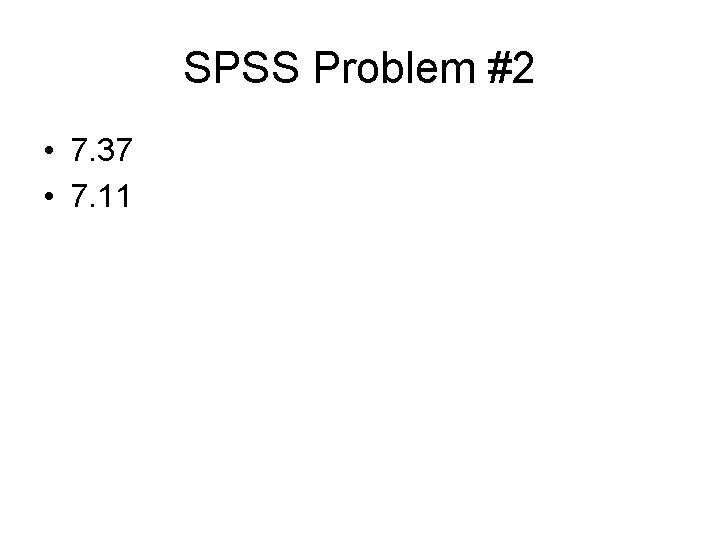
SPSS Problem #2 • 7. 37 • 7. 11