
PHILADELPHIA UNIVERSITY Faculty of Engineering Civil Engineering Department
- Slides: 35
PHILADELPHIA UNIVERSITY Faculty of Engineering Civil Engineering Department Course: “Engineering Statistics” CE 0670202 Instructor: Eng. Othman Aldmour 9/13/2021 Dr. Ala’a Alshdiefat 1
Engineering Statistics Chapter 1 § § § 9/13/2021 Introductions What is Statistics ? Types of Variables Levels of Measurement Ethics and Statistics Computer Application Dr. Ala’a Alshdiefat 2
Introduction One of the tools to make decision is statistics Statistics is used not only by business people We all also apply statistics concepts As a student of Engineering , you will need basic knowledge and skills to organize, analyze , transform data and to present the information , We will show you basic statistics techniques and methods that will develop your ability to make good personal business and engineering decisions. 9/13/2021 3
Why Study Statistics So why is statistics required by so many majors? 1 - To present different of data (numerical and non- numerical ) in a proper way 2 - To use a sample rather the whole population 3 - Statistical techniques are used to make decisions that affect our daily live. 4 - The knowledge of statistics methods will help you understand how decision are made and give you a better understanding of how they affect you 5 - To predict what will happen. 9/13/2021 4
What is Meant by Statistics ? Statistics : Is the science of collecting, organizing, presenting, analyzing, and interpreting data to assist in making more effective decisions. Population : The entire set of individuals or objects of interest or the measurements obtained from all individuals or objects of interests. (Human or otherwise) that being studied. Sample : A portion, or part of the population of interests. Raw Data : It is data that collected in original form, it is not statistics. (it is a list of information) 9/13/2021 5
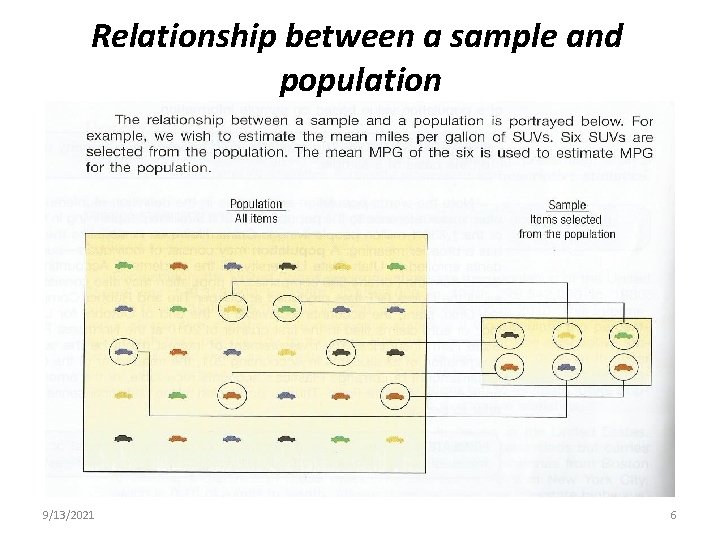
Relationship between a sample and population 9/13/2021 6
Ethics and Statistics American Statistician 57, no 1 (2003) Offers guidance To practice statistics you have to have integrity and honesty and “do the right thing” We need to maintain “independent and principled point – of- view Financial analysts, defects , harmful 9/13/2021 7
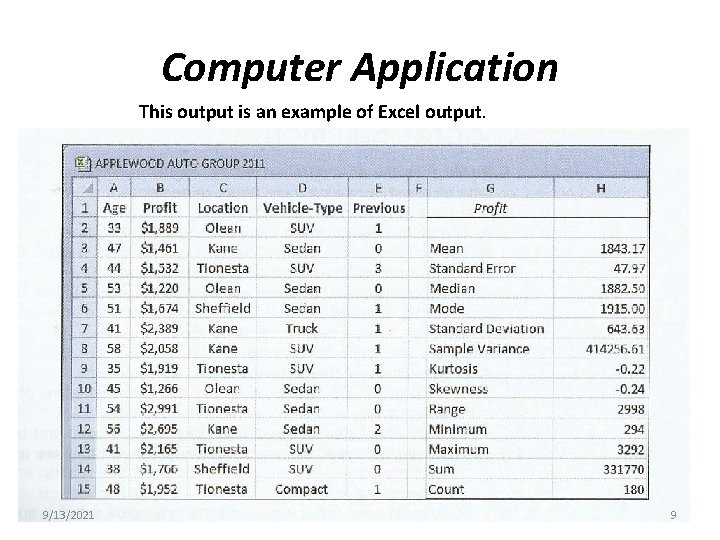
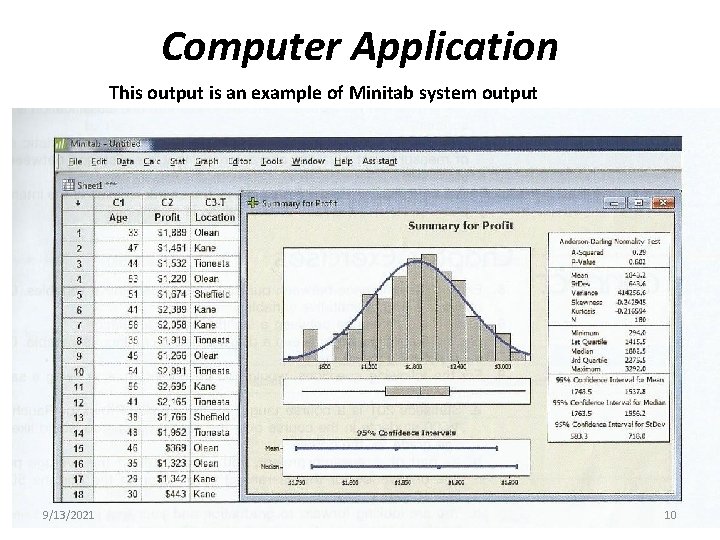
Computer Application Computers are now available to students at most colleges and universities, Spreadsheet such as Microsoft Excel, and statistical software packages, such as Minitab, are available in most computer labs. The Microsoft Excel what we will be used in this course. 9/13/2021 8
Computer Application This output is an example of Excel output. 9/13/2021 9
Computer Application This output is an example of Minitab system output 9/13/2021 10
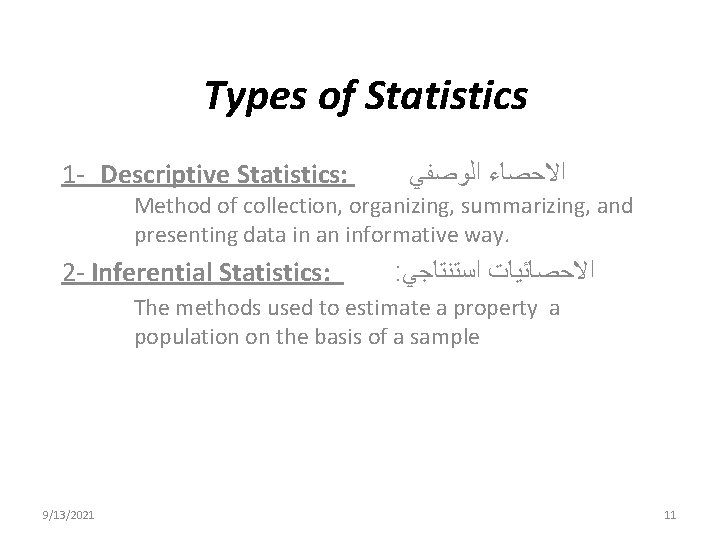
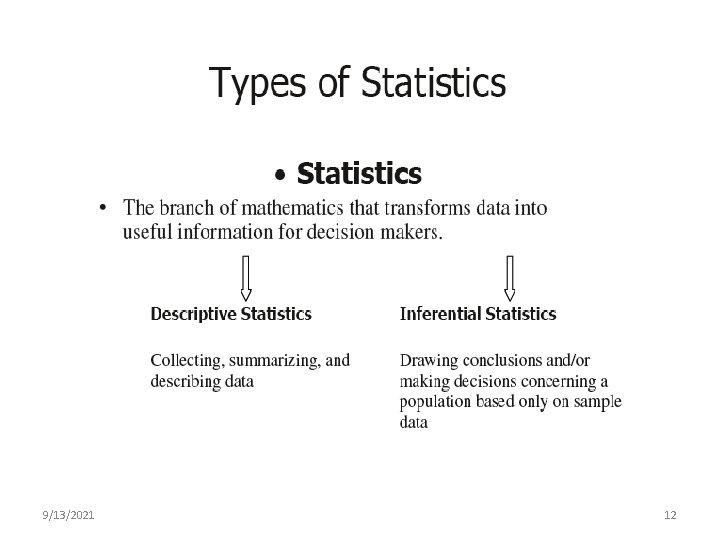
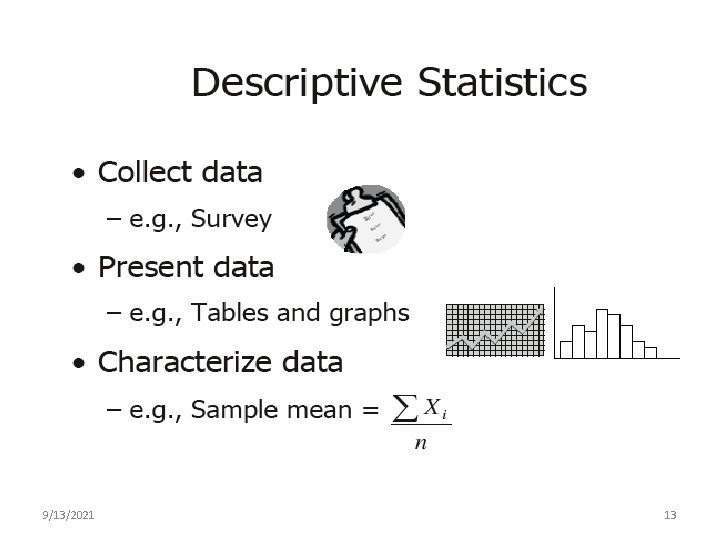
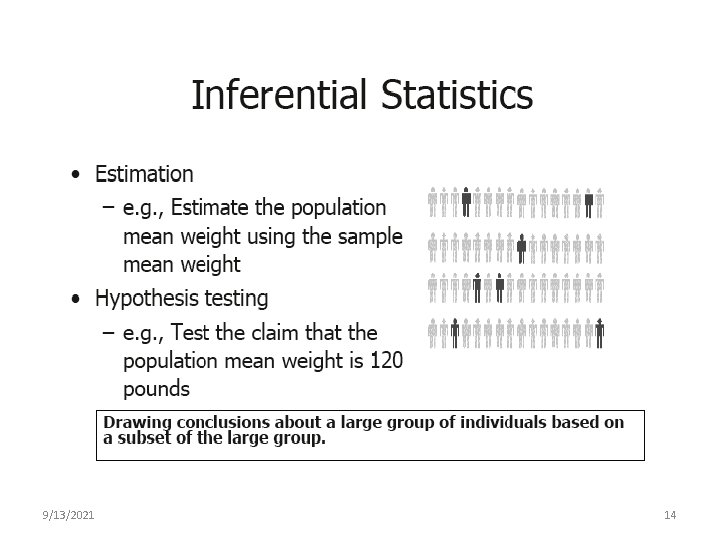
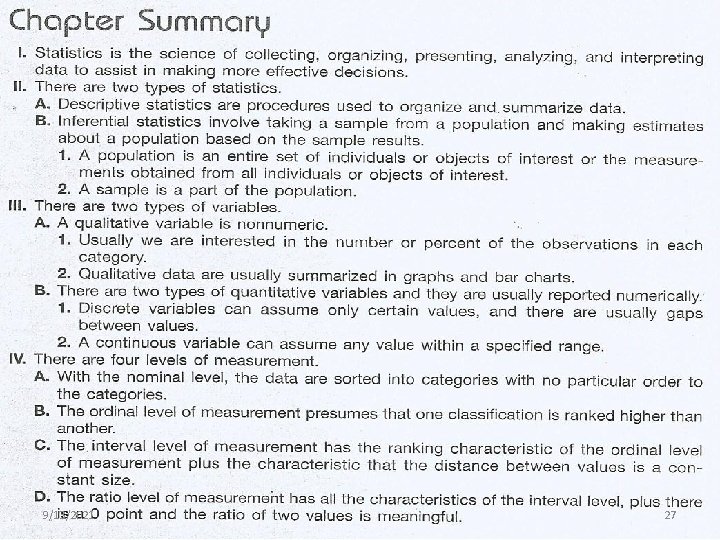
Types of Statistics 1 - Descriptive Statistics: ﺍﻻﺣﺼﺎﺀ ﺍﻟﻮﺻﻔﻲ Method of collection, organizing, summarizing, and presenting data in an informative way. 2 - Inferential Statistics: : ﺍﻻﺣﺼﺎﺋﻴﺎﺕ ﺍﺳﺘﻨﺘﺎﺟﻲ The methods used to estimate a property a population on the basis of a sample 9/13/2021 11
9/13/2021 12
9/13/2021 13
9/13/2021 14
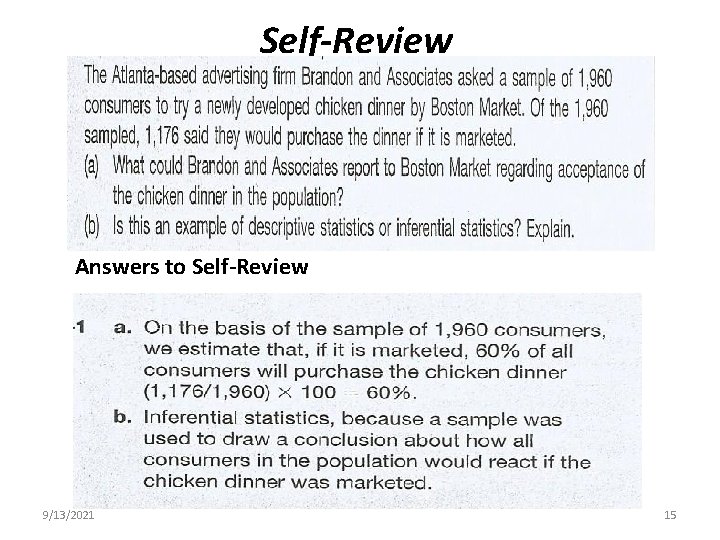
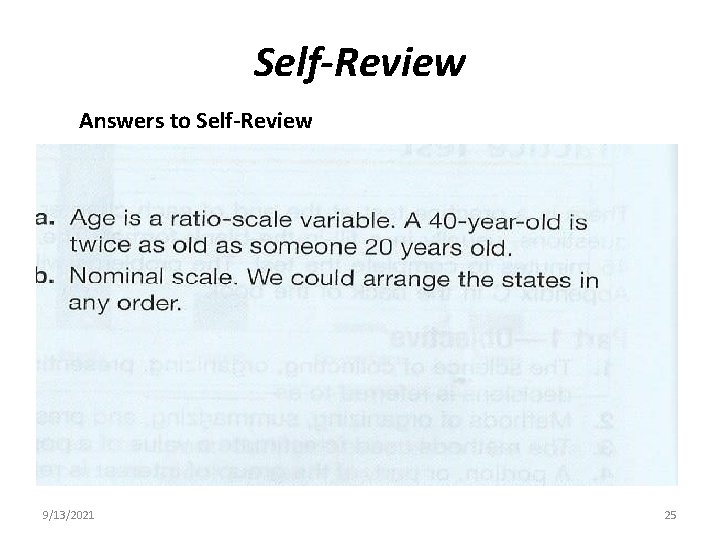
Self-Review Answers to Self-Review 9/13/2021 15
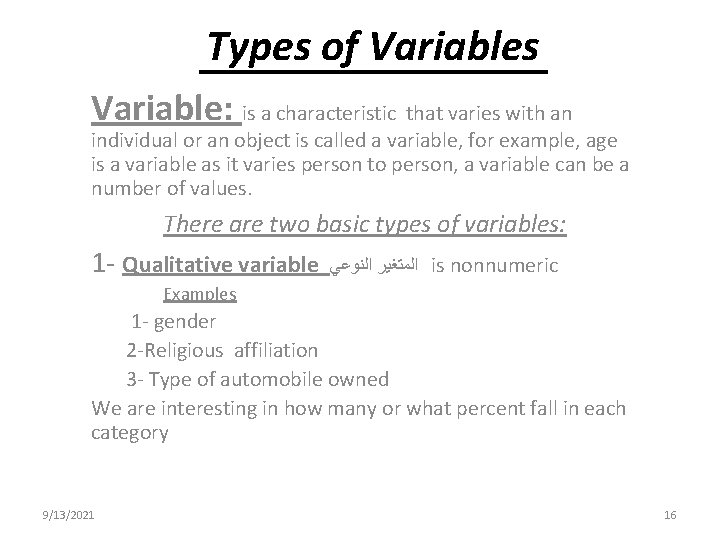
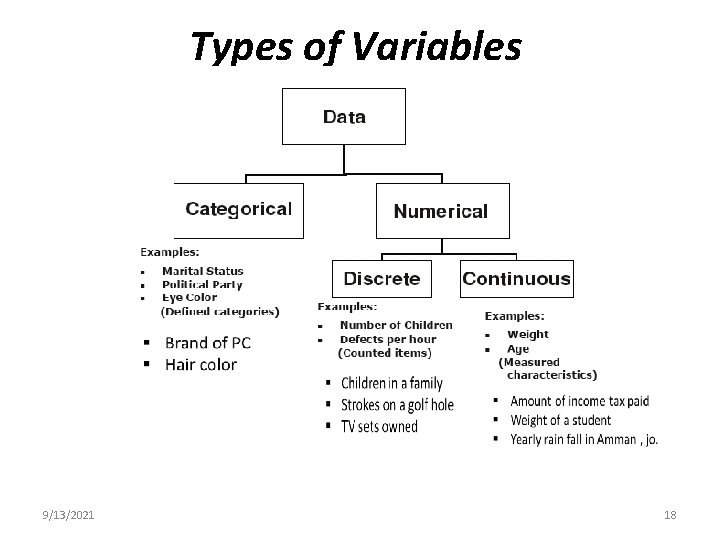
Types of Variables Variable: is a characteristic that varies with an individual or an object is called a variable, for example, age is a variable as it varies person to person, a variable can be a number of values. There are two basic types of variables: 1 - Qualitative variable ﺍﻟﻤﺘﻐﻴﺮ ﺍﻟﻨﻮﻋﻲ is nonnumeric Examples 1 - gender 2 -Religious affiliation 3 - Type of automobile owned We are interesting in how many or what percent fall in each category 9/13/2021 16
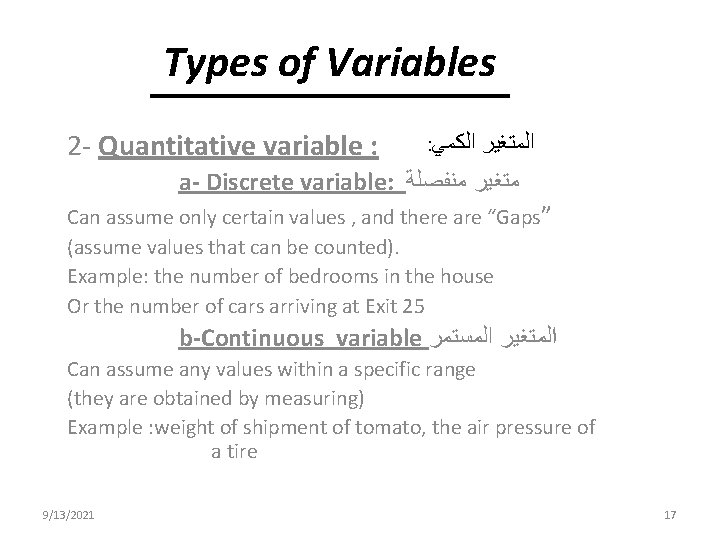
Types of Variables 2 - Quantitative variable : : ﺍﻟﻜﻤﻲ ﺍﻟﻤﺘﻐﻴﺮ a- Discrete variable: ﻣﺘﻐﻴﺮ ﻣﻨﻔﺼﻠﺔ Can assume only certain values , and there are “Gaps” (assume values that can be counted). Example: the number of bedrooms in the house Or the number of cars arriving at Exit 25 b-Continuous variable ﺍﻟﻤﺘﻐﻴﺮ ﺍﻟﻤﺴﺘﻤﺮ Can assume any values within a specific range (they are obtained by measuring) Example : weight of shipment of tomato, the air pressure of a tire 9/13/2021 17
Types of Variables 9/13/2021 18
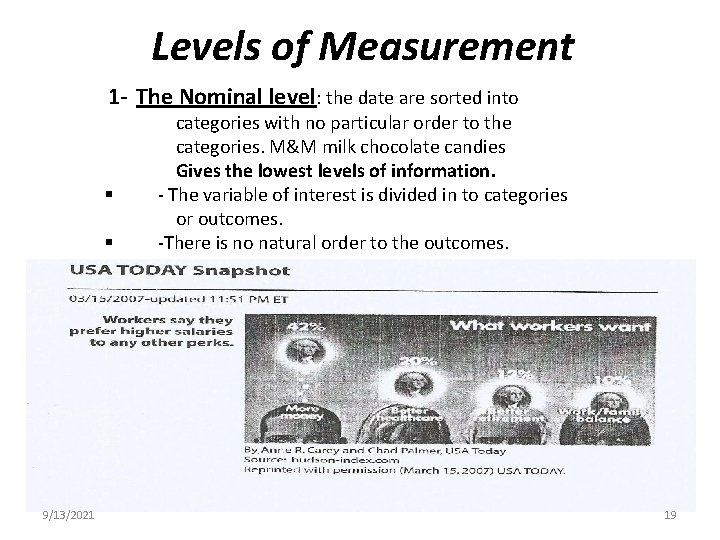
Levels of Measurement 1 - The Nominal level: the date are sorted into § § 9/13/2021 categories with no particular order to the categories. M&M milk chocolate candies Gives the lowest levels of information. - The variable of interest is divided in to categories or outcomes. -There is no natural order to the outcomes. 19
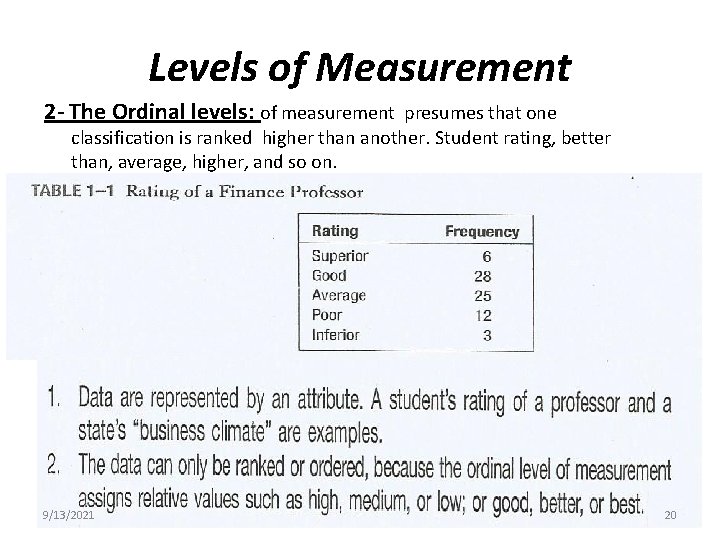
Levels of Measurement 2 - The Ordinal levels: of measurement presumes that one classification is ranked higher than another. Student rating, better than, average, higher, and so on. 9/13/2021 20
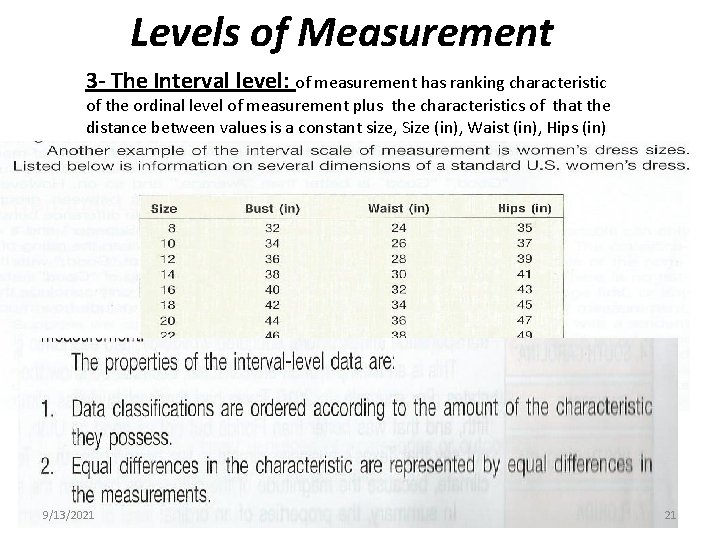
Levels of Measurement 3 - The Interval level: of measurement has ranking characteristic of the ordinal level of measurement plus the characteristics of that the distance between values is a constant size, Size (in), Waist (in), Hips (in) 9/13/2021 21
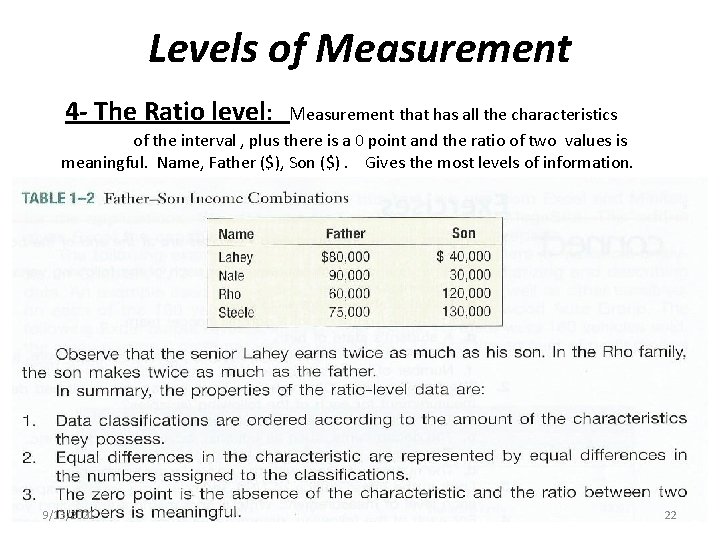
Levels of Measurement 4 - The Ratio level: Measurement that has all the characteristics of the interval , plus there is a 0 point and the ratio of two values is meaningful. Name, Father ($), Son ($). Gives the most levels of information. 9/13/2021 22
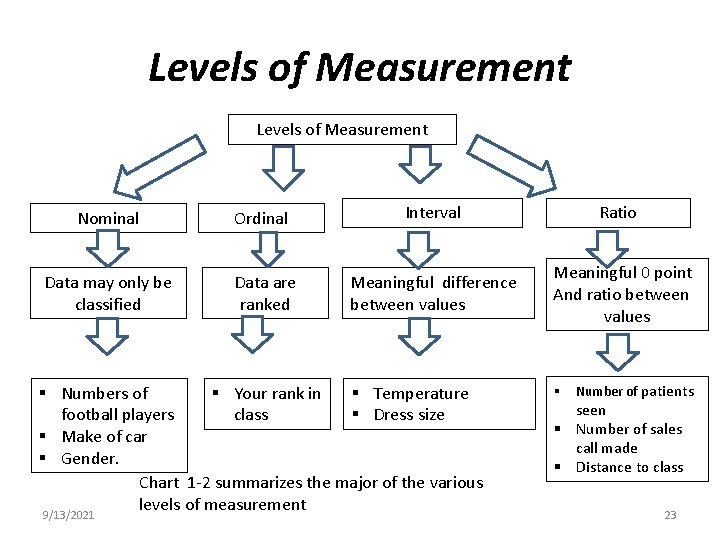
Levels of Measurement Nominal Ordinal Interval Ratio Data may only be classified Data are ranked Meaningful difference between values Meaningful 0 point And ratio between values § Numbers of § Your rank in § Temperature football players class § Dress size § Make of car § Gender. Chart 1 -2 summarizes the major of the various levels of measurement 9/13/2021 § Number of patients seen § Number of sales call made § Distance to class 23
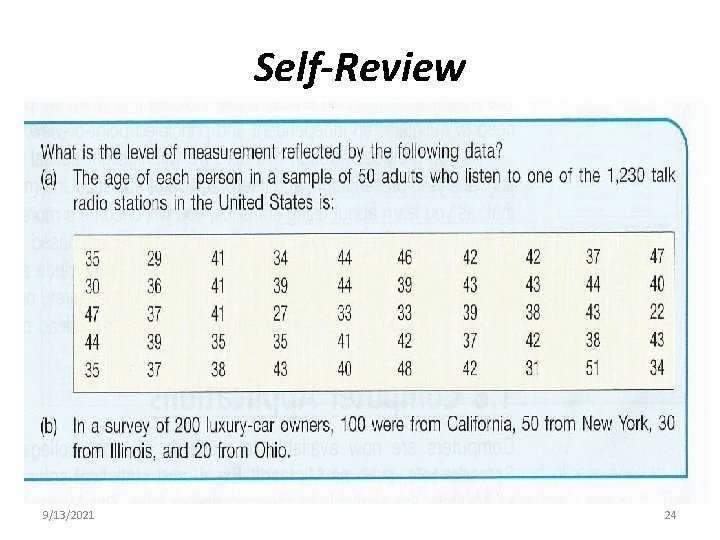
Self-Review 9/13/2021 24
Self-Review Answers to Self-Review 9/13/2021 25
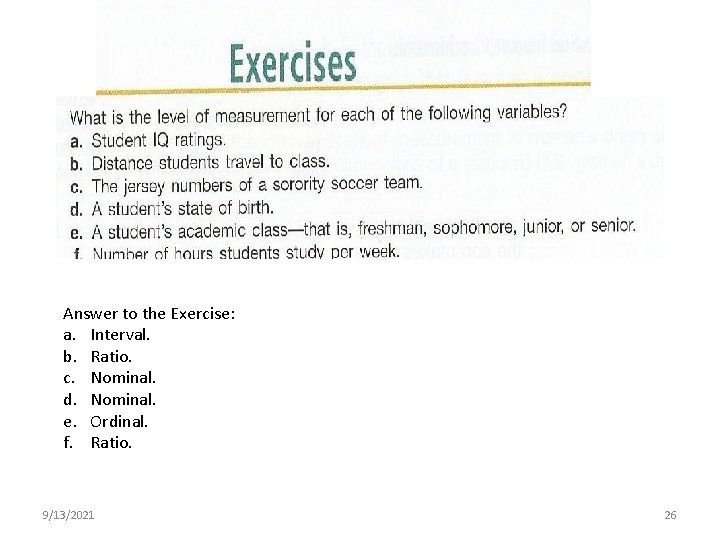
er Answer to the Exercise: a. Interval. b. Ratio. c. Nominal. d. Nominal. e. Ordinal. f. Ratio. 9/13/2021 26
9/13/2021 27
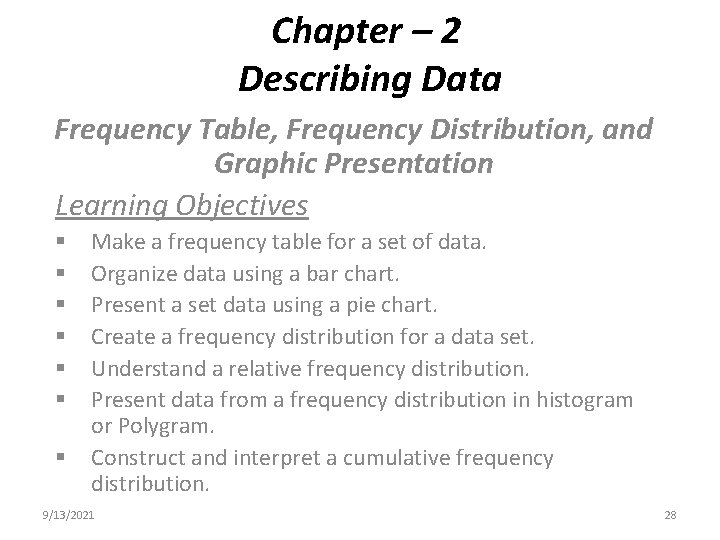
Chapter – 2 Describing Data Frequency Table, Frequency Distribution, and Graphic Presentation Learning Objectives § § § § Make a frequency table for a set of data. Organize data using a bar chart. Present a set data using a pie chart. Create a frequency distribution for a data set. Understand a relative frequency distribution. Present data from a frequency distribution in histogram or Polygram. Construct and interpret a cumulative frequency distribution. 9/13/2021 28
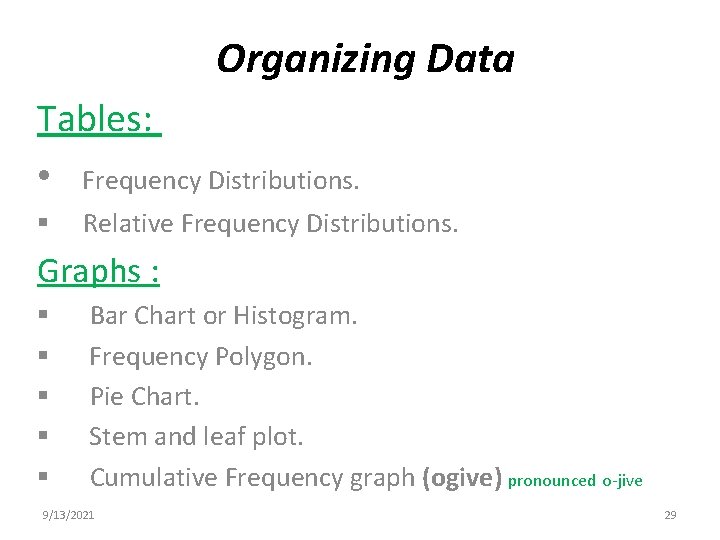
Organizing Data Tables: • Frequency Distributions. § Relative Frequency Distributions. Graphs : § § § Bar Chart or Histogram. Frequency Polygon. Pie Chart. Stem and leaf plot. Cumulative Frequency graph (ogive) pronounced o-jive 9/13/2021 29
Organizing Data § When data are collected in original form, they are called Raw Data. § When the raw data is organized into a Frequency Distribution, the frequency will be the number of values in a specific class of the distribution. § A Frequency Distribution is the organizing of raw data table form, classes and frequencies. 9/13/2021 30
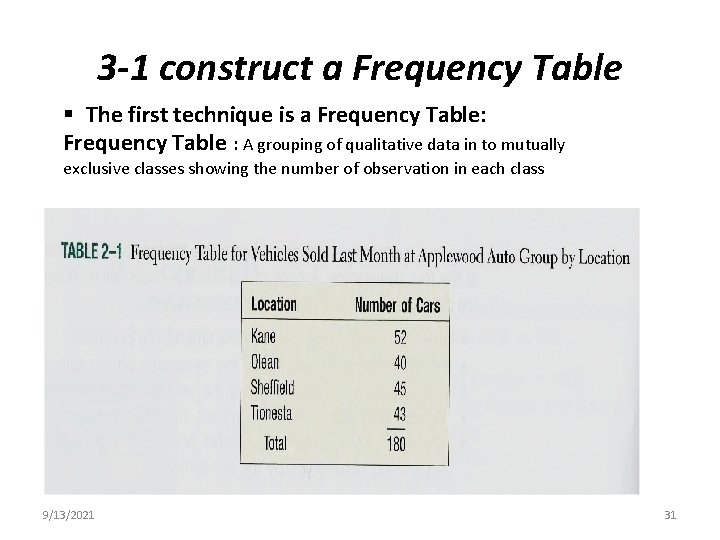
3 -1 construct a Frequency Table § The first technique is a Frequency Table: Frequency Table : A grouping of qualitative data in to mutually exclusive classes showing the number of observation in each class 9/13/2021 31
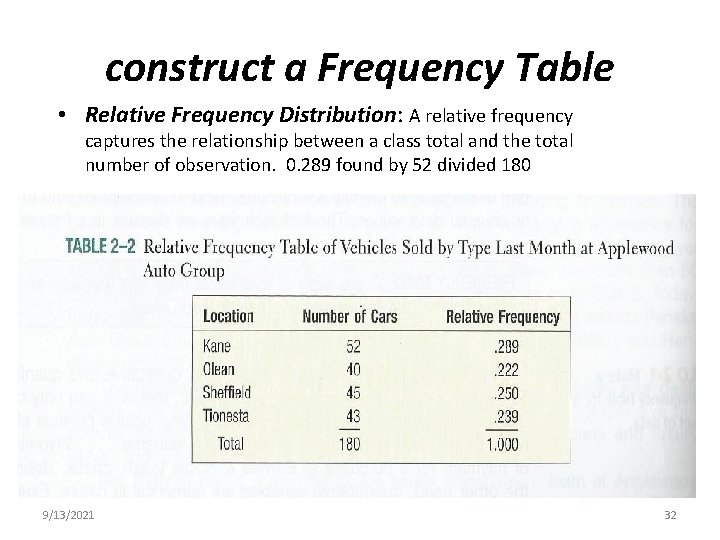
construct a Frequency Table • Relative Frequency Distribution: A relative frequency captures the relationship between a class total and the total number of observation. 0. 289 found by 52 divided 180 9/13/2021 32
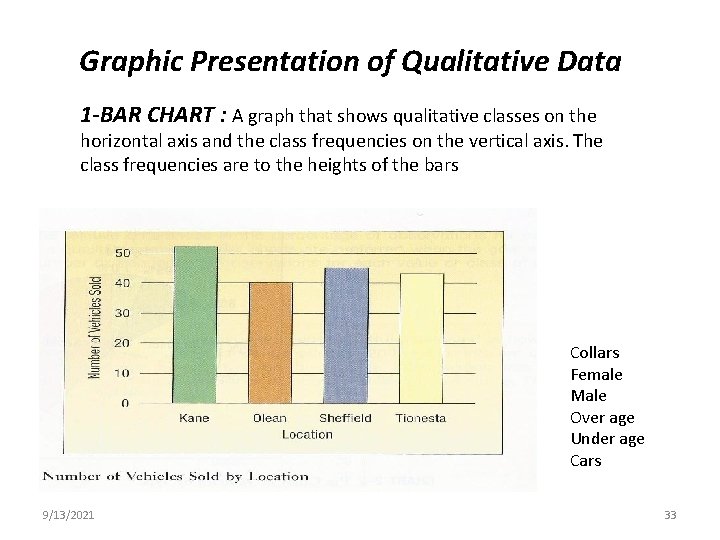
Graphic Presentation of Qualitative Data 1 -BAR CHART : A graph that shows qualitative classes on the horizontal axis and the class frequencies on the vertical axis. The class frequencies are to the heights of the bars Collars Female Male Over age Under age Cars 9/13/2021 33
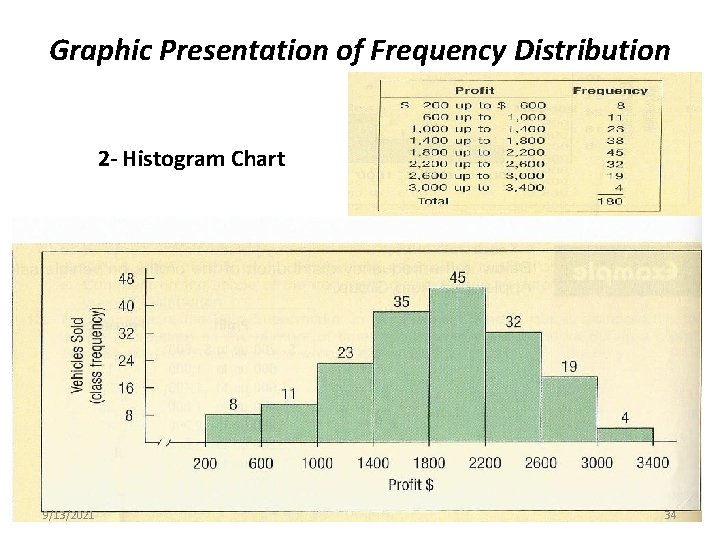
Graphic Presentation of Frequency Distribution 2 - Histogram Chart 9/13/2021 34
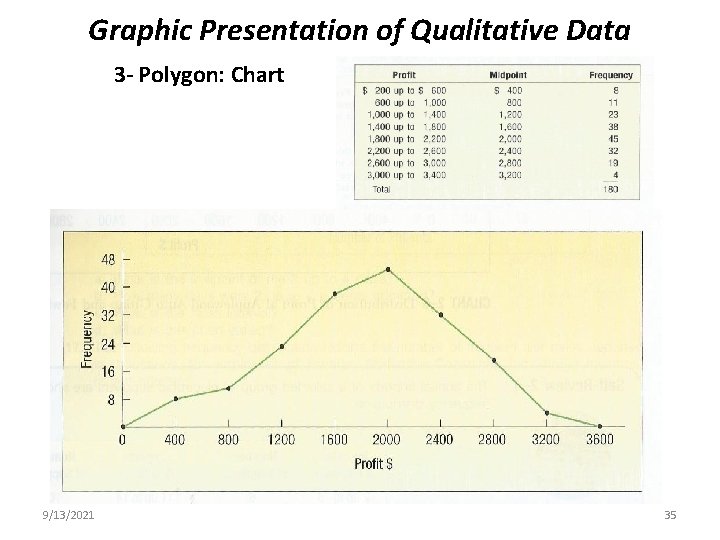
Graphic Presentation of Qualitative Data 3 - Polygon: Chart 9/13/2021 35