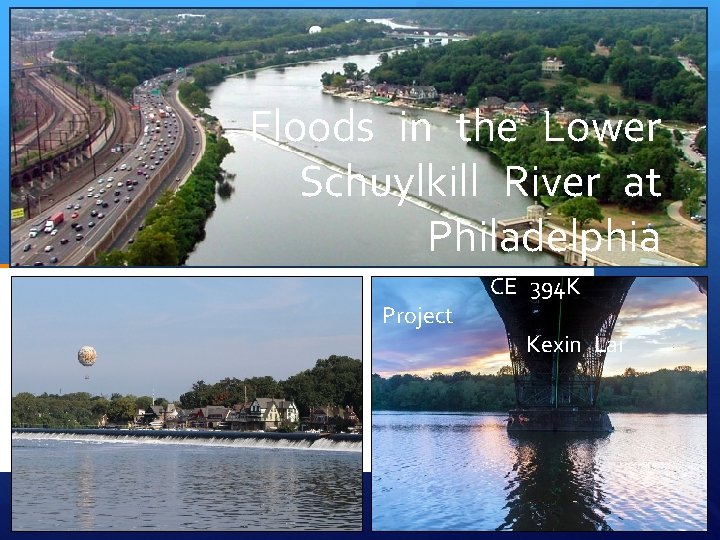
Floods in the Lower Schuylkill River at Philadelphia

- Slides: 13
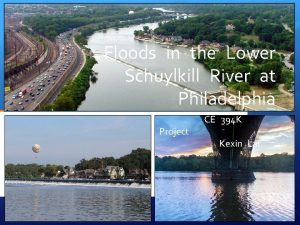
Floods in the Lower Schuylkill River at Philadelphia Project CE 394 K Kexin Lai
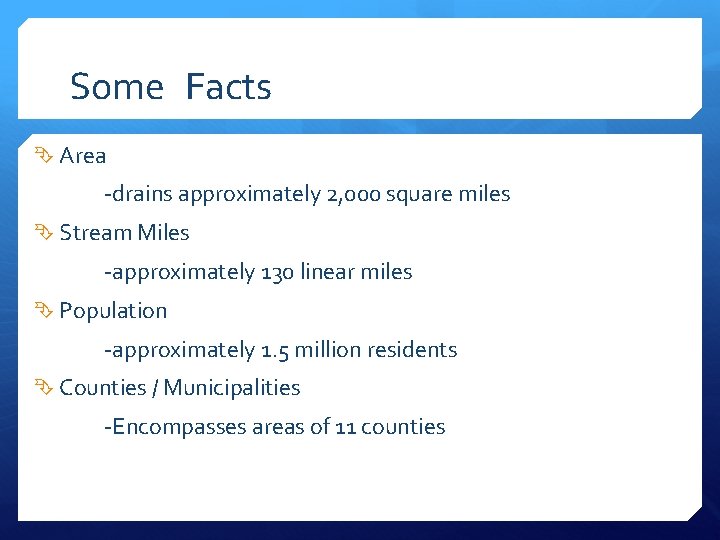
Some Facts Area -drains approximately 2, 000 square miles Stream Miles -approximately 130 linear miles Population -approximately 1. 5 million residents Counties / Municipalities -Encompasses areas of 11 counties
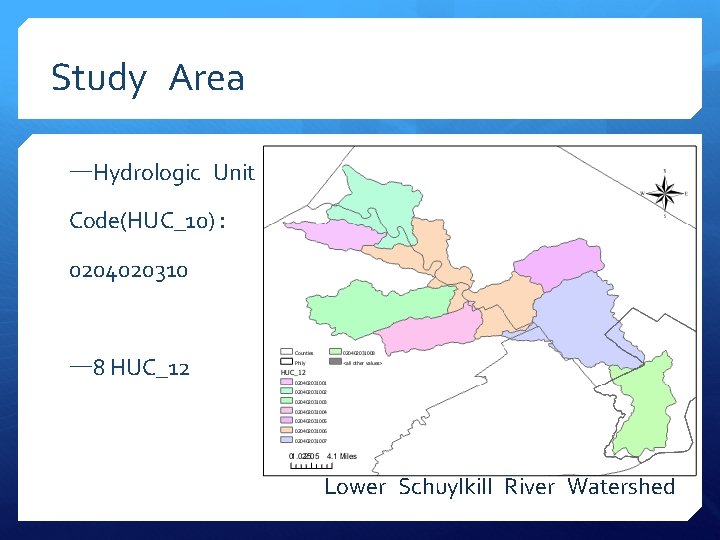
Study Area —Hydrologic Unit Code(HUC_10): 0204020310 — 8 HUC_12 Lower Schuylkill River Watershed
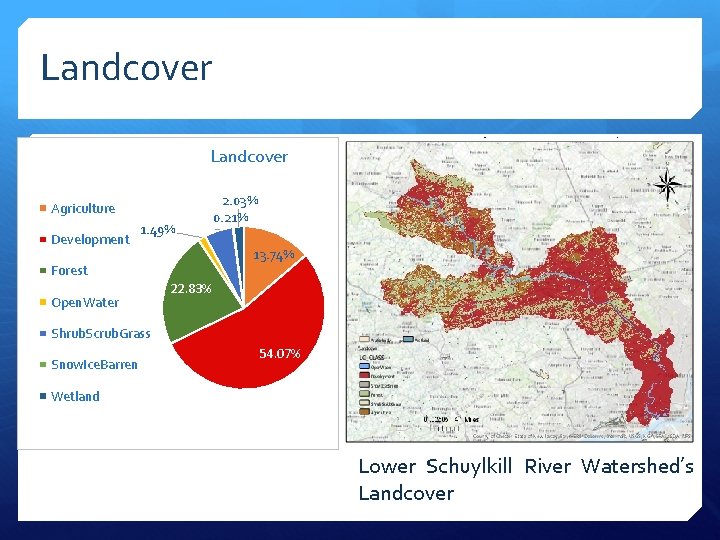
Landcover Agriculture Development 2. 03% 0. 21% 1. 49% 5. 62% 13. 74% Forest Open. Water 22. 83% Shrub. Scrub. Grass Snow. Ice. Barren 54. 07% Wetland Lower Schuylkill River Watershed’s Landcover
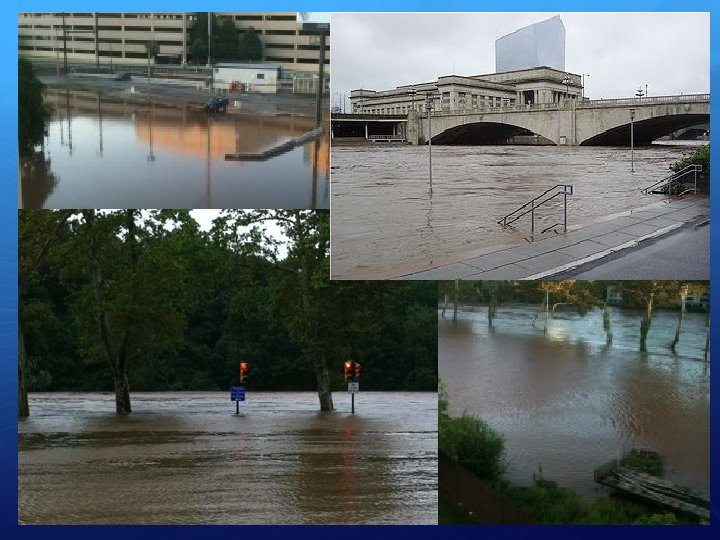
Urbanization and Flood Urbanization increases peak discharges and decreases lag times Increases the amount of people at risk to flooding The larger the storm, and the larger the impact of urban Loss of lives and property Loss of livelihoods Mass migration Etc.
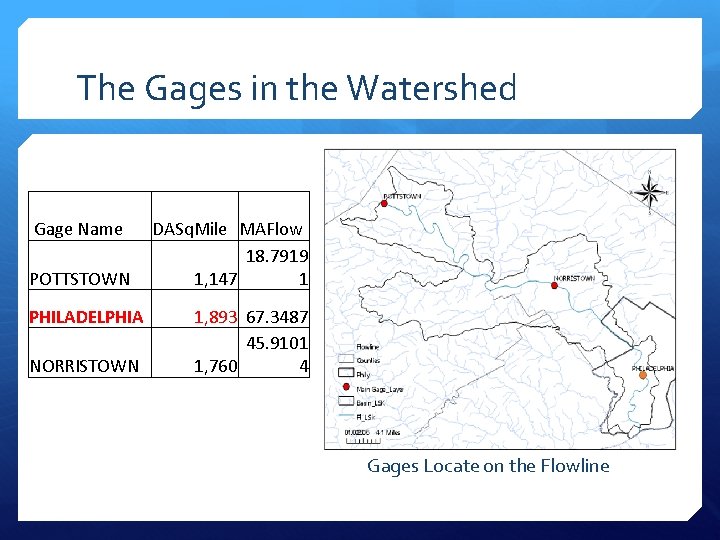
The Gages in the Watershed Gage Name POTTSTOWN PHILADELPHIA NORRISTOWN DASq. Mile MAFlow 18. 7919 1, 147 1 1, 893 67. 3487 45. 9101 1, 760 4 Gages Locate on the Flowline
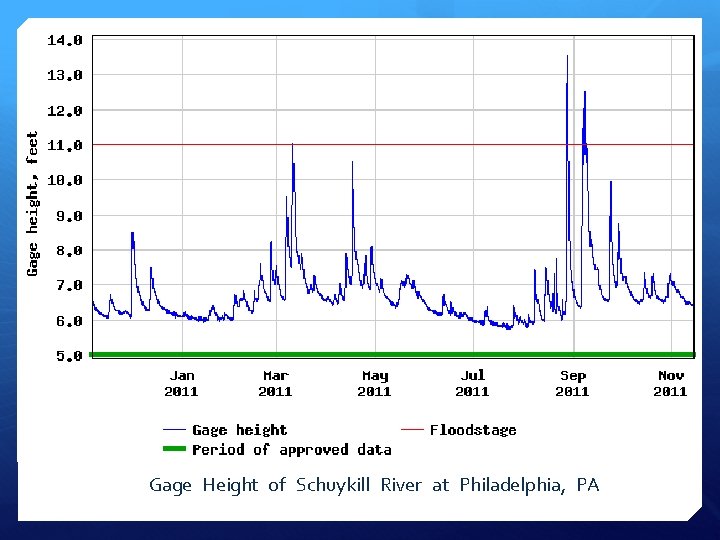
Gage Height of Schuykill River at Philadelphia, PA
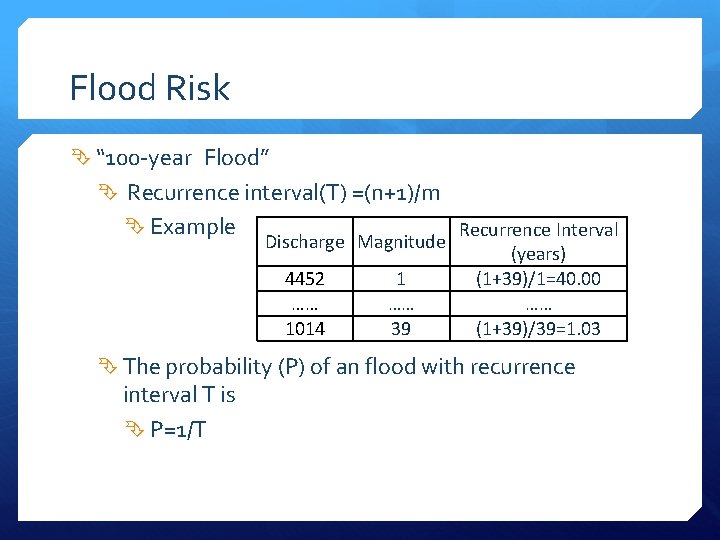
Flood Risk “ 100 -year Flood” Recurrence interval(T) =(n+1)/m Example Discharge Magnitude 4452 …… 1014 1 …… 39 Recurrence Interval (years) (1+39)/1=40. 00 …… (1+39)/39=1. 03 The probability (P) of an flood with recurrence interval T is P=1/T
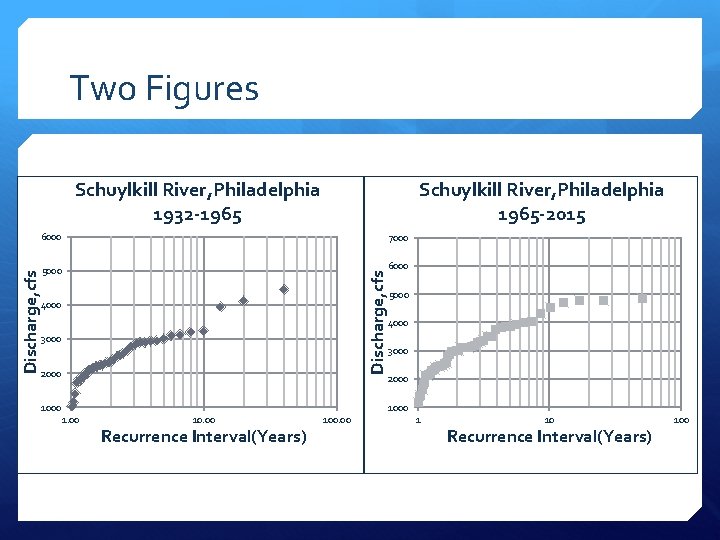
Two Figures Schuylkill River, Philadelphia 1965 -2015 6000 7000 5000 6000 Discharge, cfs Schuylkill River, Philadelphia 1932 -1965 4000 3000 2000 1000 5000 4000 3000 2000 10. 00 Recurrence Interval(Years) 100. 00 1 10 Recurrence Interval(Years) 100
Further study Precipitation data Analyze the connection between gage height discharge Suggestion for preventing flood …… and
Reference Baer, E. M. (n. d. ). Floods and Flooding. Retrieved November 14, 2016, from http: //serc. carleton. edu/quantskills/methods/quantlit/floods. html USGS Current Conditions for USGS 01472000 Schuylkill River at Pottstown, PA. (n. d. ). Retrieved November 14, 2016, from http: //waterdata. usgs. gov/nwis/uv? 01472000 USGS Current Conditions for USGS 01471510 Schuylkill River at Reading, PA. (n. d. ). Retrieved November 14, 2016, from http: //waterdata. usgs. gov/usa/nwis/uv? 01471510 USGS Current Conditions for USGS 01473500 Schuylkill River at Norristown, PA. (n. d. ). Retrieved November 14, 2016, from http: //waterdata. usgs. gov/usa/nwis/uv? 01473500 USGS Current Conditions for USGS 01474500 Schuylkill River at Philadelphia, PA. (n. d. ). Retrieved November 14, 2016, from http: //waterdata. usgs. gov/usa/nwis/uv? 01474500 Alexakis et al. , 2014; Bronstert et al. , 2002; Greenough et al. , 2001; Ouellet et al. , 2012; Wheater et al. , 2009 Your Watershed. (n. d. ). Retrieved November 14, 2016, from http: //phillywatersheds. org/your_watershed USGS Surface Water data for Pennsylvania: USGS Annual Statistics. (n. d. ). Retrieved November 15, 2016, from http: //waterdata. usgs. gov/pa/nwis/water
Questions