
Effect of Antecedent Groundwater Level on Piezometric Response
- Slides: 23
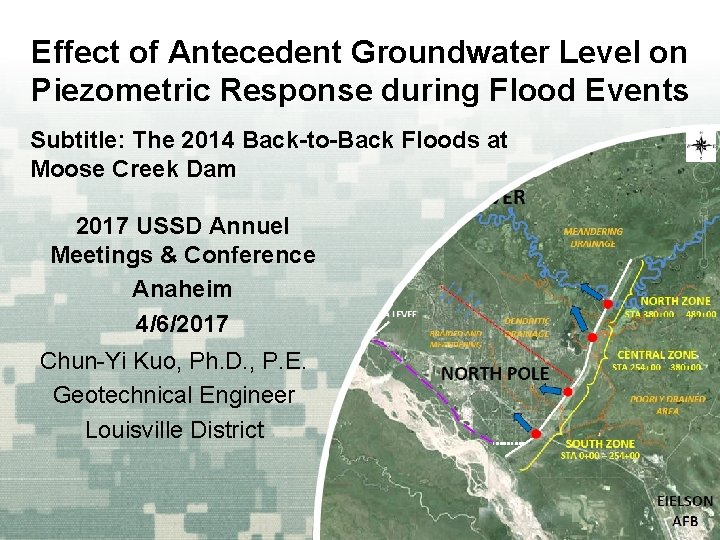
Effect of Antecedent Groundwater Level on Piezometric Response during Flood Events Subtitle: The 2014 Back-to-Back Floods at Moose Creek Dam 2017 USSD Annuel Meetings & Conference Anaheim 4/6/2017 Chun-Yi Kuo, Ph. D. , P. E. Geotechnical Engineer Louisville District
OUTLINE § § § Introduction Moose Creek Dam 2014 Floods & Escalated Boil Activities Piezometric Response and Its Assessment Conclusion BUILDING STRONG®
Introduction § Piezometers are important in monitoring dam performance § Escalated boil activities were observed at Moose Creek Dam during 2014 floods § 2014 floods are moderate, back-to-back floods § The elevated piezometric response requires further assessment BUILDING STRONG®
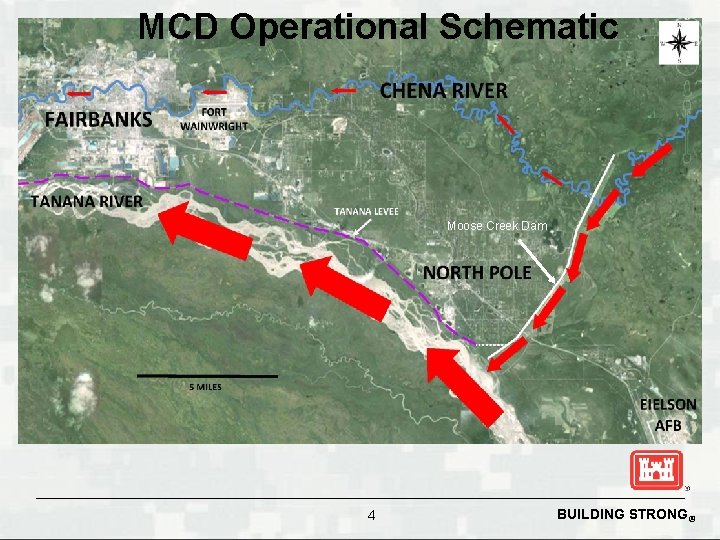
MCD Operational Schematic Moose Creek Dam 4 BUILDING STRONG®
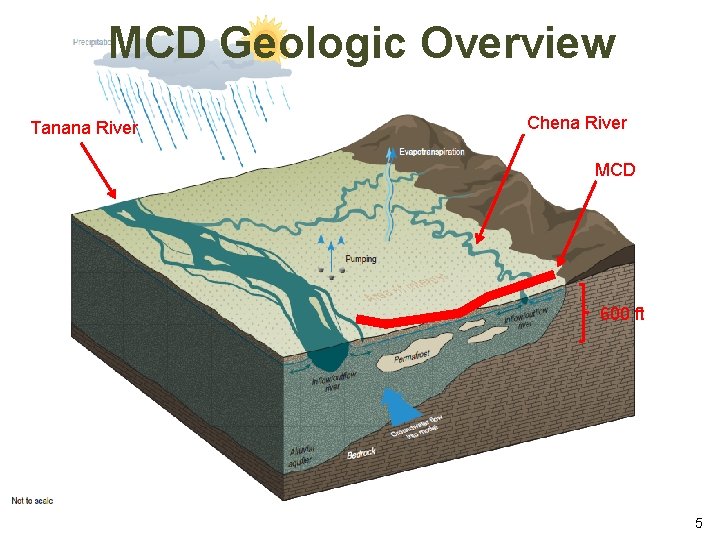
MCD Geologic Overview Tanana River Chena River MCD 600 ft BUILDING STRONG® 5
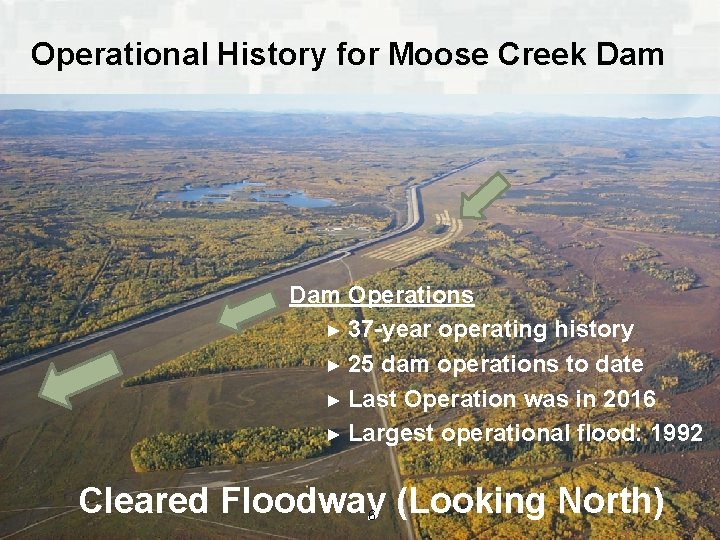
Operational History for Moose Creek Dam Operations ► 37 -year operating history ► 25 dam operations to date ► Last Operation was in 2016 ► Largest operational flood: 1992 Cleared Floodway (Looking North) 6 BUILDING STRONG®
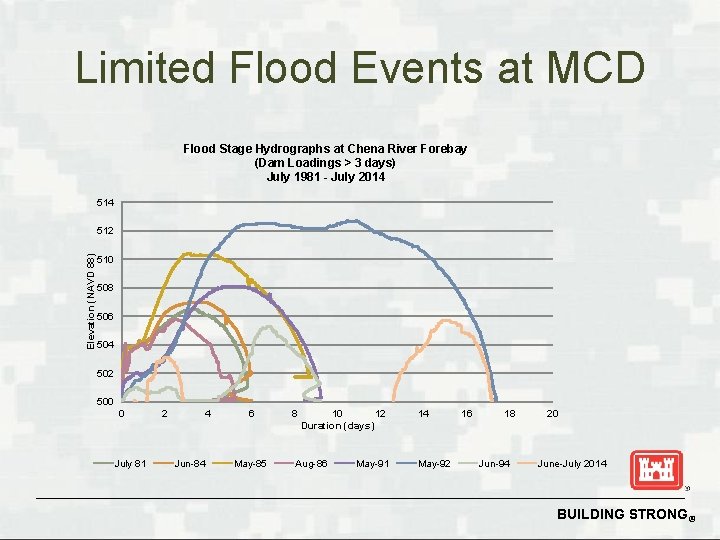
MCD Piezometer Data Analysis: Basic Information & Challenges § MCD has more than 100+ working piezometers § MCD typically is a dry dam, it has limited flood events to dates - Only has 8 events with flood over 505’ § PZs were manually read during flood events § PZ readings are limited, scatter, incomplete, and many are missing. § “Piezometrer Response Ratio” was utilized for meaningful piezometer data analysis BUILDING STRONG®
Limited Flood Events at MCD Flood Stage Hydrographs at Chena River Forebay (Dam Loadings > 3 days) July 1981 - July 2014 514 Elevation (NAVD 88) 512 510 508 506 504 502 500 0 July 81 2 4 Jun-84 6 May-85 8 10 12 Duration (days) Aug-86 May-91 14 May-92 16 18 Jun-94 20 June-July 2014 BUILDING STRONG®
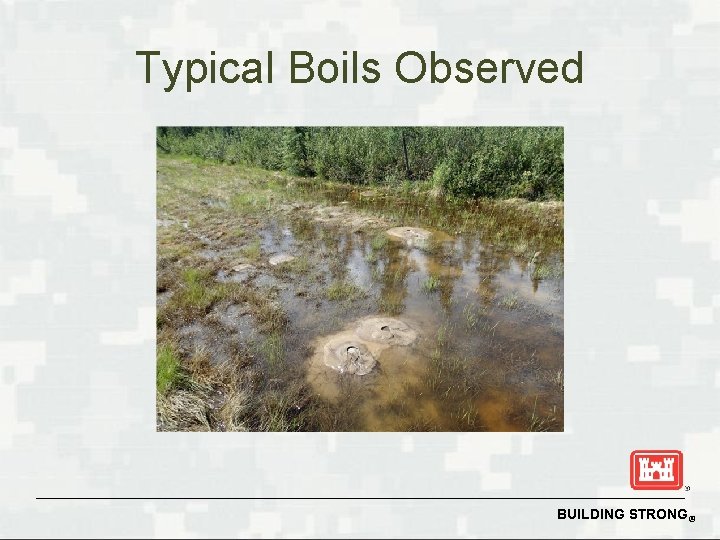
The 2014 Floods § Two rainfall events (late June & early July) resulted in gate closures and impoundment of floodwaters § The 2014 flood season was the first time since 2003 that the floodway was inundated with a pool, although the inundation was partial. § The 2014 flood loadings were less than the 1992 pool of record and other previous major events. § A total of 1, 434 boils were found downstream of the stability berm!!! (Escalated boil activity) BUILDING STRONG®
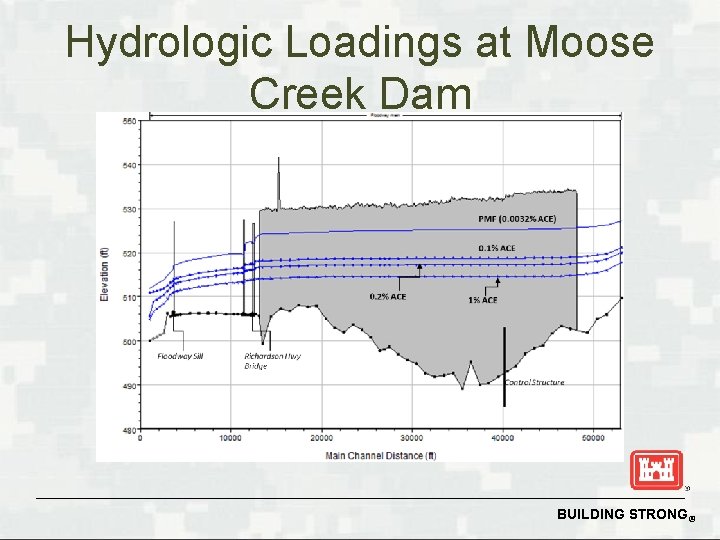
Hydrologic Loadings at Moose Creek Dam BUILDING STRONG®
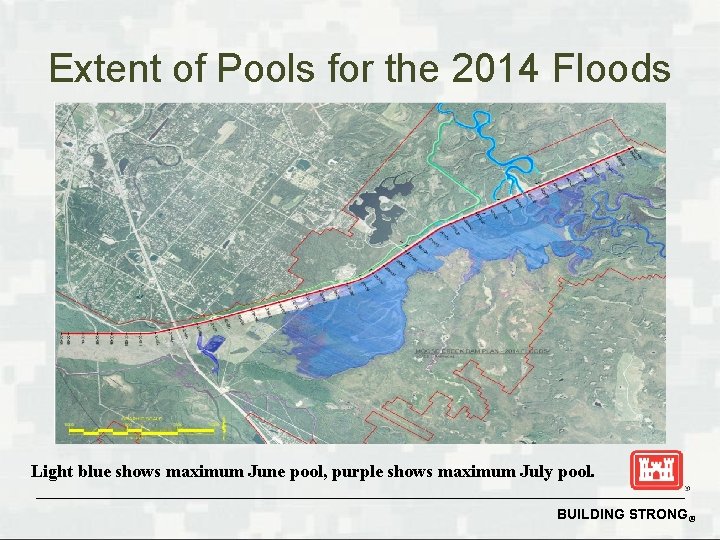
Extent of Pools for the 2014 Floods Light blue shows maximum June pool, purple shows maximum July pool. BUILDING STRONG®
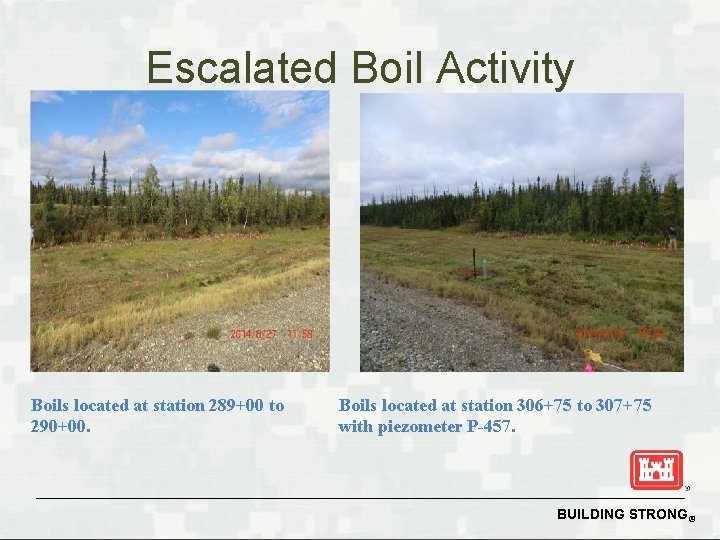
Escalated Boil Activity Boils located at station 289+00 to 290+00. Boils located at station 306+75 to 307+75 with piezometer P-457. BUILDING STRONG®
Typical Boils Observed BUILDING STRONG®
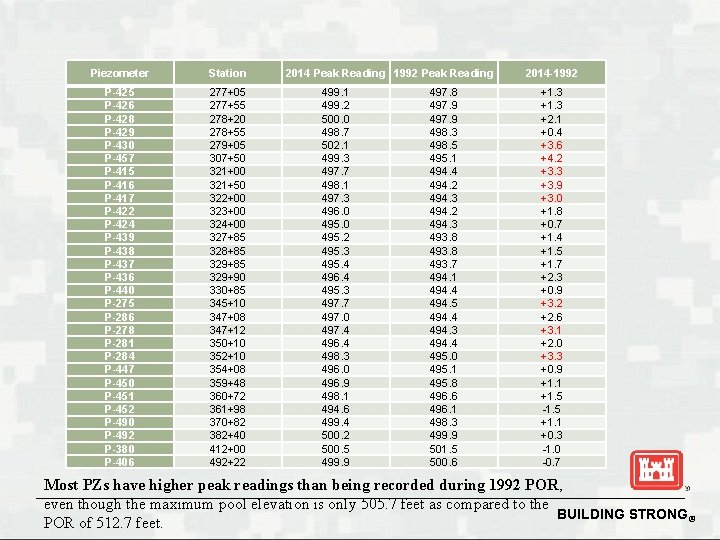
Piezometer Station P-425 P-426 P-428 P-429 P-430 P-457 P-415 P-416 P-417 P-422 P-424 P-439 P-438 P-437 P-436 P-440 P-275 P-286 P-278 P-281 P-284 P-447 P-450 P-451 P-452 P-490 P-492 P-380 P-406 277+05 277+55 278+20 278+55 279+05 307+50 321+00 321+50 322+00 323+00 324+00 327+85 328+85 329+90 330+85 345+10 347+08 347+12 350+10 352+10 354+08 359+48 360+72 361+98 370+82 382+40 412+00 492+22 2014 Peak Reading 1992 Peak Reading 499. 1 499. 2 500. 0 498. 7 502. 1 499. 3 497. 7 498. 1 497. 3 496. 0 495. 2 495. 3 495. 4 496. 4 495. 3 497. 7 497. 0 497. 4 496. 4 498. 3 496. 0 496. 9 498. 1 494. 6 499. 4 500. 2 500. 5 499. 9 497. 8 497. 9 498. 3 498. 5 495. 1 494. 4 494. 2 494. 3 493. 8 493. 7 494. 1 494. 4 494. 5 494. 4 494. 3 494. 4 495. 0 495. 1 495. 8 496. 6 496. 1 498. 3 499. 9 501. 5 500. 6 2014 -1992 +1. 3 +2. 1 +0. 4 +3. 6 +4. 2 +3. 3 +3. 9 +3. 0 +1. 8 +0. 7 +1. 4 +1. 5 +1. 7 +2. 3 +0. 9 +3. 2 +2. 6 +3. 1 +2. 0 +3. 3 +0. 9 +1. 1 +1. 5 -1. 5 +1. 1 +0. 3 -1. 0 -0. 7 Most PZs have higher peak readings than being recorded during 1992 POR, even though the maximum pool elevation is only 505. 7 feet as compared to the BUILDING STRONG® POR of 512. 7 feet.
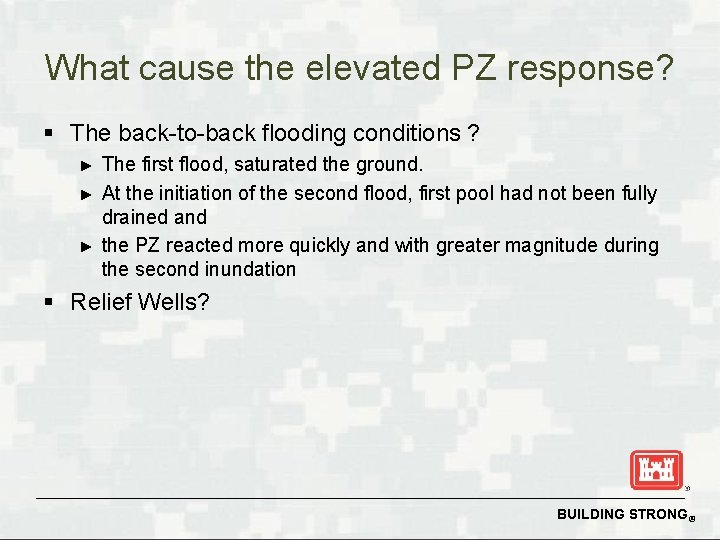
What cause the elevated PZ response? § The back-to-back flooding conditions ? ► ► ► The first flood, saturated the ground. At the initiation of the second flood, first pool had not been fully drained and the PZ reacted more quickly and with greater magnitude during the second inundation § Relief Wells? BUILDING STRONG®
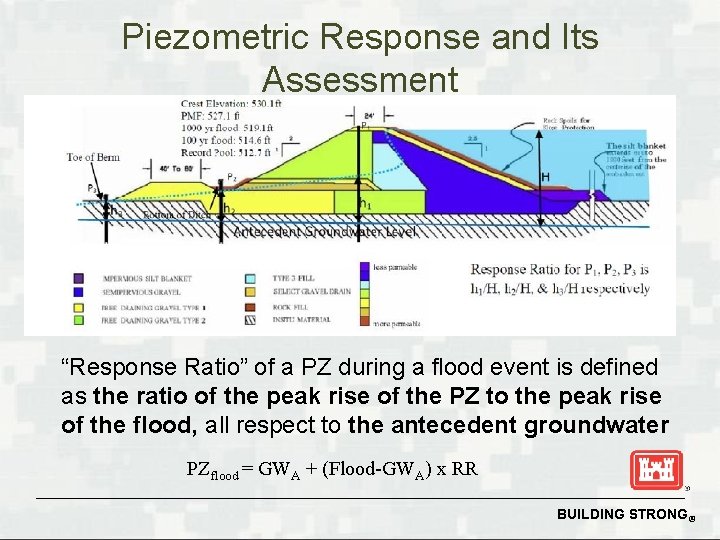
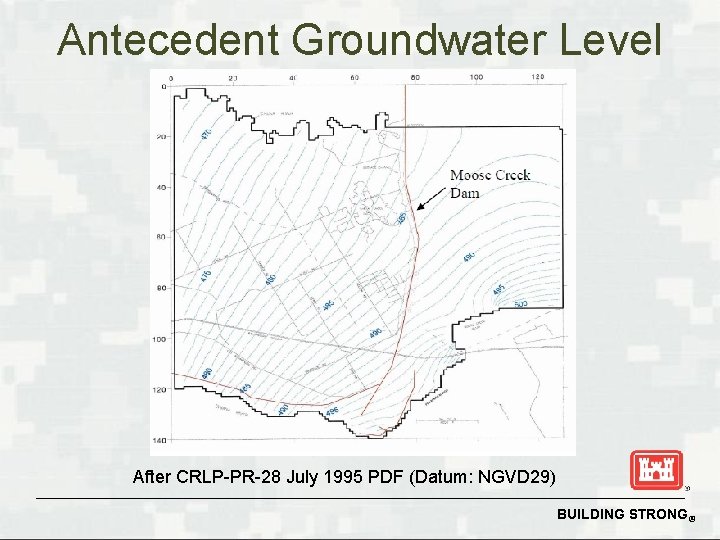
Piezometric Response and Its Assessment “Response Ratio” of a PZ during a flood event is defined as the ratio of the peak rise of the PZ to the peak rise of the flood, all respect to the antecedent groundwater PZflood = GWA + (Flood-GWA) x RR BUILDING STRONG®
Antecedent Groundwater Level After CRLP-PR-28 July 1995 PDF (Datum: NGVD 29) BUILDING STRONG®
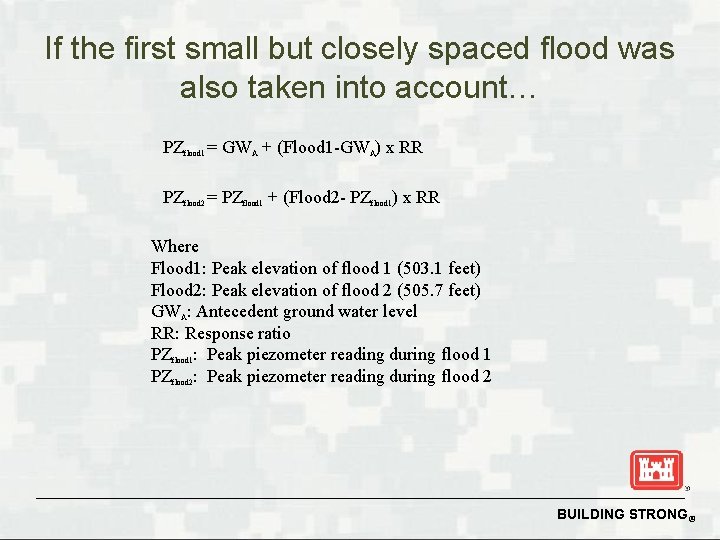
If the first small but closely spaced flood was also taken into account… PZflood 1 = GWA + (Flood 1 -GWA) x RR PZflood 2 = PZflood 1 + (Flood 2 - PZflood 1) x RR Where Flood 1: Peak elevation of flood 1 (503. 1 feet) Flood 2: Peak elevation of flood 2 (505. 7 feet) GWA: Antecedent ground water level RR: Response ratio PZflood 1: Peak piezometer reading during flood 1 PZflood 2: Peak piezometer reading during flood 2 BUILDING STRONG®
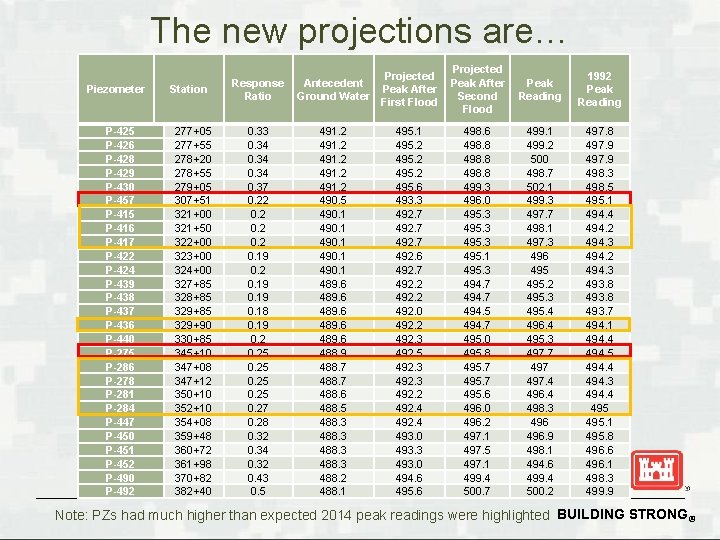
The new projections are… Piezometer P-425 P-426 P-428 P-429 P-430 P-457 P-415 P-416 P-417 P-422 P-424 P-439 P-438 P-437 P-436 P-440 P-275 P-286 P-278 P-281 P-284 P-447 P-450 P-451 P-452 P-490 P-492 Station 277+05 277+55 278+20 278+55 279+05 307+51 321+00 321+50 322+00 323+00 324+00 327+85 328+85 329+90 330+85 345+10 347+08 347+12 350+10 352+10 354+08 359+48 360+72 361+98 370+82 382+40 Response Ratio Antecedent Ground Water Projected Peak After First Flood Projected Peak After Second Flood Peak Reading 1992 Peak Reading 0. 33 0. 34 0. 37 0. 22 0. 19 0. 18 0. 19 0. 25 0. 27 0. 28 0. 32 0. 34 0. 32 0. 43 0. 5 491. 2 490. 5 490. 1 489. 6 488. 9 488. 7 488. 6 488. 5 488. 3 488. 2 488. 1 495. 2 495. 6 493. 3 492. 7 492. 6 492. 7 492. 2 492. 0 492. 2 492. 3 492. 5 492. 3 492. 2 492. 4 493. 0 493. 3 493. 0 494. 6 495. 6 498. 8 499. 3 496. 0 495. 3 495. 1 495. 3 494. 7 494. 5 494. 7 495. 0 495. 8 495. 7 495. 6 496. 0 496. 2 497. 1 497. 5 497. 1 499. 4 500. 7 499. 1 499. 2 500 498. 7 502. 1 499. 3 497. 7 498. 1 497. 3 496 495. 2 495. 3 495. 4 496. 4 495. 3 497. 7 497. 4 496. 4 498. 3 496. 9 498. 1 494. 6 499. 4 500. 2 497. 8 497. 9 498. 3 498. 5 495. 1 494. 4 494. 2 494. 3 493. 8 493. 7 494. 1 494. 4 494. 5 494. 4 494. 3 494. 4 495. 1 495. 8 496. 6 496. 1 498. 3 499. 9 Note: PZs had much higher than expected 2014 peak readings were highlighted BUILDING STRONG®
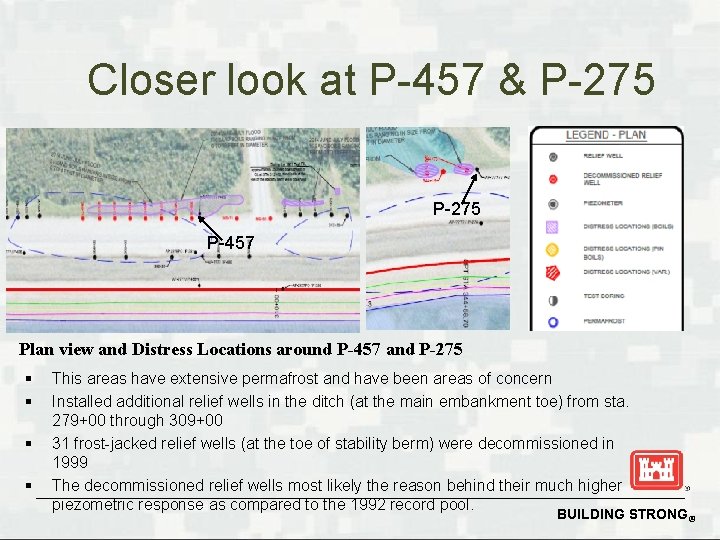
Closer look at P-457 & P-275 P-457 Plan view and Distress Locations around P-457 and P-275 § § This areas have extensive permafrost and have been areas of concern Installed additional relief wells in the ditch (at the main embankment toe) from sta. 279+00 through 309+00 31 frost-jacked relief wells (at the toe of stability berm) were decommissioned in 1999 The decommissioned relief wells most likely the reason behind their much higher piezometric response as compared to the 1992 record pool. BUILDING STRONG®
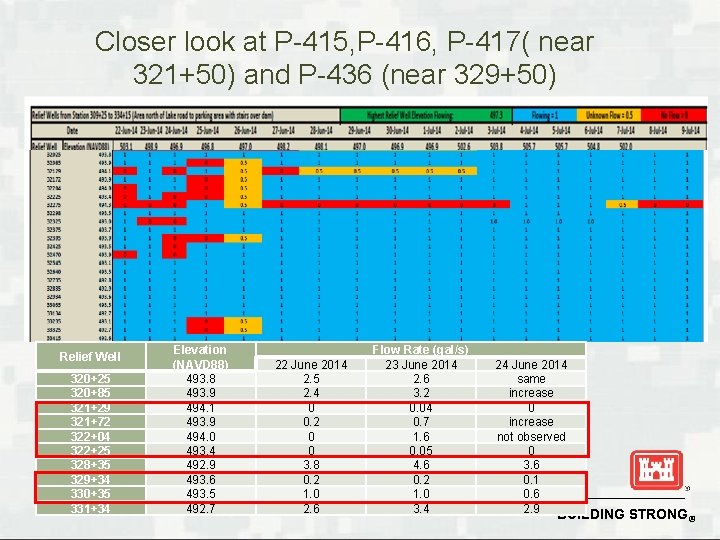
Closer look at P-415, P-416, P-417( near 321+50) and P-436 (near 329+50) Relief Well 320+25 320+85 321+29 321+72 322+04 322+25 328+35 329+34 330+35 331+34 Elevation (NAVD 88) 493. 8 493. 9 494. 1 493. 9 494. 0 493. 4 492. 9 493. 6 493. 5 492. 7 22 June 2014 2. 5 2. 4 0 0. 2 0 0 3. 8 0. 2 1. 0 2. 6 Flow Rate (gal/s) 23 June 2014 2. 6 3. 2 0. 04 0. 7 1. 6 0. 05 4. 6 0. 2 1. 0 3. 4 24 June 2014 same increase 0 increase not observed 0 3. 6 0. 1 0. 6 2. 9 BUILDING STRONG®
Conclusion § The overall elevated uplift pressure was likely due to the back-to-back double-flood conditions. § The 2014 floods, though smaller in magnitude could induce higher uplift pressure than the 1992 record pool due to the back-to-back flooding conditions. § Decommissioning of frost-jacked relief wells in permafrost areas also contributed to the development of artesian pressure and boils. § A few other piezometers that show higher than expected PZ responses are located in areas with limited functioning relief wells. BUILDING STRONG®
Conclusion § Army Corps requires consideration of an antecedent pool when routing the Probable Maximum Flood (PMF). However, the effect of antecedent ground water is usually being overlooked in predicting the ground water level for high pools. § For a site with thick alluvial material, shallow antecedent ground water level and relatively thin surficial silt layer, back–to–back events could induce higher uplift pressure as experienced at MCD. Extrapolation of PZ response based only the single final pool magnitude may likely be underestimated. BUILDING STRONG®