Pie Charts Drawing Complete Lesson Preview the presentation





- Slides: 50
Pie Charts – Drawing – Complete Lesson Preview the presentation to check ability-level, AFL questions, and the animations during demonstrations. It is recommended to delete slides/sections not needed for your class.
Starter A task at the beginning of the lesson that reviews a skill required for the learning. Knowledge Check Questions to assess students’ current understanding and to consequently show progress. Real-Life Example A ‘hook’ to raise interest and provide a concrete example. Demonstration Slides for a teacher to lead students – didactically or via questioning – through a mathematical method. AFL Questions Assessment For Learning Questions, used to assess students’ competency for independent tasks/activities. Plenary An opportunity for students to prove/evaluate their learning.
Printing To print handouts from slides Select the slide from the left. Then click: File > Print > ‘Print Current Slide’ To print multiple slides Click on a section title to highlight all those slides, or press ‘Ctrl’ at the same time as selecting slides to highlight more than one. Then click: File > Print > ‘Print Selection’ To print double-sided handouts Highlight both slides before using ‘Print Selection’. Choose ‘Print on Both Sides’ and ‘Flip on Short Edge’.
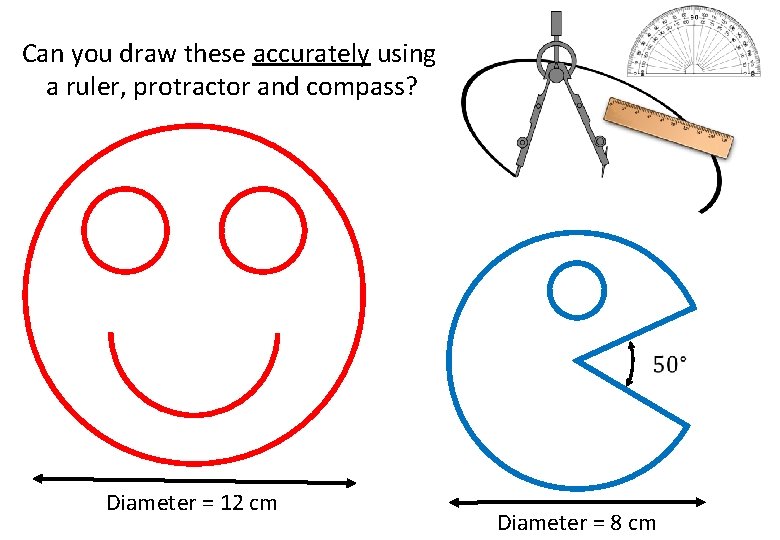
Can you draw these accurately using a ruler, protractor and compass? Diameter = 12 cm Diameter = 8 cm
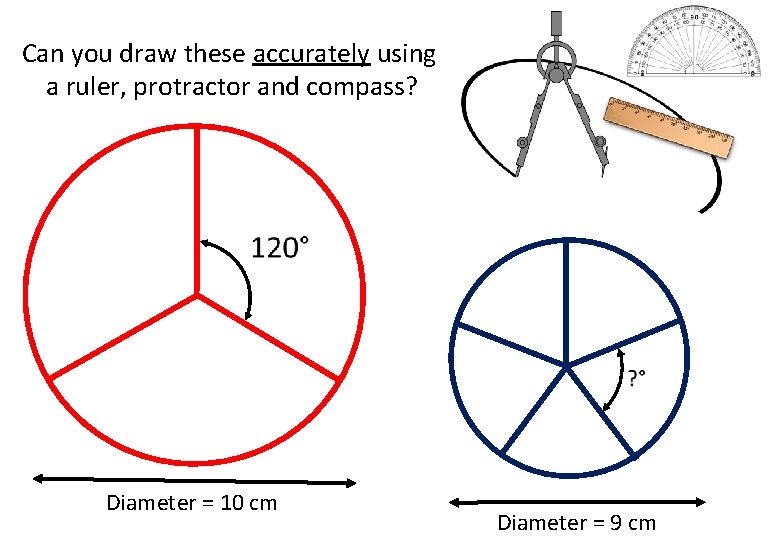
Can you draw these accurately using a ruler, protractor and compass? Diameter = 10 cm Diameter = 9 cm
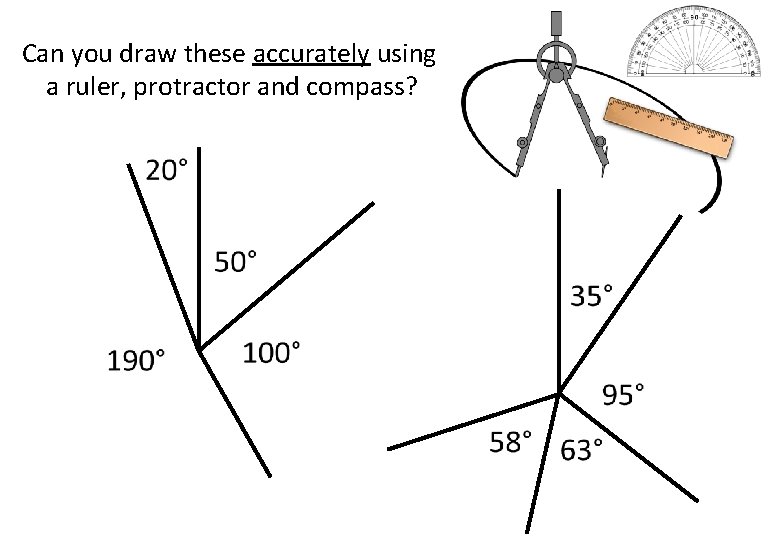
Can you draw these accurately using a ruler, protractor and compass?
March 2021 Drawing Pie Charts
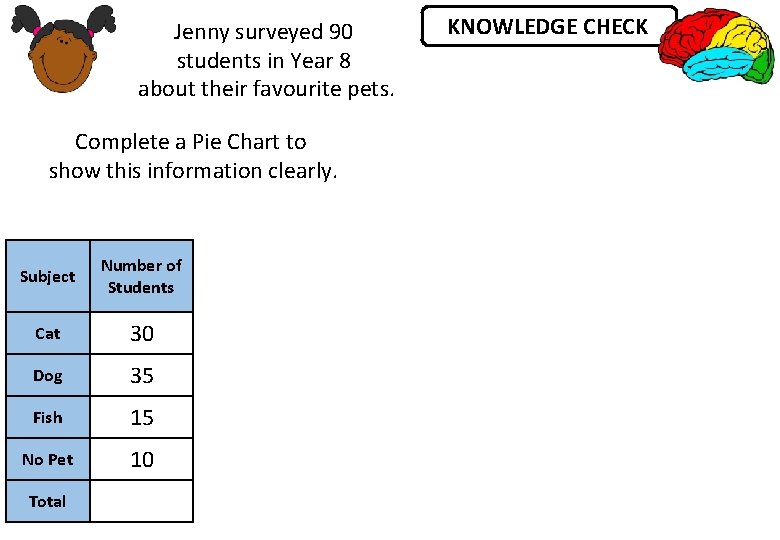
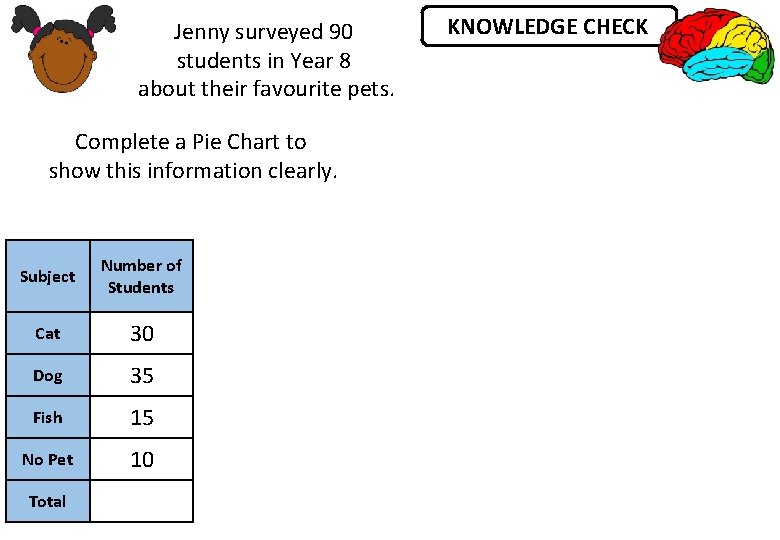
Jenny surveyed 90 students in Year 8 about their favourite pets. Complete a Pie Chart to show this information clearly. Subject Number of Students Cat 30 Dog 35 Fish 15 No Pet 10 Total KNOWLEDGE CHECK
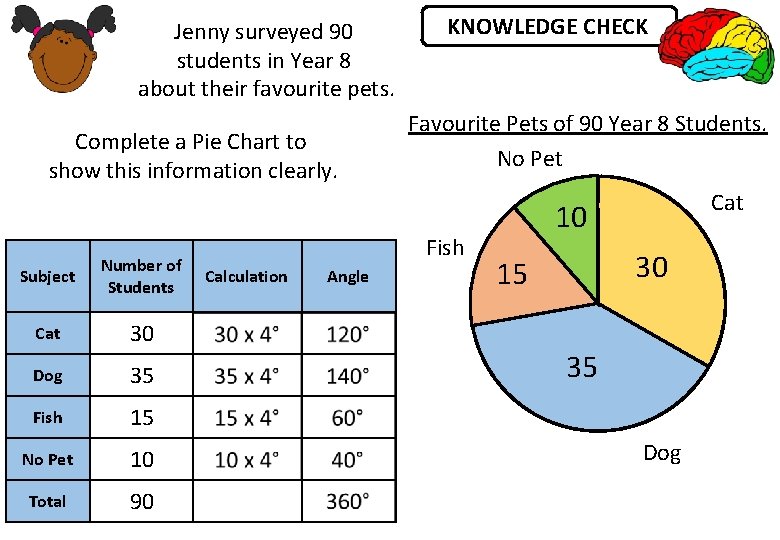
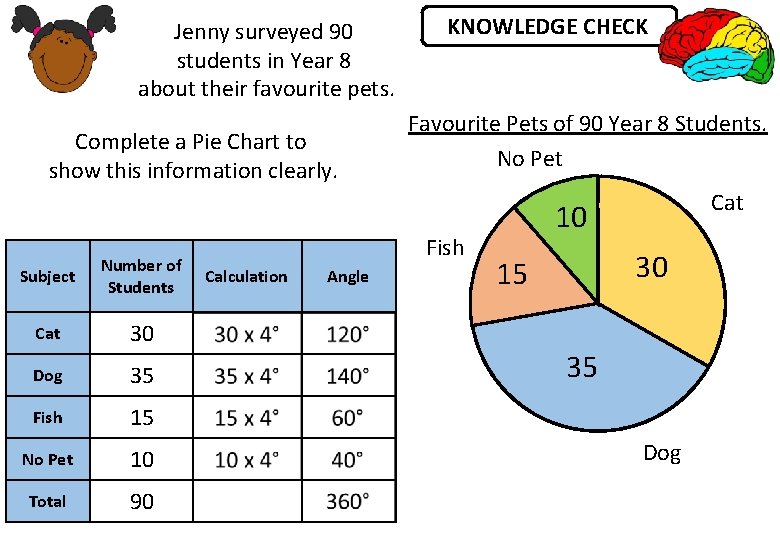
Jenny surveyed 90 students in Year 8 about their favourite pets. Complete a Pie Chart to show this information clearly. Subject Number of Students Cat 30 Dog 35 Fish 15 No Pet 10 Total 90 KNOWLEDGE CHECK Favourite Pets of 90 Year 8 Students. No Pet Fish Calculation Angle Cat 10 30 15 35 Dog
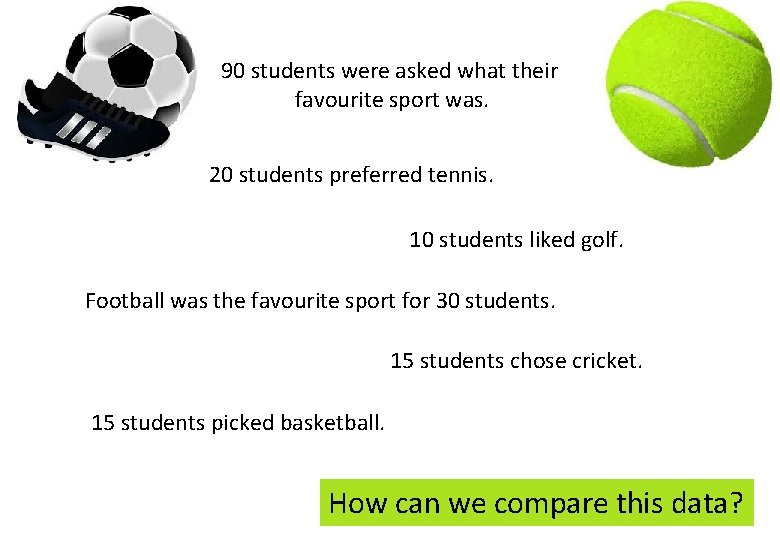
90 students were asked what their favourite sport was. 20 students preferred tennis. 10 students liked golf. Football was the favourite sport for 30 students. 15 students chose cricket. 15 students picked basketball. How can we compare this data?
Bars? Bubbles? 10 10 20 30 15 15
We’ll use a pie!
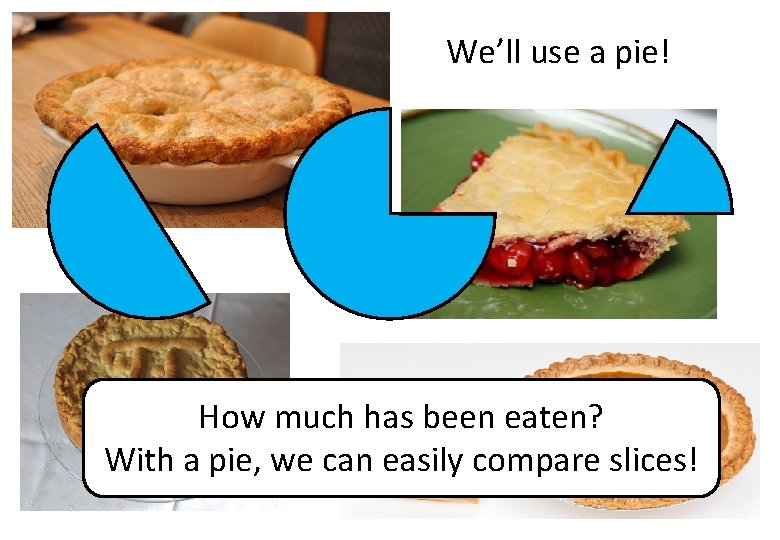
We’ll use a pie! How much has been eaten? With a pie, we can easily compare slices!
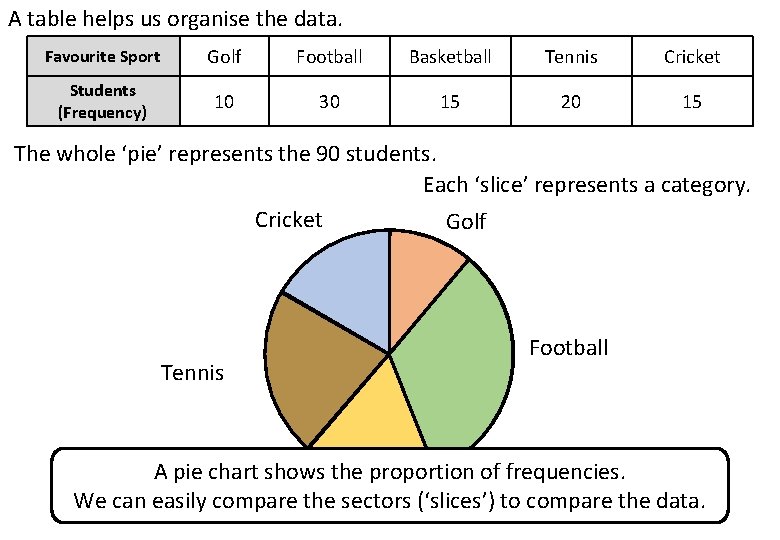
A table helps us organise the data. Favourite Sport Golf Football Basketball Tennis Cricket Students (Frequency) 10 30 15 20 15 The whole ‘pie’ represents the 90 students. Each ‘slice’ represents a category. Cricket Golf Tennis Football A pie chart shows the proportion of frequencies. We can easily compare the sectors (‘slices’) to compare the data. Basketball
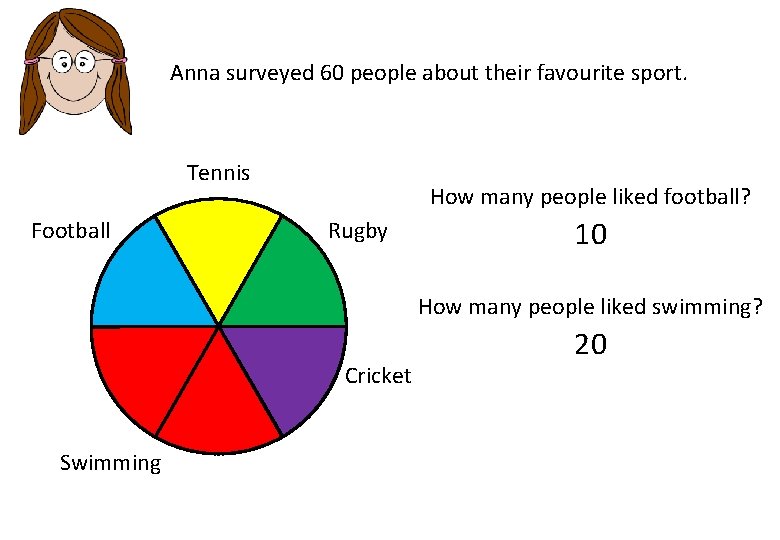
Anna surveyed 60 people about their favourite sport. Tennis Football How many people liked football? Rugby 10 How many people liked swimming? Cricket Swimming 20
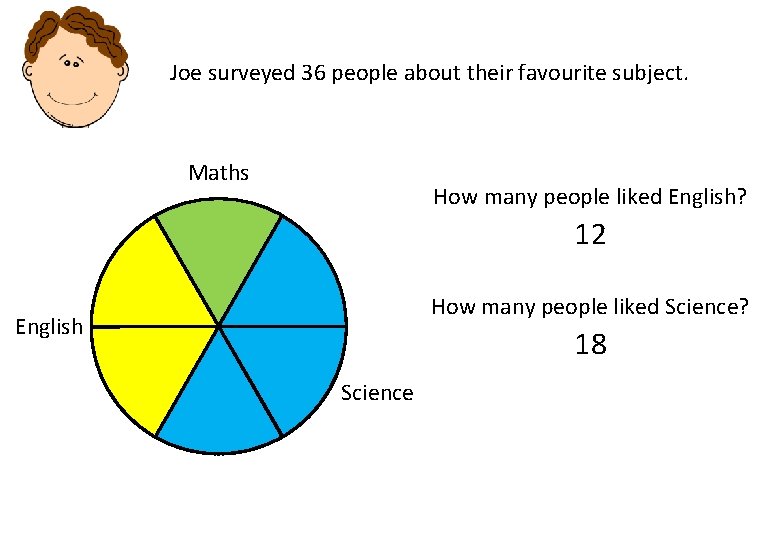
Joe surveyed 36 people about their favourite subject. Maths How many people liked English? 12 How many people liked Science? English 18 Science
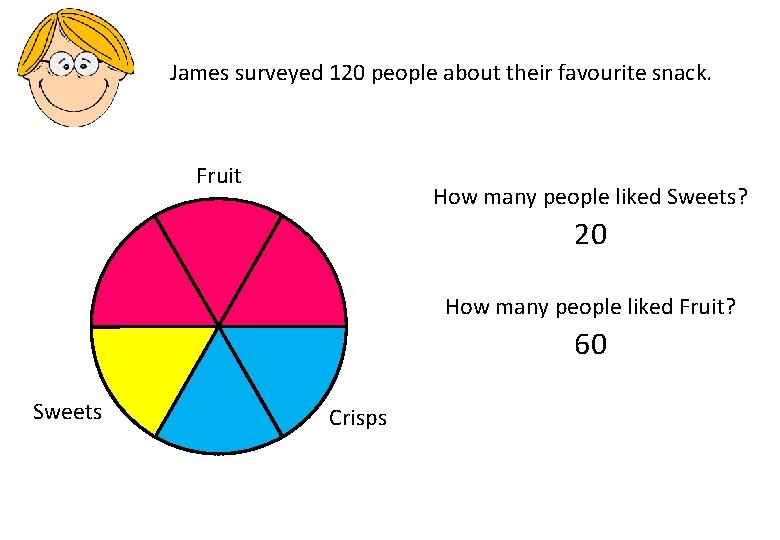
James surveyed 120 people about their favourite snack. Fruit How many people liked Sweets? 20 How many people liked Fruit? 60 Sweets Crisps
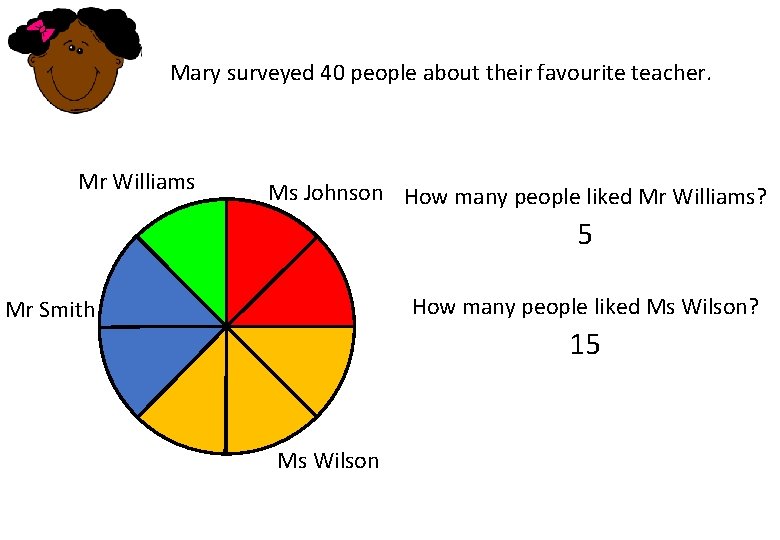
Mary surveyed 40 people about their favourite teacher. Mr Williams Ms Johnson How many people liked Mr Williams? 5 How many people liked Ms Wilson? Mr Smith 15 Ms Wilson
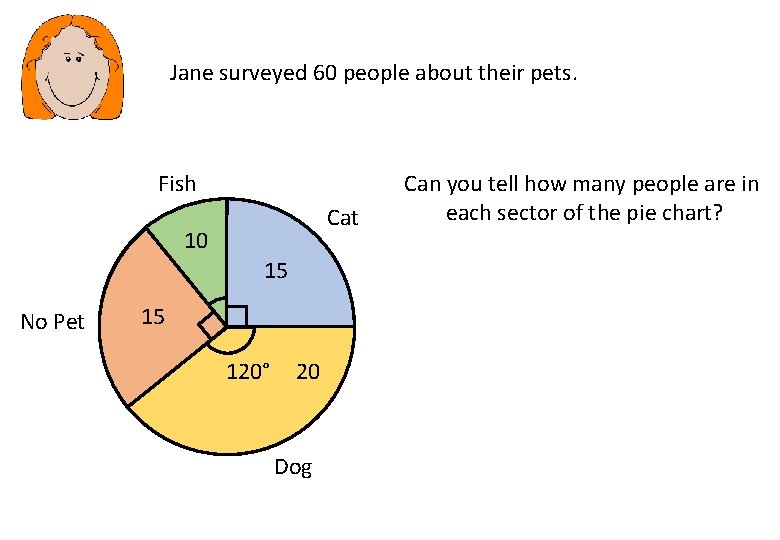
Jane surveyed 60 people about their pets. Fish Cat 10 15 No Pet 15 120° 20 Dog Can you tell how many people are in each sector of the pie chart?
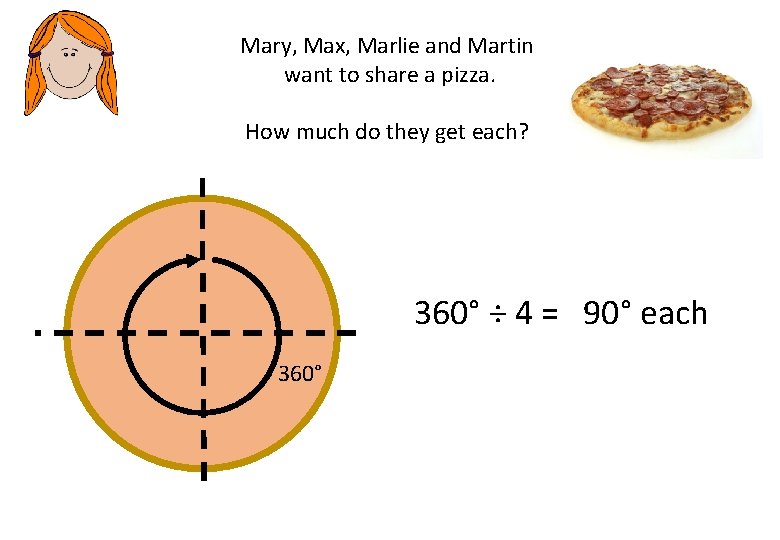
Mary, Max, Marlie and Martin want to share a pizza. How much do they get each? 360° ÷ 4 = 90° each 360°
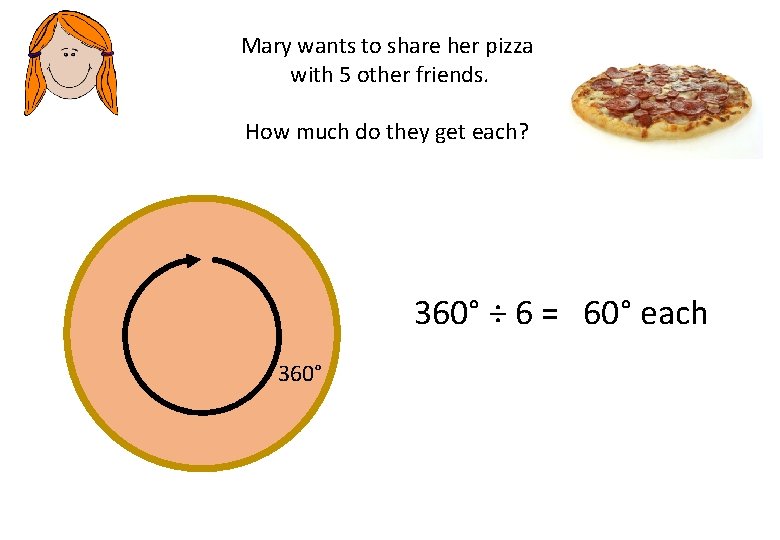
Mary wants to share her pizza with 5 other friends. How much do they get each? 360° ÷ 6 = 60° each 360°
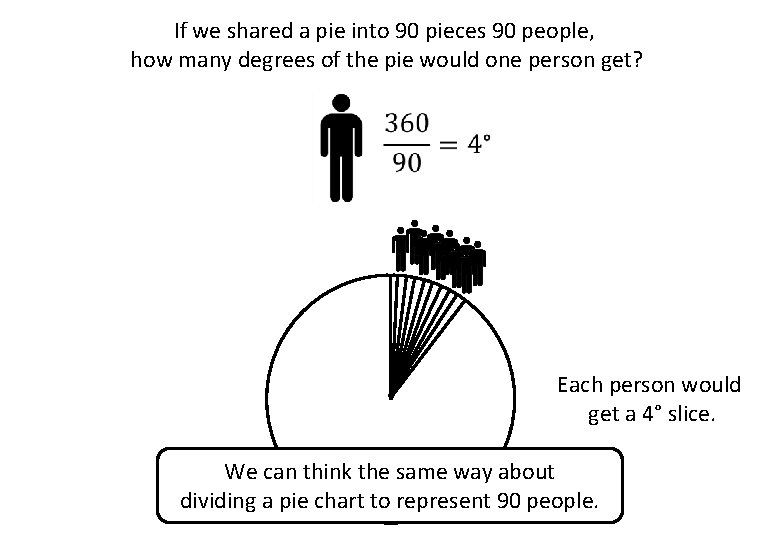
If we shared a pie into 90 pieces 90 people, how many degrees of the pie would one person get? Each person would get a 4° slice. We can think the same way about dividing a pie chart to represent 90 people.
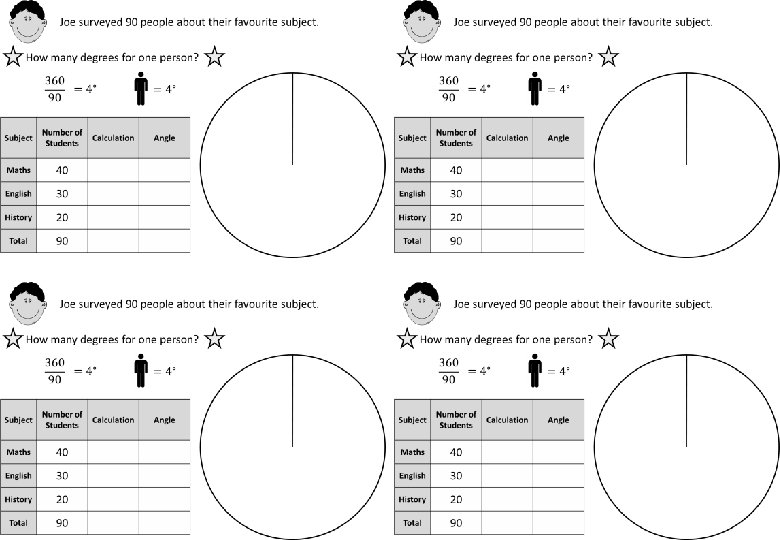
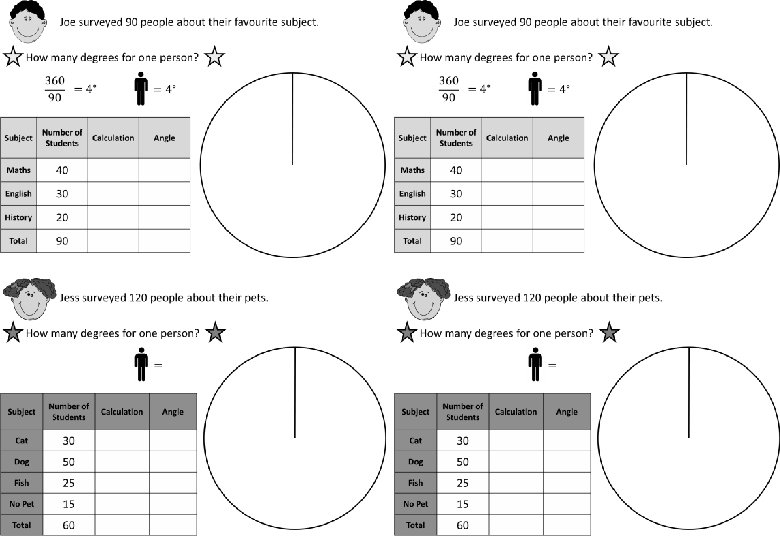
Joe surveyed 90 people about their favourite subject. How many degrees for one person? Subject Number of Students Maths 40 English 30 History 20 Total 90 History Maths 20 Calculation Angle 30 English 40
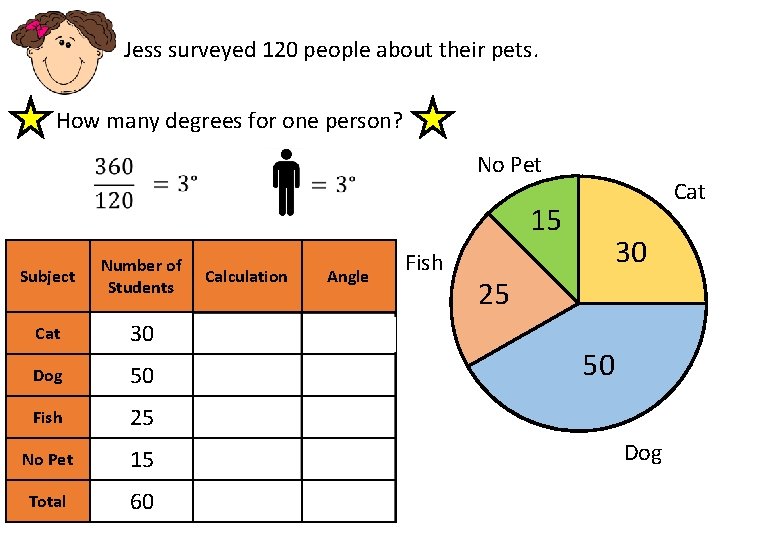
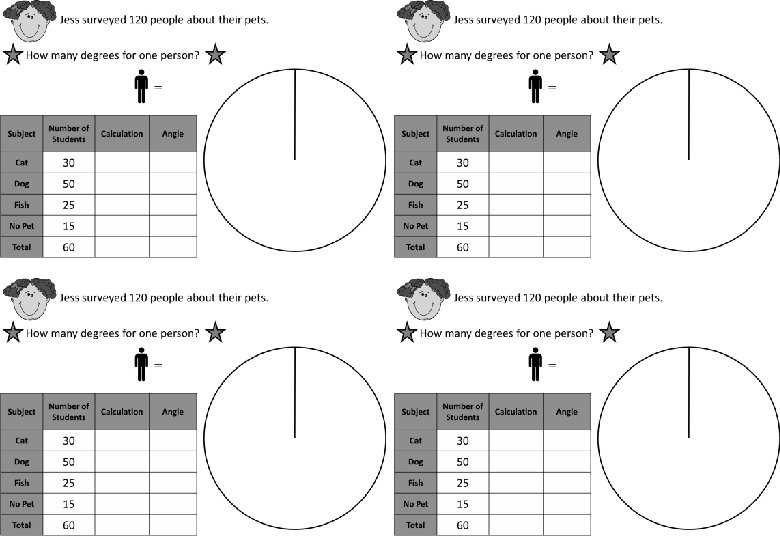
Jess surveyed 120 people about their pets. How many degrees for one person? No Pet 15 Subject Number of Students Cat 30 Dog 50 Fish 25 No Pet 15 Total 60 Calculation Angle Fish Cat 30 25 50 Dog
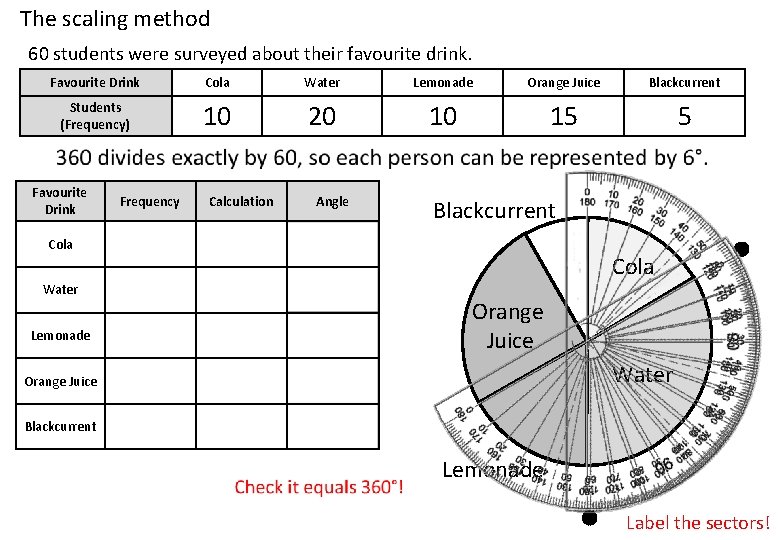
The scaling method 60 students were surveyed about their favourite drink. Favourite Drink Cola Water Lemonade Orange Juice Blackcurrent Students (Frequency) 10 20 10 15 5 Favourite Drink Frequency Calculation Cola 10 10 × 6 Water 20 20 × 6 Lemonade 10 10 × 6 Orange Juice 15 15 × 6 Blackcurrent 5 5 × 6 Angle Blackcurrent Cola Orange Juice Water Lemonade Label the sectors!
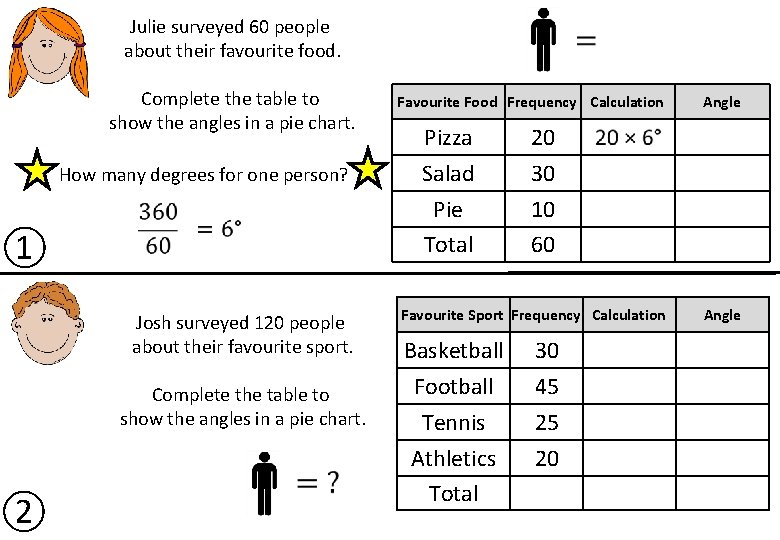
Julie surveyed 60 people about their favourite food. Complete the table to show the angles in a pie chart. How many degrees for one person? ① Josh surveyed 120 people about their favourite sport. Complete the table to show the angles in a pie chart. ② Favourite Food Frequency Calculation Pizza Salad Pie Total Angle 20 30 10 60 Favourite Sport Frequency Calculation Basketball Football Tennis 30 45 25 Athletics Total 20 Angle
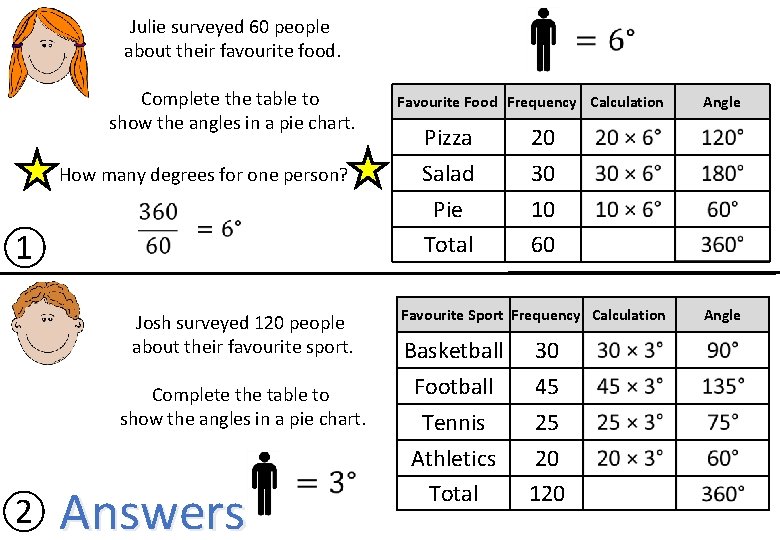
Julie surveyed 60 people about their favourite food. Complete the table to show the angles in a pie chart. How many degrees for one person? ① Josh surveyed 120 people about their favourite sport. Complete the table to show the angles in a pie chart. ② Answers Favourite Food Frequency Calculation Pizza Salad Pie Total Angle 20 30 10 60 Favourite Sport Frequency Calculation Basketball Football Tennis 30 45 25 Athletics Total 20 120 Angle
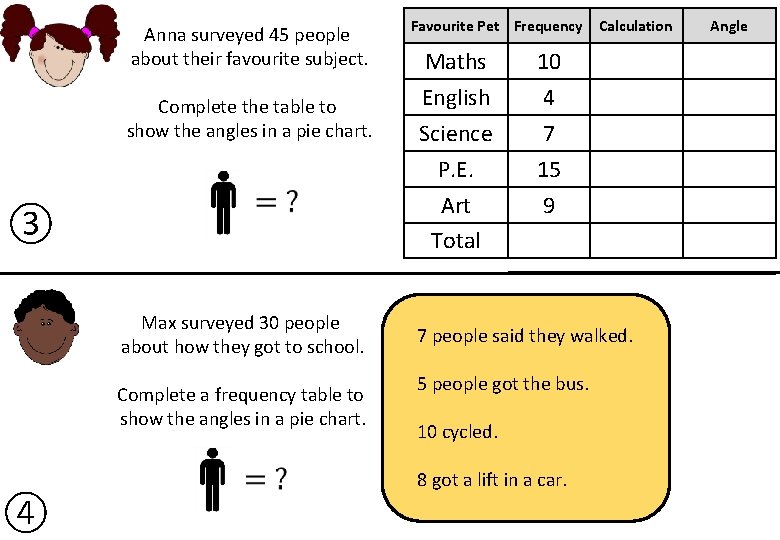
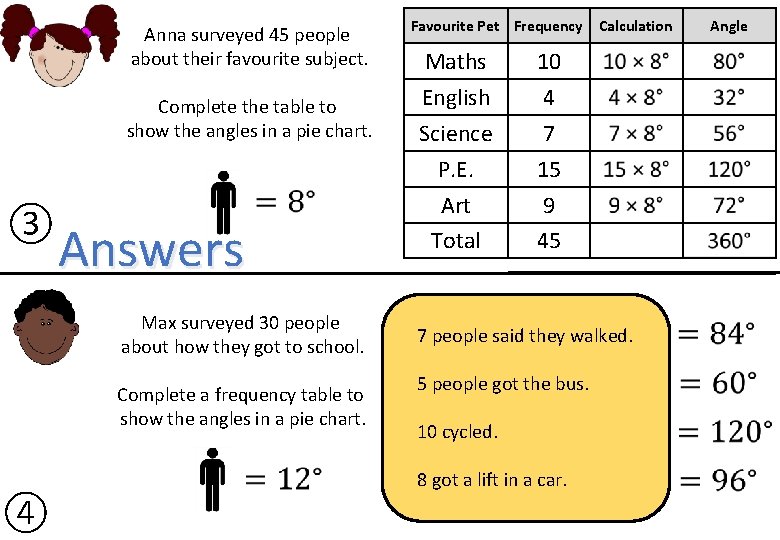
Anna surveyed 45 people about their favourite subject. Complete the table to show the angles in a pie chart. ③ Max surveyed 30 people about how they got to school. Complete a frequency table to show the angles in a pie chart. ④ Favourite Pet Frequency Calculation Maths English Science P. E. Art Total 10 4 7 15 9 7 people said they walked. 5 people got the bus. 10 cycled. 8 got a lift in a car. Angle
Anna surveyed 45 people about their favourite subject. Complete the table to show the angles in a pie chart. ③ Answers Max surveyed 30 people about how they got to school. Complete a frequency table to show the angles in a pie chart. ④ Favourite Pet Frequency Calculation Maths English Science P. E. Art Total Angle 10 4 7 15 9 45 7 people said they walked. 5 people got the bus. 10 cycled. 8 got a lift in a car.
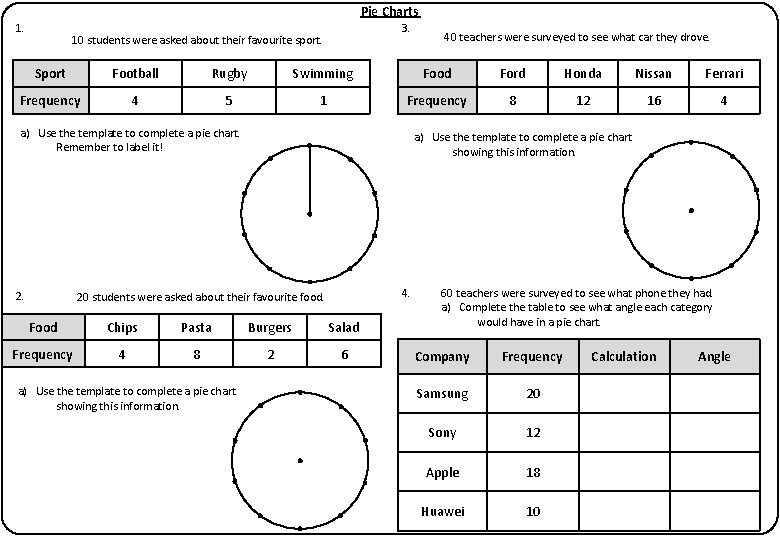
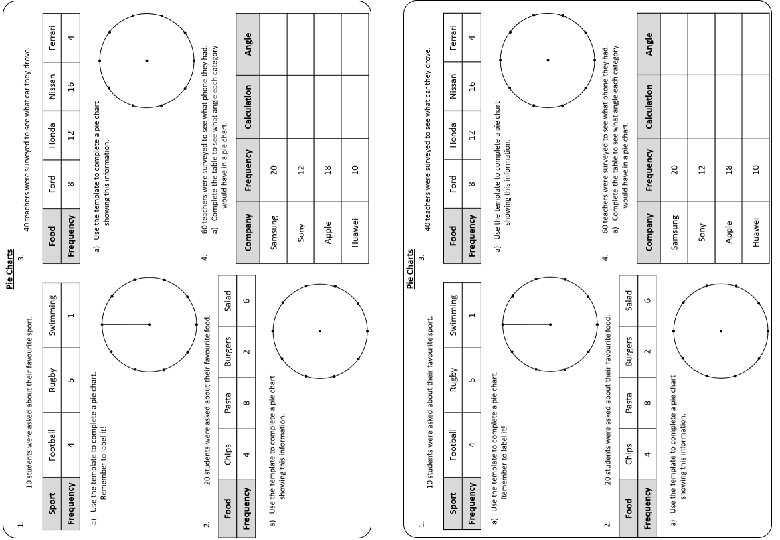
Pie Charts 1. 3. 10 students were asked about their favourite sport. 40 teachers were surveyed to see what car they drove. Sport Football Rugby Swimming Food Ford Honda Nissan Ferrari Frequency 4 5 1 Frequency 8 12 16 4 a) Use the template to complete a pie chart. Remember to label it! 2. a) Use the template to complete a pie chart showing this information. 4. 20 students were asked about their favourite food. Food Chips Pasta Burgers Salad Frequency 4 8 2 6 a) Use the template to complete a pie chart showing this information. 60 teachers were surveyed to see what phone they had. a) Complete the table to see what angle each category would have in a pie chart. Company Frequency Samsung 20 Sony 12 Apple 18 Huawei 10 Calculation Angle
Pie Charts 1. 3. 10 students were asked about their favourite sport. 40 teachers were surveyed to see what car they drove. Sport Football Rugby Swimming Food Ford Honda Nissan Ferrari Frequency 4 5 1 Frequency 8 12 16 4 a) Use the template to complete a pie chart. Remember to label it! a) Use the template to complete a pie chart showing this information. Ferrari Ford Answers 2. Swimming Football Nissan Rugby 4. 20 students were asked about their favourite food. Food Chips Pasta Burgers Salad Frequency 4 8 2 6 a) Use the template to complete a pie chart showing this information. Salad Chips Pasta Burgers Honda 60 teachers were surveyed to see what phone they had. a) Complete the table to see what angle each category would have in a pie chart. Company Frequency Samsung 20 Sony 12 Apple 18 Huawei 10 Calculation Angle
Pie Charts
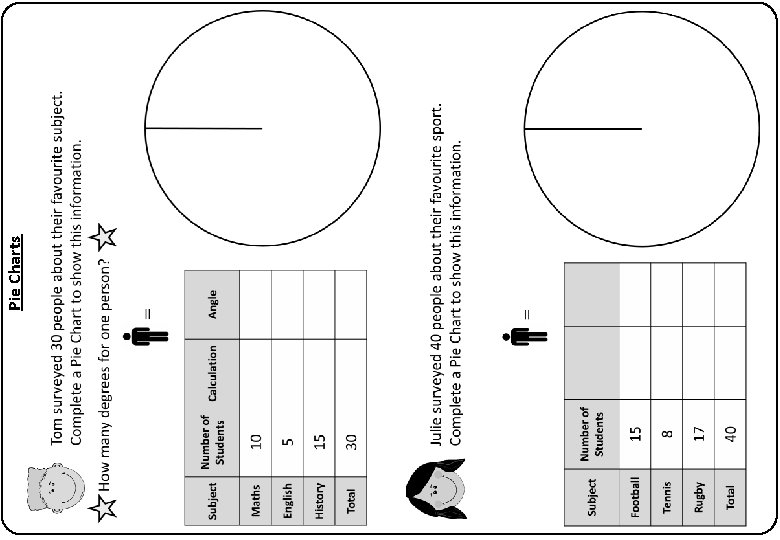
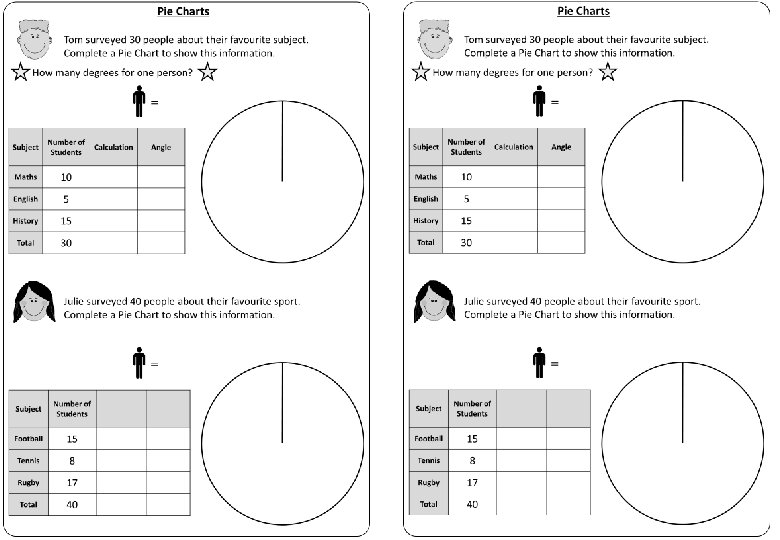
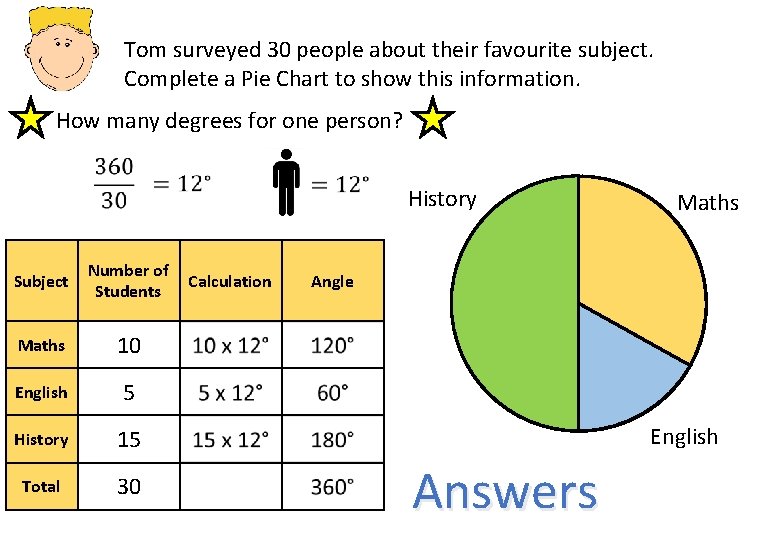
Tom surveyed 30 people about their favourite subject. Complete a Pie Chart to show this information. How many degrees for one person? Subject Number of Students Maths 10 English 5 History 15 Total 30 Calculation History Maths Angle English Answers
Julie surveyed 40 people about their favourite sport. Complete a Pie Chart to show this information. How many degrees for one person? Subject Number of Students Football 15 Tennis 8 Rugby 17 Total 40 Rugby Calculation Football Angle Tennis Answers
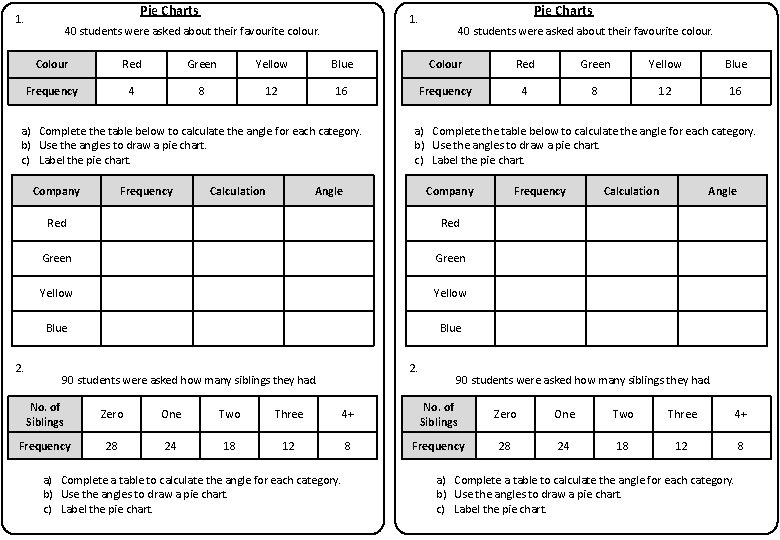
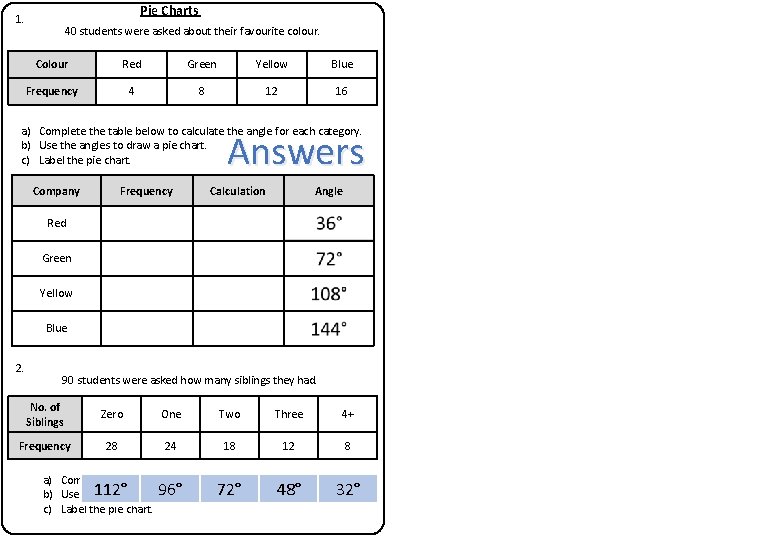
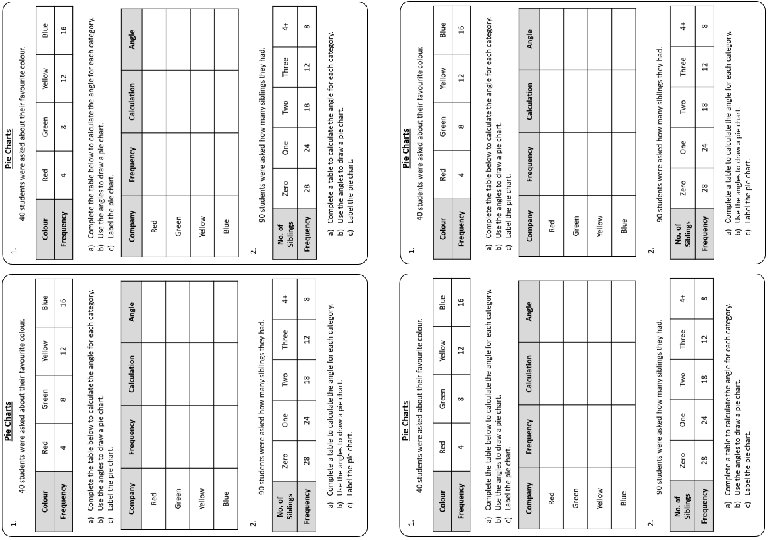
Pie Charts 1. 40 students were asked about their favourite colour. Colour Red Green Yellow Blue Frequency 4 8 12 16 a) Complete the table below to calculate the angle for each category. b) Use the angles to draw a pie chart. c) Label the pie chart. Company 2. Pie Charts 1. Frequency Calculation a) Complete the table below to calculate the angle for each category. b) Use the angles to draw a pie chart. c) Label the pie chart. Angle Company Red Green Yellow Blue 2. 90 students were asked how many siblings they had. Frequency Calculation Angle 90 students were asked how many siblings they had. No. of Siblings Zero One Two Three 4+ Frequency 28 24 18 12 8 a) Complete a table to calculate the angle for each category. b) Use the angles to draw a pie chart. c) Label the pie chart.
Pie Charts 1. 40 students were asked about their favourite colour. Colour Red Green Yellow Blue Frequency 4 8 12 16 a) Complete the table below to calculate the angle for each category. b) Use the angles to draw a pie chart. c) Label the pie chart. Answers Company Frequency Calculation Angle Red Green Yellow Blue 2. 90 students were asked how many siblings they had. No. of Siblings Zero One Two Three 4+ Frequency 28 24 18 12 8 a) Complete a table to calculate the angle for each category. 112° 96° 72° 48° 32° b) Use the angles to draw a pie chart. c) Label the pie chart.
Jenny surveyed 90 students in Year 8 about their favourite pets. Complete a Pie Chart to show this information clearly. Subject Number of Students Cat 30 Dog 35 Fish 15 No Pet 10 Total KNOWLEDGE CHECK
Jenny surveyed 90 students in Year 8 about their favourite pets. Complete a Pie Chart to show this information clearly. Subject Number of Students Cat 30 Dog 35 Fish 15 No Pet 10 Total 90 KNOWLEDGE CHECK Favourite Pets of 90 Year 8 Students. No Pet Fish Calculation Angle Cat 10 30 15 35 Dog
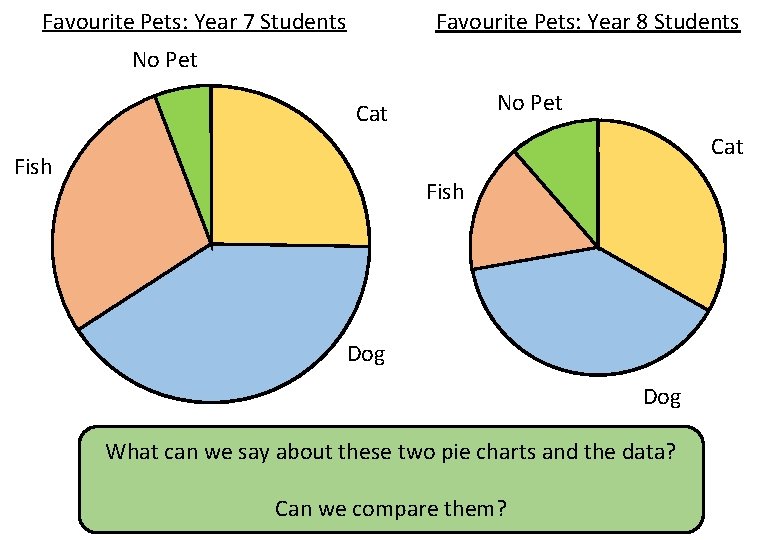
Favourite Pets: Year 7 Students Favourite Pets: Year 8 Students No Pet Cat Fish Dog What can we say about these two pie charts and the data? Can we compare them?
Check your success! I can complete a table to show the angles for categories in a pie chart. I can draw a pie chart using values. I can draw a pie chart from a frequency table.
Check your success! I can complete a table to show the angles for categories. I can draw a pie chart using values. I can draw a pie chart from a frequency table.
Write a text message to a friend describing… How to draw a pie chart for a survey of 60 people.
Questions? Comments? Suggestions? …or have you found a mistake!? Any feedback would be appreciated . Please feel free to email: tom@goteachmaths. co. uk