Picturing Motion Dot Diagrams If you related the


- Slides: 20
Picturing Motion: Dot Diagrams • If you related the position of the runner to the background in each frame taken in 1 second intervals, you would conclude that the student is in motion. • This series of images, taken at regular intervals, creates a motion diagram for the change in the student’s state of motion.
• Roll a ball along a horizontal surface, and its velocity is constant because no component of gravitational force acts horizontally • Drop it, and it accelerates downward and covers greater vertical distances each second.
Ø Freefall • The rate at which the velocity changes each second is the same whether the ball is going upward or downward. + -
By noting the distance the object moves in equal time intervals, you can determine the object’s state of motion • A: at rest • B: moving at a constant speed • C: speeding up • D: slowing down.
Use a dot motion diagram model to draw simplified motion diagrams • A: at rest • B: moving at a constant speed • C: speeding up • D: slowing down.
• Use the dot diagram model to draw a motion diagram for an object moving at a constant speed. • Use the dot diagram model to draw a motion diagram for an object starting at rest and speeding up. • Use the dot diagram model to draw a motion diagram for an object that starts from rest, speeds up to a constant speed, and then slows to a stop.
• Use the dot diagram model to draw a motion diagram for a wheel turning at a constant speed. First place the dot at the hub of the wheel. What would the diagram look like if the dot were placed on the rim of the wheel?
Dot Diagrams & Vector Quantities • To determine displacement, velocity, and acceleration, a coordinate system must be specified. • Normally the positive values of x extend horizontally to the right, and the positive values of y extend vertically upward.
• The sign of the average velocity depends upon the chosen coordinate system. The coordinate systems in a and b are equally correct
• Color Conventions – Displacement vectors are green. – Velocity vectors are red. – Accelerations vectors are violet
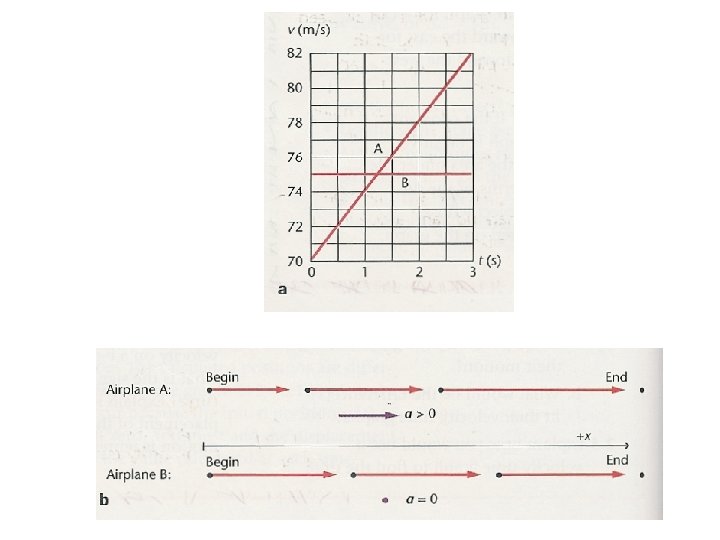
Graphs and motion diagrams are useful in differentiating constant motion and motion that is accelerated. • A speed-versus-time graph • A distance-versus-time graph
• The sign of the acceleration depends upon the chosen coordinate system. • Ex: a ball being rolled up an inclined driveway
Ø 1. 2. 3. 4. 5. 6. Refer to the motion graph below to find The time interval(s) for positive acceleration The time interval(s) for negative acceleration The time interval(s) for constant velocity The time interval(s) for zero acceleration At what time(s) does the car appear to be at rest? At what time(s) does the car turn around and move in the opposite direction?