Moving From Correlative Science to Predictive Medicine Richard





- Slides: 62
Moving From Correlative Science to Predictive Medicine Richard Simon, D. Sc. Chief, Biometric Research Branch National Cancer Institute http: //linus. nci. nih. gov
“Biomarkers” • Surrogate endpoints – Of treatment effect – Of patient benefit • Prognostic marker – Pre-treatment measurement correlated with long-term outcome • Predictive classifier – A measurement made before treatment to predict whether a particular treatment is likely to be beneficial
Surrogate Endpoints • It is extremely difficult to properly validate a biomarker as a surrogate for clinical benefit. – It requires a series of randomized trials with both the candidate biomarker and clinical outcome measured
Surrogate Endpoints • Biomarkers of treatment effect can be useful in phase I/II studies as indicators of treatment effect and need not be validated as surrogates for clinical benefit.
Predictive Classifiers • Most cancer treatments benefit only a minority of patients to whom they are administered – Particularly true for molecularly targeted drugs • Being able to predict which patients are likely to benefit would – save patients from unnecessary toxicity, and enhance their chance of receiving a drug that helps them – Help control medical costs – Improve the efficiency of clinical drug development
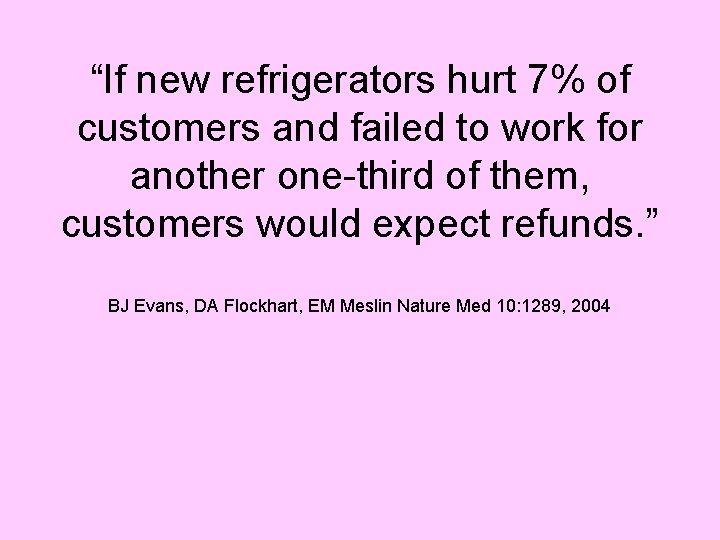
“If new refrigerators hurt 7% of customers and failed to work for another one-third of them, customers would expect refunds. ” BJ Evans, DA Flockhart, EM Meslin Nature Med 10: 1289, 2004
Prognostic Factors can Sometimes Have Therapeutic Relevance • Oncotype. Dx • Many prognostic factor studies use a convenience sample of patients for whom tissue is available. Generally the patients are too heterogeneous to support therapeutically relevant conclusions
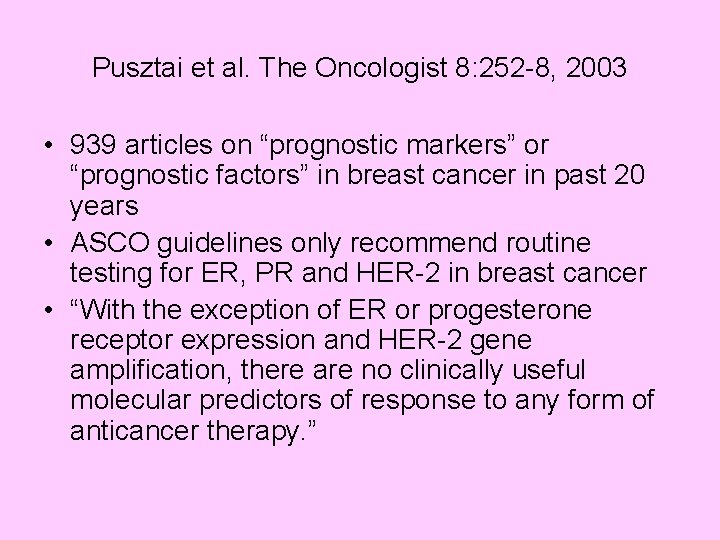
Pusztai et al. The Oncologist 8: 252 -8, 2003 • 939 articles on “prognostic markers” or “prognostic factors” in breast cancer in past 20 years • ASCO guidelines only recommend routine testing for ER, PR and HER-2 in breast cancer • “With the exception of ER or progesterone receptor expression and HER-2 gene amplification, there are no clinically useful molecular predictors of response to any form of anticancer therapy. ”
Predictive Classifiers • Classifier = Mapping from biomarker values to predictive categories • Predictive classifier is used broadly to include classifier based on gene expression profiles or serum protein profiles
Predictive Classifiers • In new drug development, the role of a predictive classifier is to select a target population for treatment – The focus should be on evaluating the new drug in a population prospectively defined by a predictive classifier
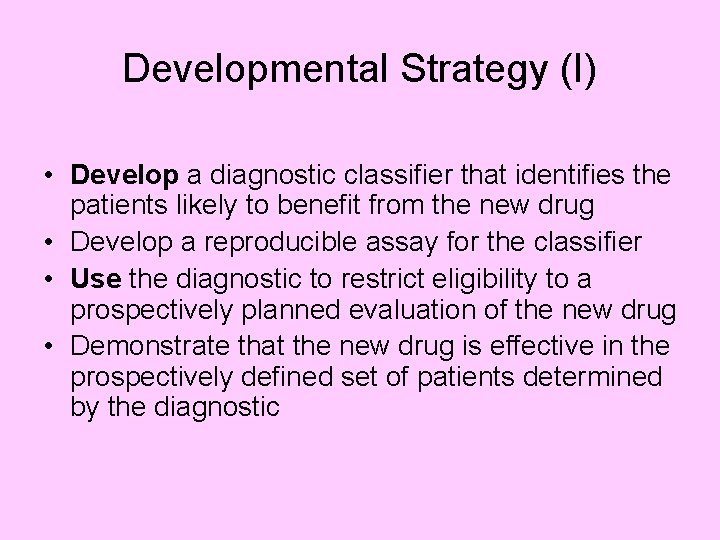
Developmental Strategy (I) • Develop a diagnostic classifier that identifies the patients likely to benefit from the new drug • Develop a reproducible assay for the classifier • Use the diagnostic to restrict eligibility to a prospectively planned evaluation of the new drug • Demonstrate that the new drug is effective in the prospectively defined set of patients determined by the diagnostic
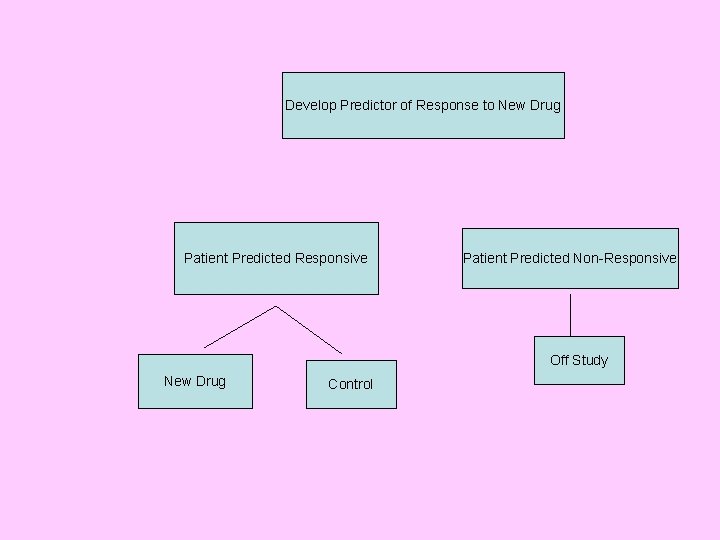
Using phase II data, develop predictor of response to new drugto New Drug Develop Predictor of Response Patient Predicted Responsive Patient Predicted Non-Responsive Off Study New Drug Control
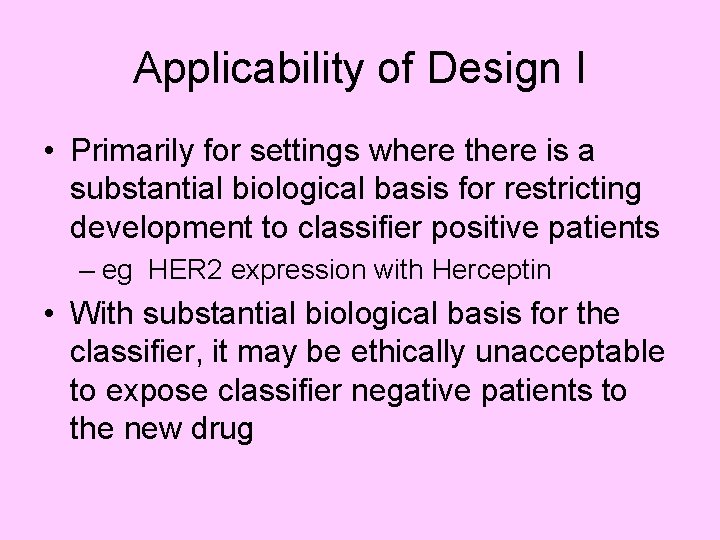
Applicability of Design I • Primarily for settings where there is a substantial biological basis for restricting development to classifier positive patients – eg HER 2 expression with Herceptin • With substantial biological basis for the classifier, it may be ethically unacceptable to expose classifier negative patients to the new drug
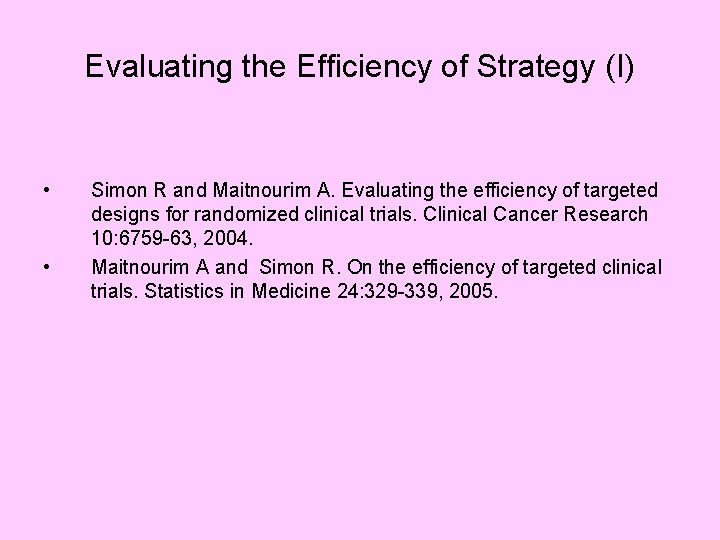
Evaluating the Efficiency of Strategy (I) • • Simon R and Maitnourim A. Evaluating the efficiency of targeted designs for randomized clinical trials. Clinical Cancer Research 10: 6759 -63, 2004. Maitnourim A and Simon R. On the efficiency of targeted clinical trials. Statistics in Medicine 24: 329 -339, 2005.
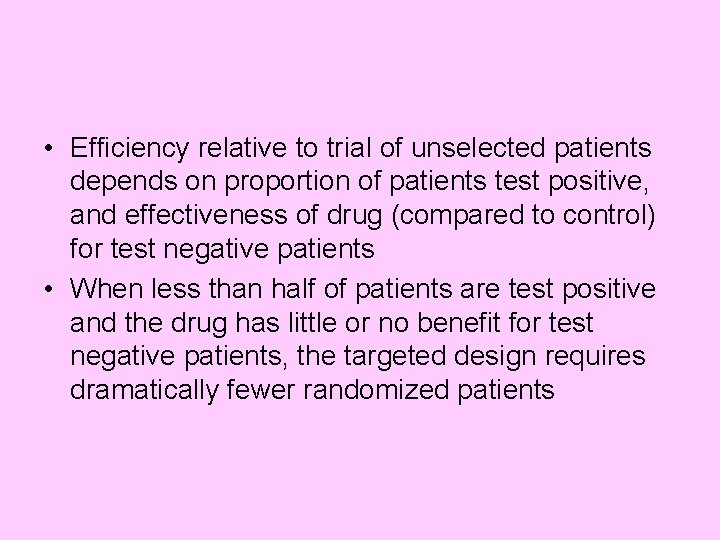
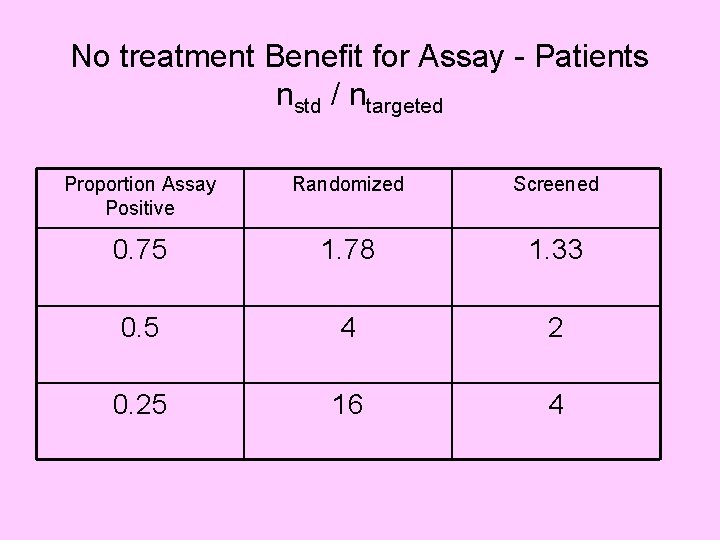
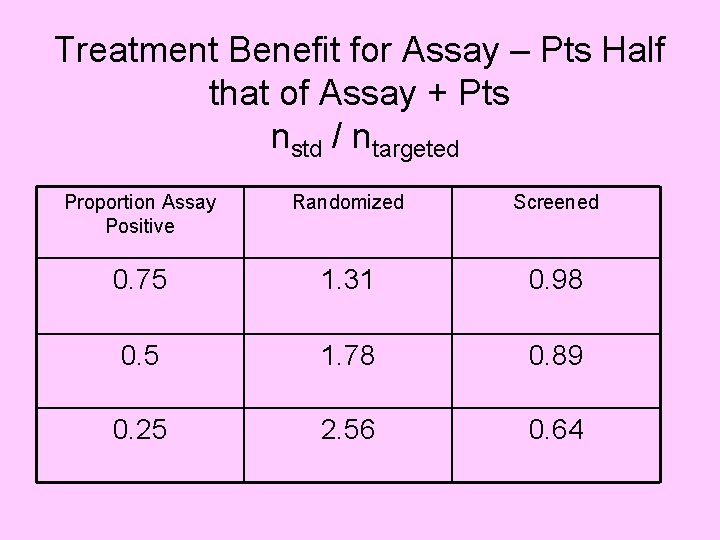
• Efficiency relative to trial of unselected patients depends on proportion of patients test positive, and effectiveness of drug (compared to control) for test negative patients • When less than half of patients are test positive and the drug has little or no benefit for test negative patients, the targeted design requires dramatically fewer randomized patients
No treatment Benefit for Assay - Patients nstd / ntargeted Proportion Assay Positive Randomized Screened 0. 75 1. 78 1. 33 0. 5 4 2 0. 25 16 4
Treatment Benefit for Assay – Pts Half that of Assay + Pts nstd / ntargeted Proportion Assay Positive Randomized Screened 0. 75 1. 31 0. 98 0. 5 1. 78 0. 89 0. 25 2. 56 0. 64
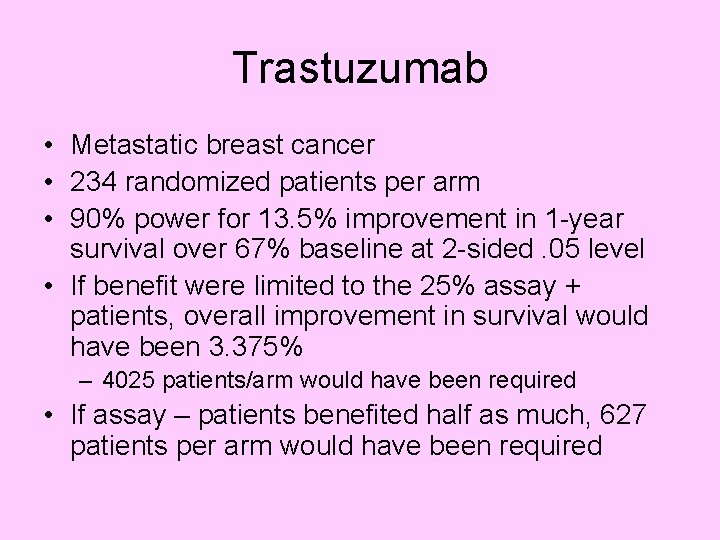
Trastuzumab • Metastatic breast cancer • 234 randomized patients per arm • 90% power for 13. 5% improvement in 1 -year survival over 67% baseline at 2 -sided. 05 level • If benefit were limited to the 25% assay + patients, overall improvement in survival would have been 3. 375% – 4025 patients/arm would have been required • If assay – patients benefited half as much, 627 patients per arm would have been required
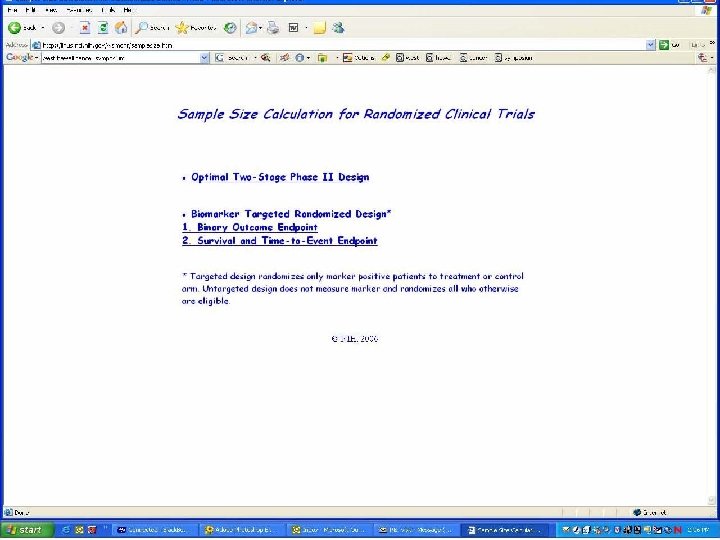
Interactive Software for Evaluating a Targeted Design • http: //linus. nci. nih. gov
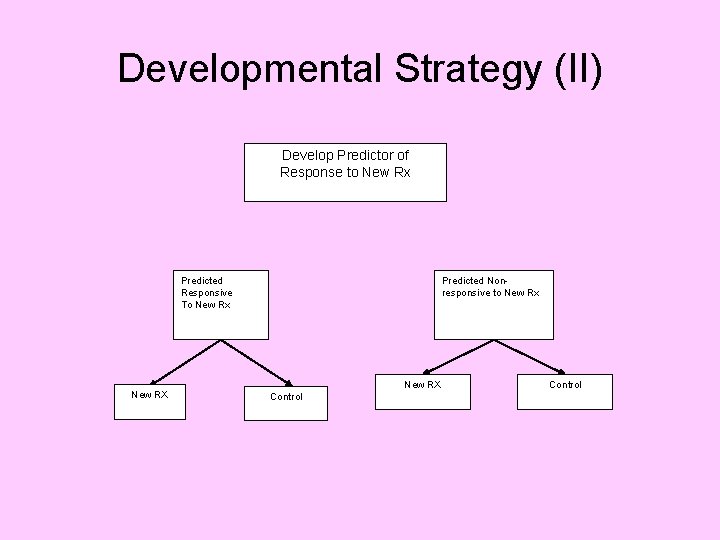
Developmental Strategy (II) Develop Predictor of Response to New Rx Predicted Responsive To New Rx New RX Predicted Nonresponsive to New Rx New RX Control
Developmental Strategy (II) • Do not use the diagnostic to restrict eligibility, but to structure a prospective analysis plan. • Compare the new drug to the control for classifier positive patients – If p+>0. 05 make no claim of effectiveness – If p+ 0. 05 claim effectiveness for the classifier positive patients and • Continue accrual of classifier negative patients and eventually test treatment effect at 0. 05 level
Developmental Strategy (IIb) • Do not use the diagnostic to restrict eligibility, but to structure a prospective analysis plan. • Compare the new drug to the control overall for all patients ignoring the classifier. – If poverall 0. 04 claim effectiveness for the eligible population as a whole • Otherwise perform a single subset analysis evaluating the new drug in the classifier + patients – If psubset 0. 01 claim effectiveness for the classifier + patients.
Key Features of Design (II) • The purpose of the RCT is to evaluate treatment T vs C overall and for the predefined subset; not to re-evaluate the components of the classifier, or to modify or refine the classifier
The Roadmap 1. Develop a completely specified genomic classifier of the patients likely to benefit from a new drug 2. Establish reproducibility of measurement of the classifier 3. Use the completely specified classifier to design and analyze a new clinical trial to evaluate effectiveness of the new treatment with a pre-defined analysis plan.
Guiding Principle • The data used to develop the classifier must be distinct from the data used to test hypotheses about treatment effect in subsets determined by the classifier – Developmental studies are exploratory – Studies on which treatment effectiveness claims are to be based should be definitive studies that test a treatment hypothesis in a patient population completely pre-specified by the classifier
Use of Archived Samples • From a non-targeted “negative” clinical trial to develop a binary classifier of a subset thought to benefit from treatment • Test that subset hypothesis in a separate clinical trial – Prospective targeted type (I) trial – Using archived specimens from a second previously conducted clinical trial
Development of Genomic Classifiers • Single gene or protein based on knowledge of therapeutic target • Single gene or protein culled from set of candidate genes identified based on imperfect knowledge of therapeutic target • Empirically determined based on correlating gene expression to patient outcome after treatment
Use of DNA Microarray Expression Profiling • For settings where you don’t know how to identify the patients likely to be responsive to the new treatment based on its mechanism of action • Only pre-treatment specimens are needed
Development of Genomic Classifiers • During phase II development or • After failed phase III trial using archived specimens. • Adaptively during early portion of phase III trial.
Adaptive Signature Design An adaptive design for generating and prospectively testing a gene expression signature for sensitive patients Boris Freidlin and Richard Simon Clinical Cancer Research 11: 7872 -8, 2005
Biomarker Adaptive Threshold Design Wenyu Jiang, Boris Freidlin & Richard Simon JNCI 99: 1036 -43, 2007
Biomarker Adaptive Threshold Design • Randomized phase III trial comparing new treatment E to control C • Survival or DFS endpoint
Biomarker Adaptive Threshold Design • Have identified a predictive index B thought to be predictive of patients likely to benefit from E relative to C • Eligibility not restricted by biomarker • No threshold for biomarker determined
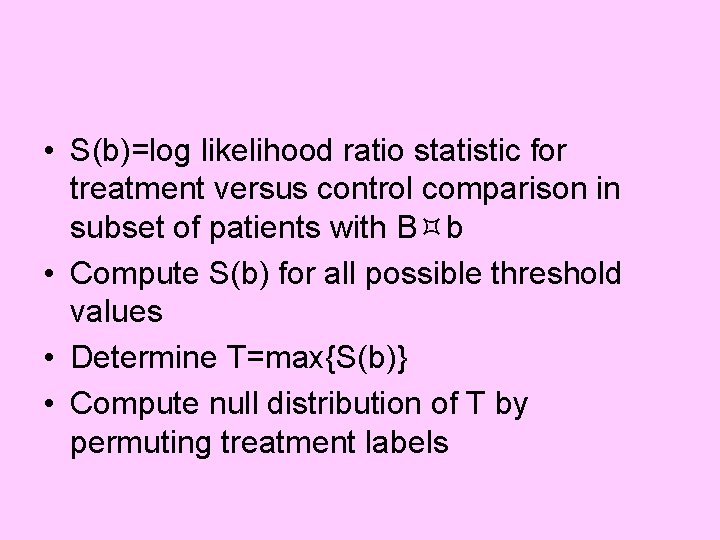
• S(b)=log likelihood ratio statistic for treatment versus control comparison in subset of patients with B b • Compute S(b) for all possible threshold values • Determine T=max{S(b)} • Compute null distribution of T by permuting treatment labels
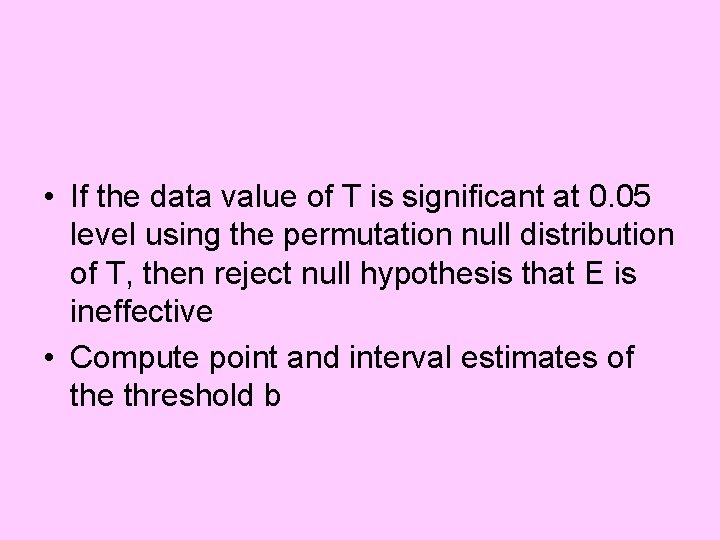
• If the data value of T is significant at 0. 05 level using the permutation null distribution of T, then reject null hypothesis that E is ineffective • Compute point and interval estimates of the threshold b
Myths about the Development of Predictive Classifiers using Gene Expression Profiles
Myth-1 • Microarray studies are exploratory with no hypotheses or objectives
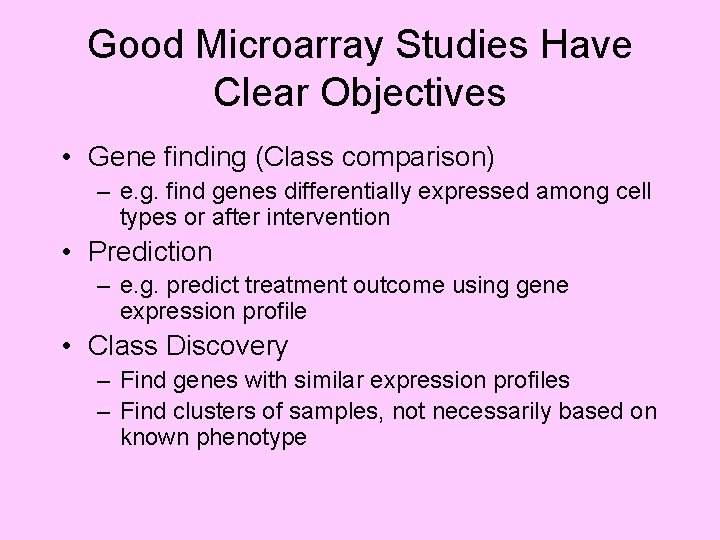
Good Microarray Studies Have Clear Objectives • Gene finding (Class comparison) – e. g. find genes differentially expressed among cell types or after intervention • Prediction – e. g. predict treatment outcome using gene expression profile • Class Discovery – Find genes with similar expression profiles – Find clusters of samples, not necessarily based on known phenotype
Study Design and Analysis Should be Tailored to Objectives • Class comparison & prediction are not clustering problems – Supervised methods • For prediction problems, case selection is key to obtaining therapeutically relevant classifiers
Myth-2 • Development of good predictive classifiers is not possible with >10, 000 genes and <100 cases
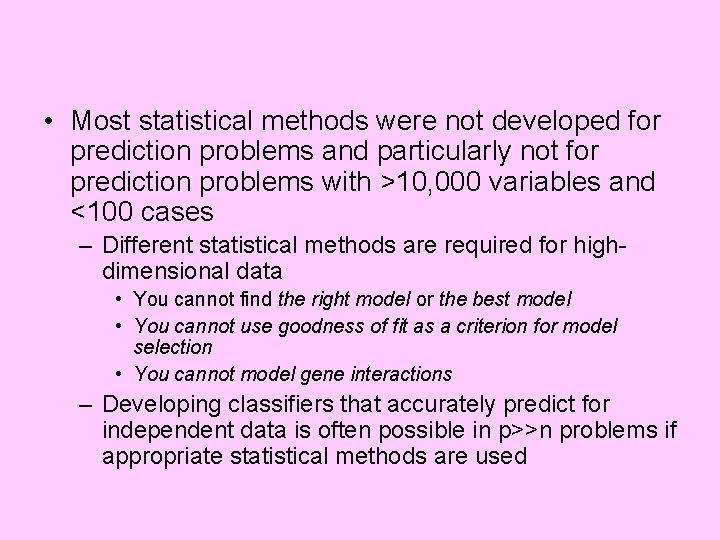
• Most statistical methods were not developed for prediction problems and particularly not for prediction problems with >10, 000 variables and <100 cases – Different statistical methods are required for highdimensional data • You cannot find the right model or the best model • You cannot use goodness of fit as a criterion for model selection • You cannot model gene interactions – Developing classifiers that accurately predict for independent data is often possible in p>>n problems if appropriate statistical methods are used
Sample Size Planning References • K Dobbin, R Simon. Sample size determination in microarray experiments for class comparison and prognostic classification. Biostatistics 6: 2738, 2005 • K Dobbin, R Simon. Sample size planning for developing classifiers using high dimensional DNA microarray data. Biostatistics 8: 101 -117, 2007 • K Dobbin, Y Zhao, R Simon. How large a training set is needed to develop a classifier with microarray data? Clinical Cancer Research (in press)
Myth-3 • Complex classification algorithms perform better than simpler methods for class prediction.
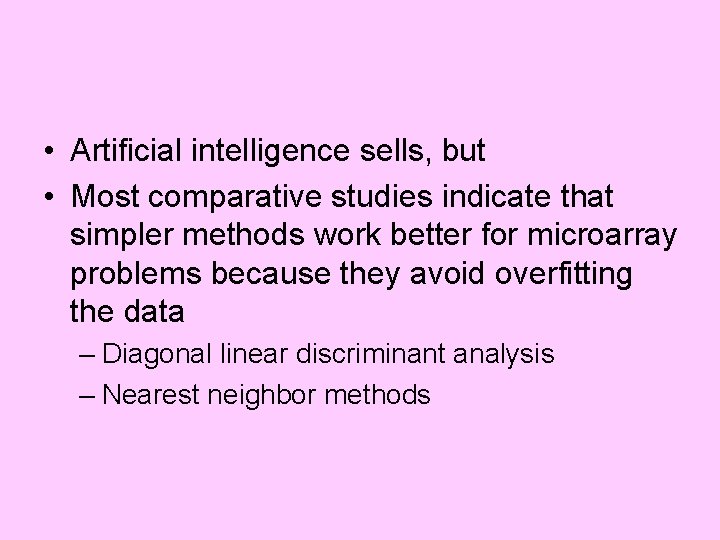
• Artificial intelligence sells, but • Most comparative studies indicate that simpler methods work better for microarray problems because they avoid overfitting the data – Diagonal linear discriminant analysis – Nearest neighbor methods
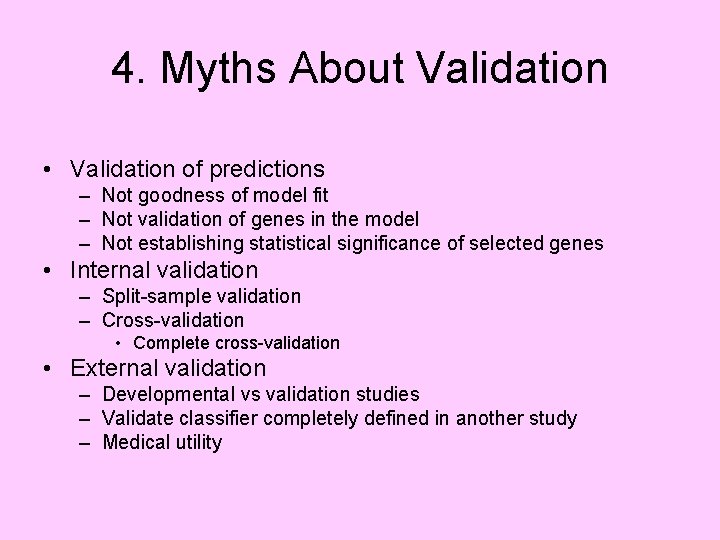
4. Myths About Validation • Validation of predictions – Not goodness of model fit – Not validation of genes in the model – Not establishing statistical significance of selected genes • Internal validation – Split-sample validation – Cross-validation • Complete cross-validation • External validation – Developmental vs validation studies – Validate classifier completely defined in another study – Medical utility
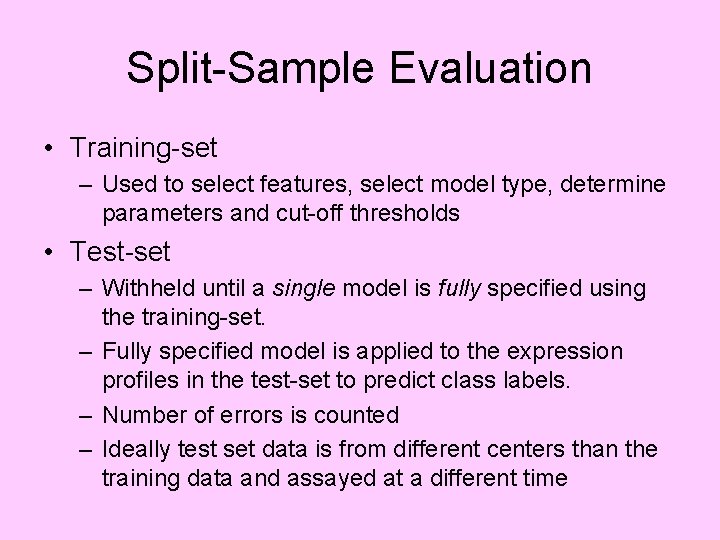
Split-Sample Evaluation • Training-set – Used to select features, select model type, determine parameters and cut-off thresholds • Test-set – Withheld until a single model is fully specified using the training-set. – Fully specified model is applied to the expression profiles in the test-set to predict class labels. – Number of errors is counted – Ideally test set data is from different centers than the training data and assayed at a different time
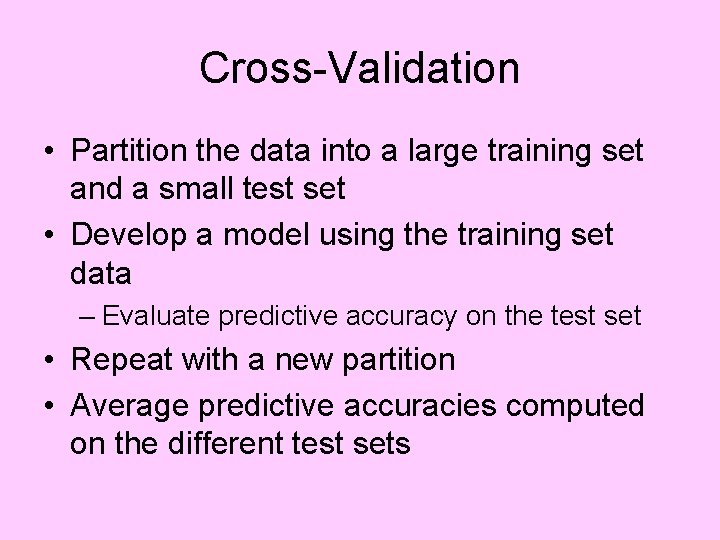
Cross-Validation • Partition the data into a large training set and a small test set • Develop a model using the training set data – Evaluate predictive accuracy on the test set • Repeat with a new partition • Average predictive accuracies computed on the different test sets
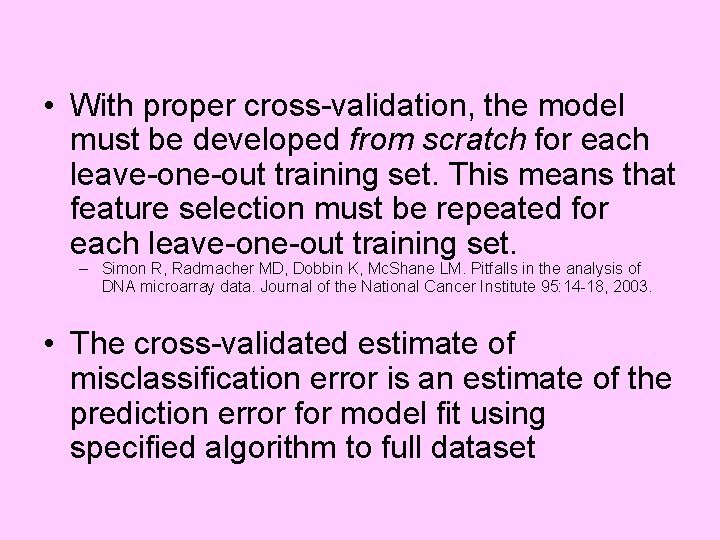
• With proper cross-validation, the model must be developed from scratch for each leave-one-out training set. This means that feature selection must be repeated for each leave-one-out training set. – Simon R, Radmacher MD, Dobbin K, Mc. Shane LM. Pitfalls in the analysis of DNA microarray data. Journal of the National Cancer Institute 95: 14 -18, 2003. • The cross-validated estimate of misclassification error is an estimate of the prediction error for model fit using specified algorithm to full dataset
• For small studies, cross-validation provides better estimates of predictive accuracy than does split-sample validation – Prediction accuracy of model developed on full dataset
Myth-5 • The challenge presented by whole genome characterization technologies is managing the volume of data generated
BRB-Array. Tools http: //linus. nci. nih. gov • Contains analysis tools that I have selected as valid and useful • Targeted to biomedical scientists with analysis wizard and numerous help screens • Imports data from all platforms and major databases • Extensive built-in gene annotation and linkage to gene annotation websites • Extensive gene-set enrichment tools for integrating gene expression with pathways, transcription factor targets, micro. RNA targets, protein domains and other biological information • Extensive tools for the development and validation of predictive classifiers with binary outcome or survival outcome data
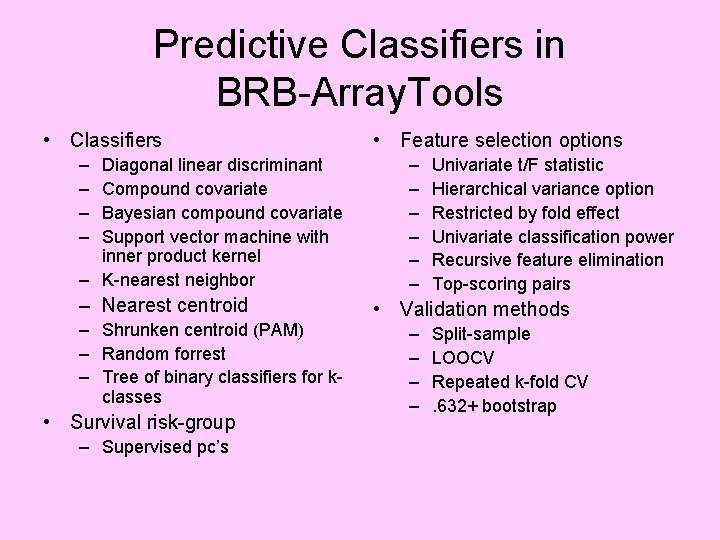
Predictive Classifiers in BRB-Array. Tools • Classifiers – – Diagonal linear discriminant Compound covariate Bayesian compound covariate Support vector machine with inner product kernel – K-nearest neighbor – Nearest centroid – Shrunken centroid (PAM) – Random forrest – Tree of binary classifiers for kclasses • Survival risk-group – Supervised pc’s • Feature selection options – – – Univariate t/F statistic Hierarchical variance option Restricted by fold effect Univariate classification power Recursive feature elimination Top-scoring pairs • Validation methods – – Split-sample LOOCV Repeated k-fold CV. 632+ bootstrap
Conclusions • New technology makes it increasingly feasible to identify which patients are likely or unlikely to benefit from a specified treatment • Targeting treatment can greatly improve therapeutic ratio of benefit to adverse effects – Smaller clinical trials needed – Treated patients benefit – Economic benefit
Conclusions • Some of the conventional wisdom about how to develop predictive classifiers and how to use them in clinical trial design is flawed • Prospectively specified analysis plans for phase III studies are essential to achieve reliable results – Biomarker analysis does not mean exploratory analysis except in developmental studies
Conclusions • Achieving the potential of new technology requires paradigm changes in “correlative science. ” • Effective interdisciplinary research requires increased emphasis on cross education of laboratory, clinical and statistical/computational scientists
Acknowledgements • • Kevin Dobbin Alain Dupuy Boris Freidlin Wenyu Jiang Aboubakar Maitnourim Joanna Shih Yingdong Zhao