Mathematica Mathematica Mathematica 1 5 Mathematica Mathematica In1
 Mathematica 使用简介")
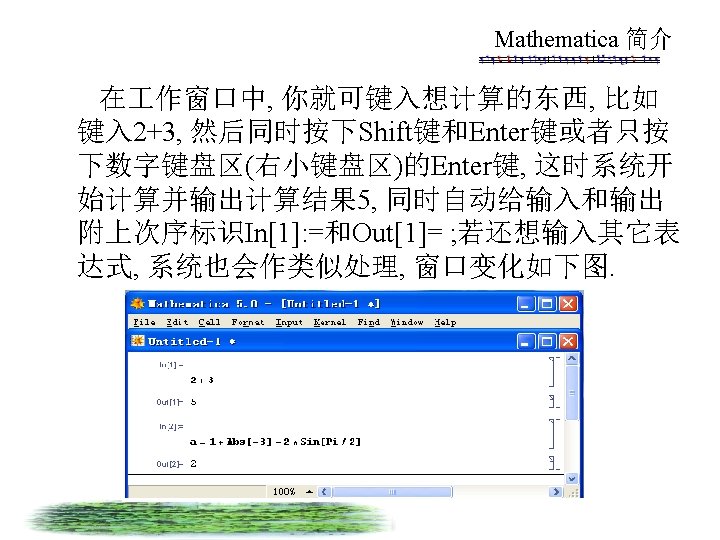

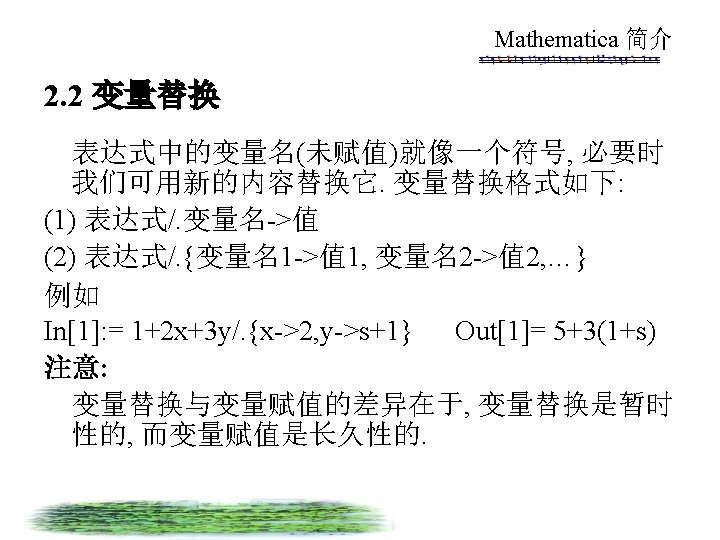
![Mathematica 简介 例如下面定义函数, 并运算 In[1]: = f[x_]=x+3; In[2]: ={f[x], f[y], f[2]} Out[2]= {3+x, 3+y,](https://slidetodoc.com/presentation_image_h/1acaa27f0243479f8a497eee02262184/image-21.jpg "Mathematica 简介 例如下面定义函数, 并运算 In[1]: = f[x_]=x+3; In[2]: ={f[x], f[y], f[2]} Out[2]= {3+x, 3+y,")
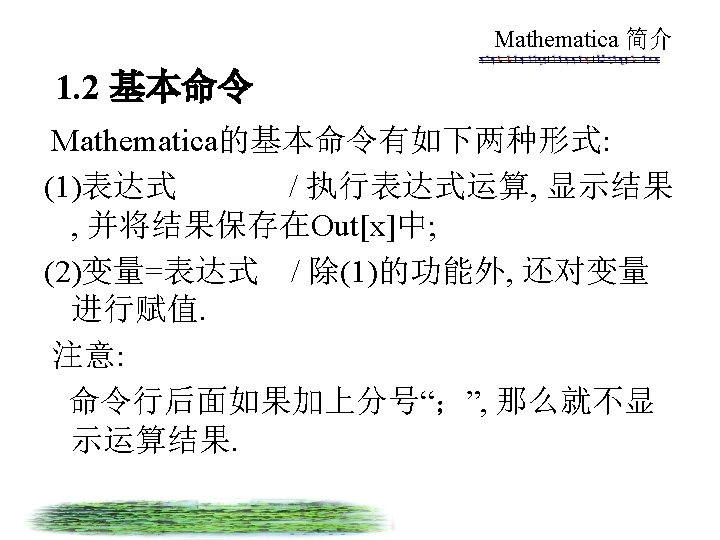
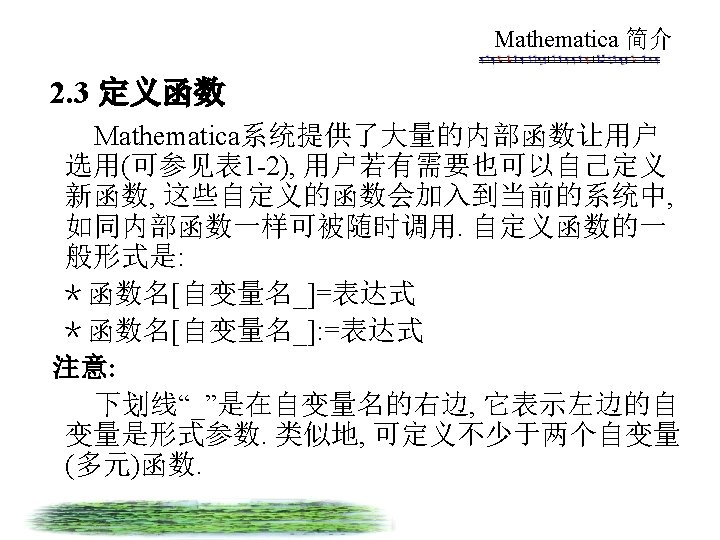
![Mathematica 简介 例如 In[1]: = D[Sin[x], x] Out[1]= Cos[x] In[2]: = D[Sin[2 x], {x,](https://slidetodoc.com/presentation_image_h/1acaa27f0243479f8a497eee02262184/image-28.jpg "Mathematica 简介 例如 In[1]: = D[Sin[x], x] Out[1]= Cos[x] In[2]: = D[Sin[2 x], {x,")
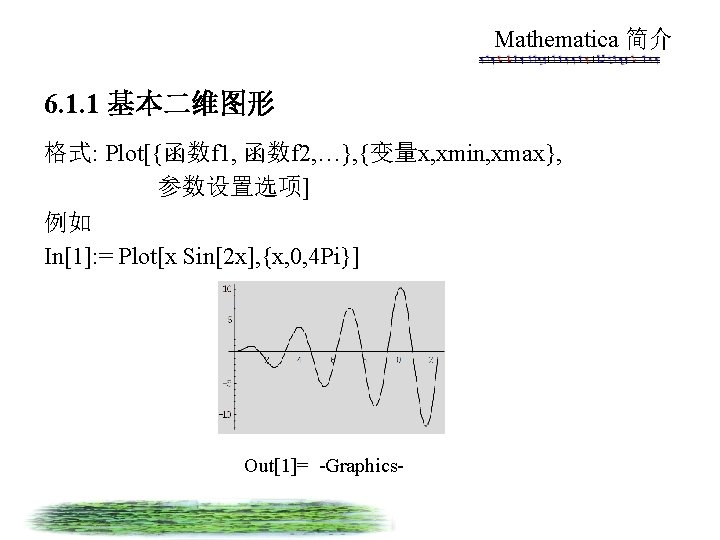
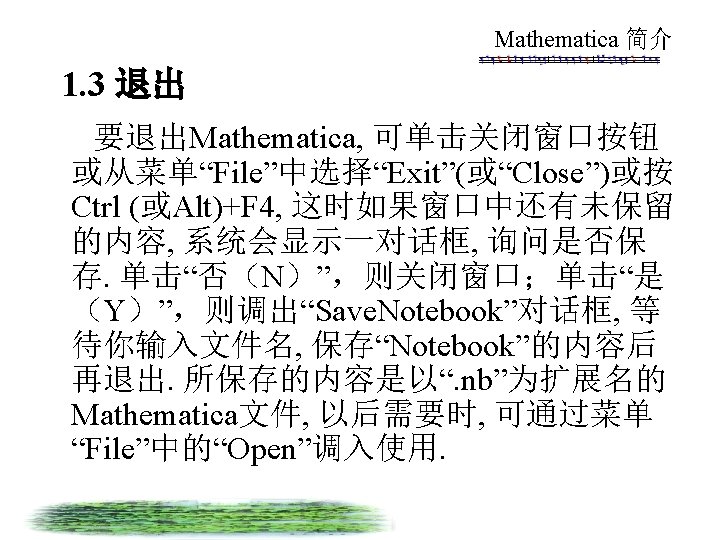
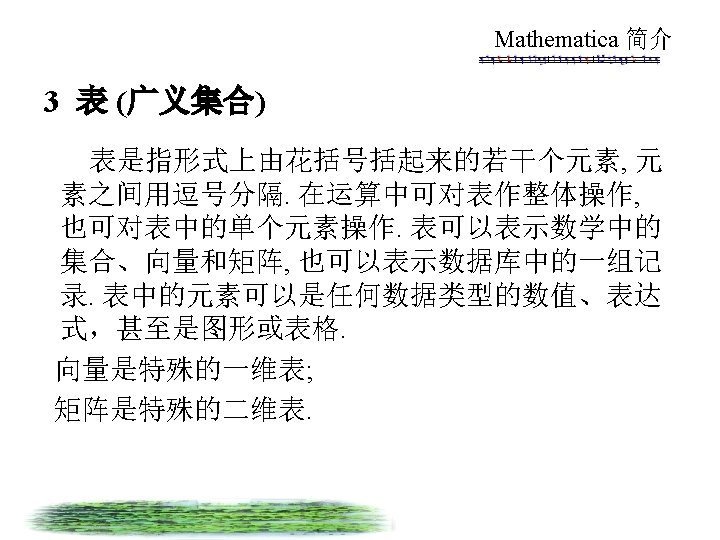
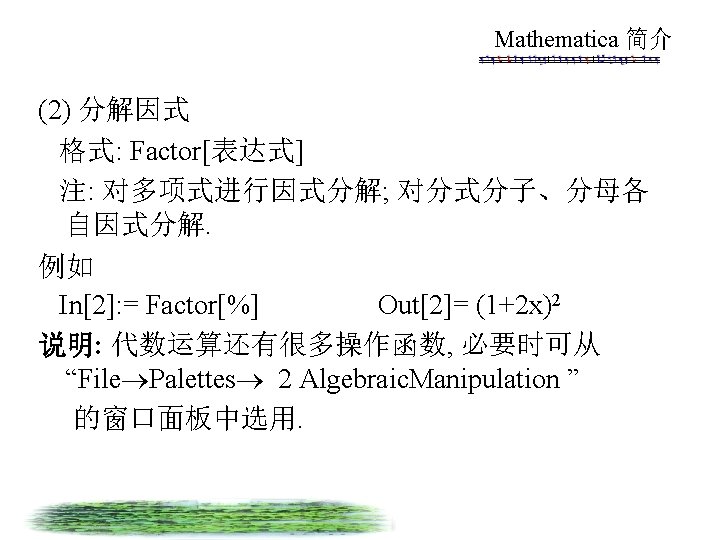
![Mathematica 简介 In[2]: = Plot[{Sin[x], Cos[x]}, {x, -Pi, Pi}, Axes. Label->{“x”, ”y”}, Frame->True, Plot.](https://slidetodoc.com/presentation_image_h/1acaa27f0243479f8a497eee02262184/image-40.jpg "Mathematica 简介 In[2]: = Plot[{Sin[x], Cos[x]}, {x, -Pi, Pi}, Axes. Label->{“x”, ”y”}, Frame->True, Plot.")
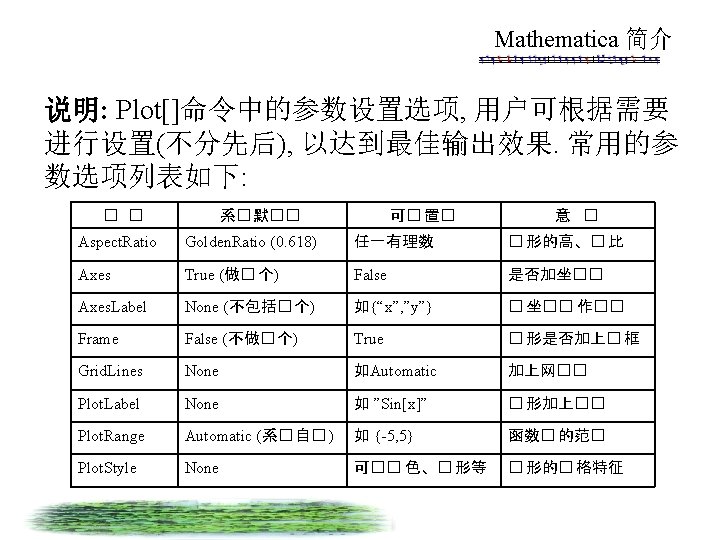
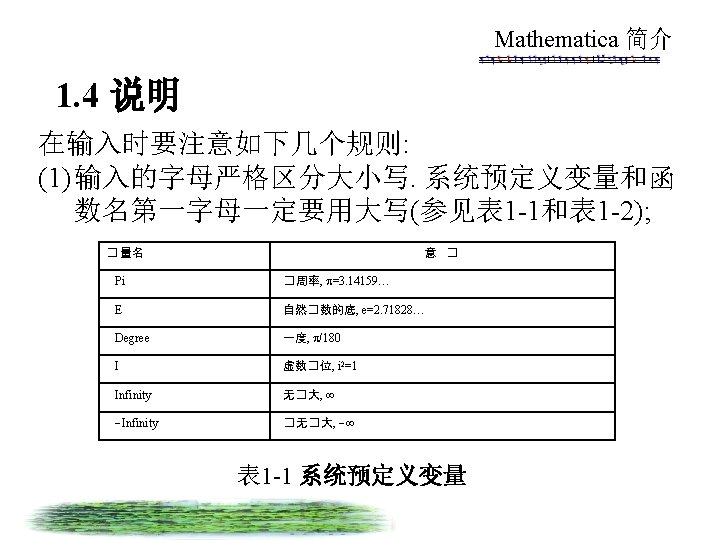
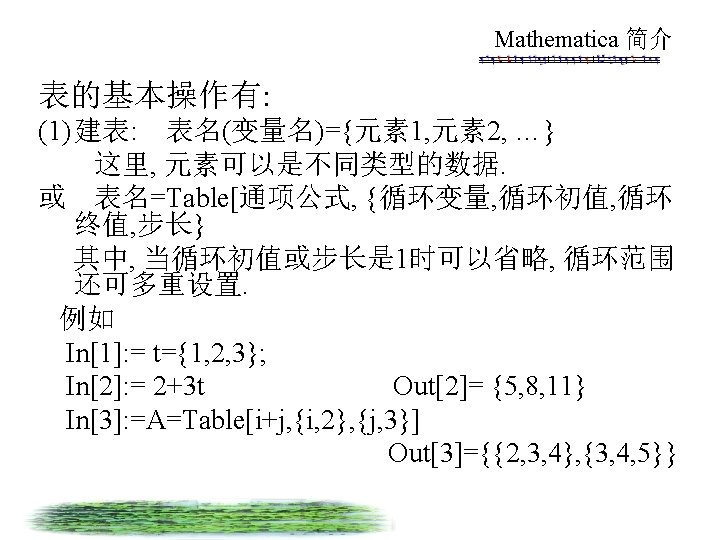
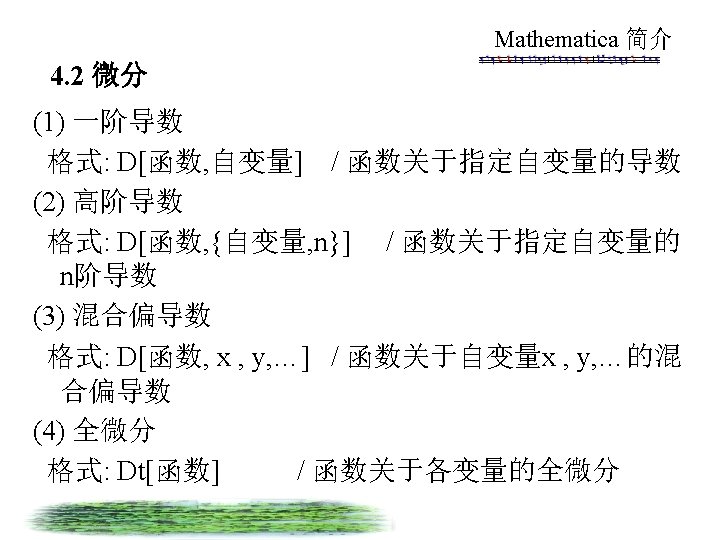
![Mathematica 简介 6. 1. 2 数据集合图形 格式: List. Plot[{y 1, y 2, …}] /](https://slidetodoc.com/presentation_image_h/1acaa27f0243479f8a497eee02262184/image-42.jpg "Mathematica 简介 6. 1. 2 数据集合图形 格式: List. Plot[{y 1, y 2, …}] /")
![Mathematica 简介 6. 1. 3 参数曲线图 格式: Parametric. Plot[{xt, yt}, {t, tmin, tmax}] /绘出参数图](https://slidetodoc.com/presentation_image_h/1acaa27f0243479f8a497eee02262184/image-43.jpg "Mathematica 简介 6. 1. 3 参数曲线图 格式: Parametric. Plot[{xt, yt}, {t, tmin, tmax}] /绘出参数图")
![Mathematica 简介 例如 In[1]: = Parametric. Plot[{t-Sin[t], 1 -Cos[t]}, {t, 0, 2 Pi}, Aspect.](https://slidetodoc.com/presentation_image_h/1acaa27f0243479f8a497eee02262184/image-44.jpg "Mathematica 简介 例如 In[1]: = Parametric. Plot[{t-Sin[t], 1 -Cos[t]}, {t, 0, 2 Pi}, Aspect.")
![Mathematica 简介 例如 In[1]: = G 1=Plot[Sin[2 x], {x, 0, 4 Pi}]; In[2]: =](https://slidetodoc.com/presentation_image_h/1acaa27f0243479f8a497eee02262184/image-46.jpg "Mathematica 简介 例如 In[1]: = G 1=Plot[Sin[2 x], {x, 0, 4 Pi}]; In[2]: =")

![Mathematica 简介 例如 In[1]: = t=1; Do[t*=k; If[t>30, Break[]]; Print[t]], {k, 10}] / t*=k即t=](https://slidetodoc.com/presentation_image_h/1acaa27f0243479f8a497eee02262184/image-56.jpg "Mathematica 简介 例如 In[1]: = t=1; Do[t*=k; If[t>30, Break[]]; Print[t]], {k, 10}] / t*=k即t=")
- Slides: 56
Mathematica 简介 (二) Mathematica 使用简介
Mathematica 简介 图 1 -5 Mathematica的符号输入平台
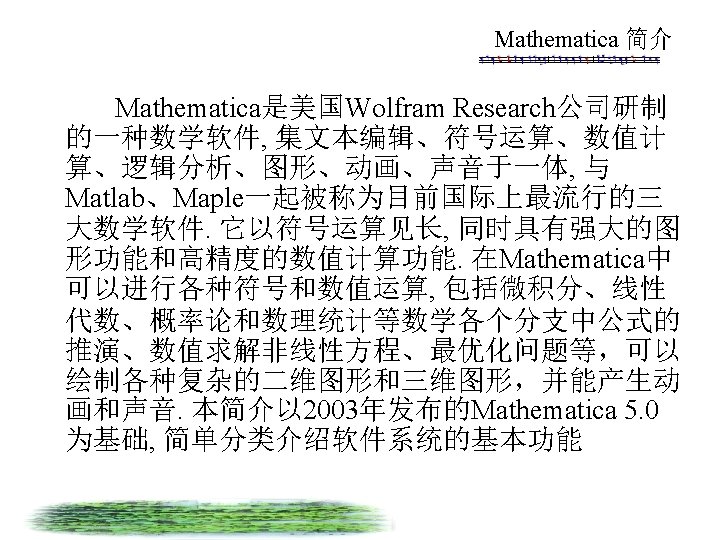
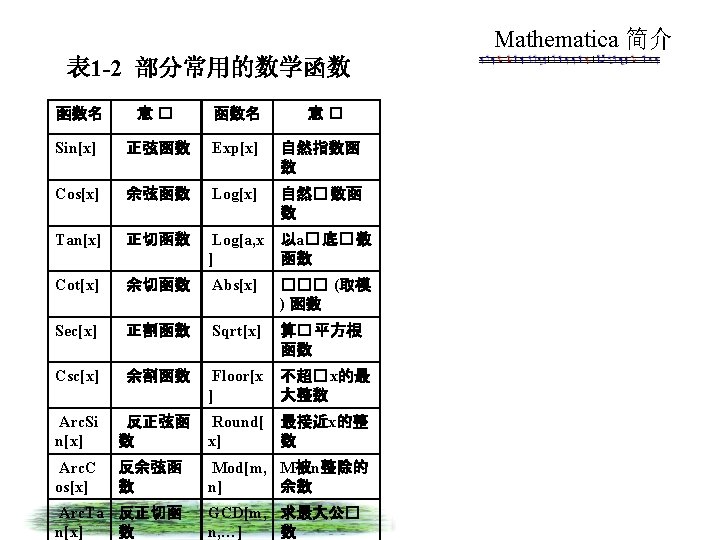
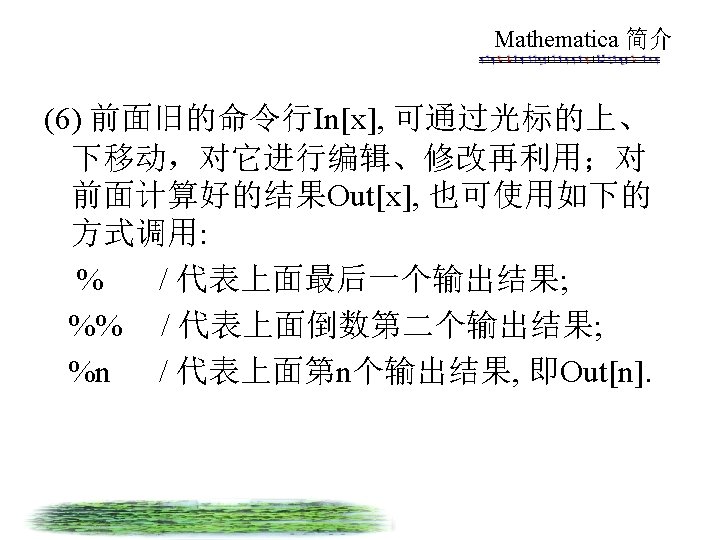
Mathematica 简介 例如下面定义函数, 并运算 In[1]: = f[x_]=x+3; In[2]: ={f[x], f[y], f[2]} Out[2]= {3+x, 3+y, 5} In[3]: = g[x_, y_]=x^2 -y^2; In[4]: = g[1, 2] Out[4]= -3
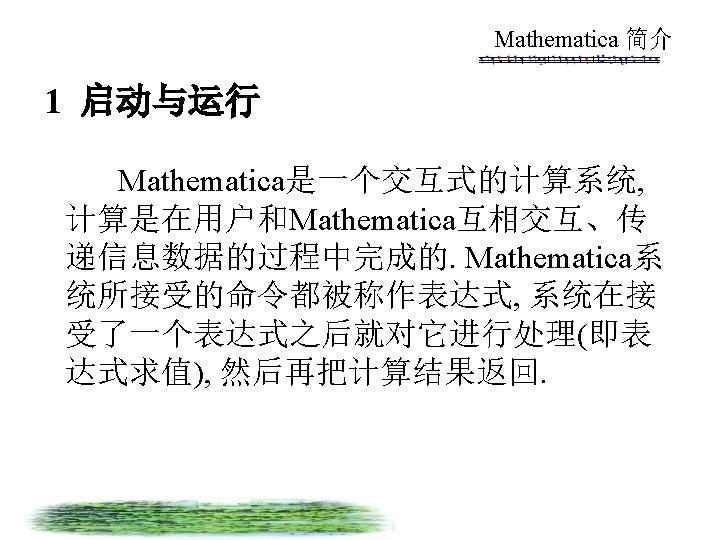
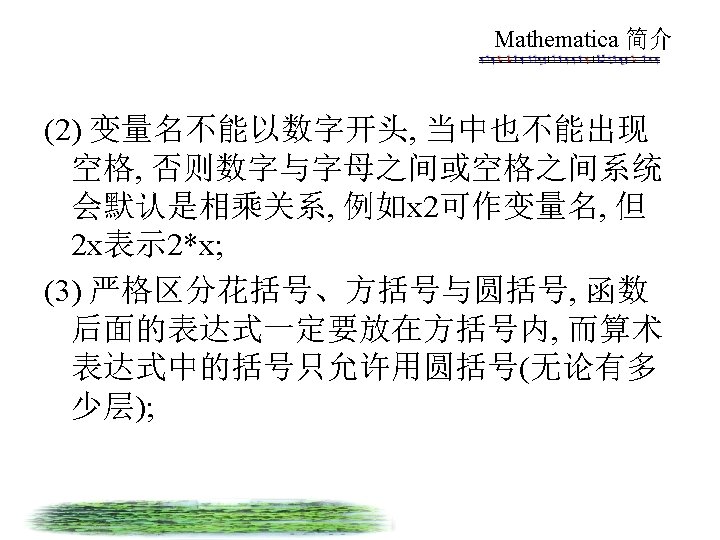
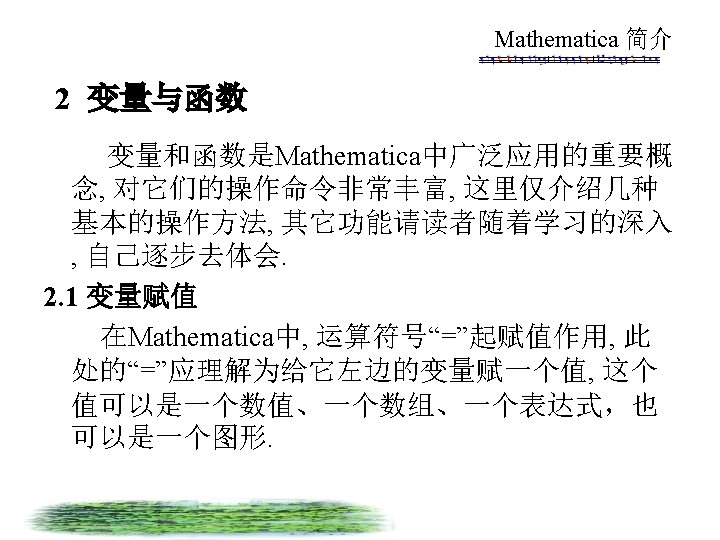
Mathematica 简介 例如 In[1]: = D[Sin[x], x] Out[1]= Cos[x] In[2]: = D[Sin[2 x], {x, 2}] Out[2]= 4 Sin[2 x] In[3]: = D[Sin[x*y], x, , y] Out[3]= Cos[xy]-xy. Sin[xy] In[4]: = Dt[Sin[x*y]] Out[4]= Cos[xy](y. Dt[x]+x. Dt[y])
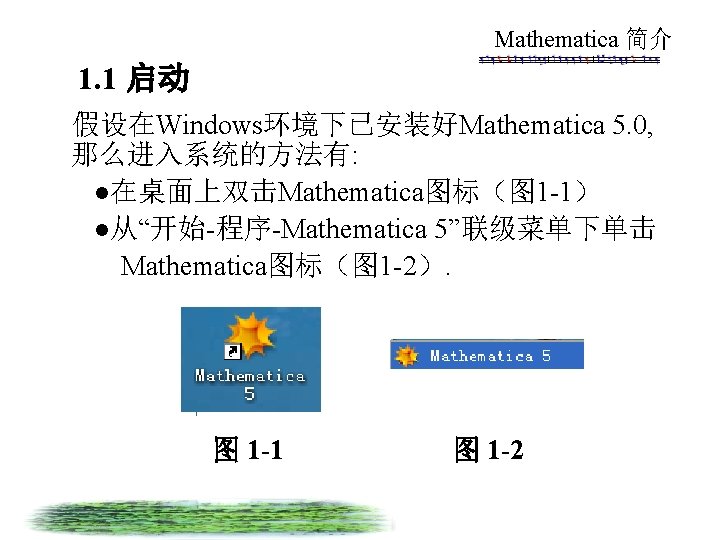
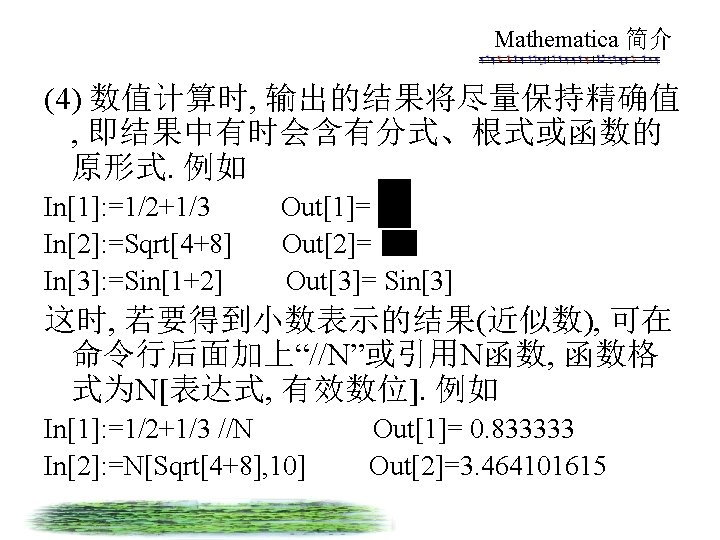
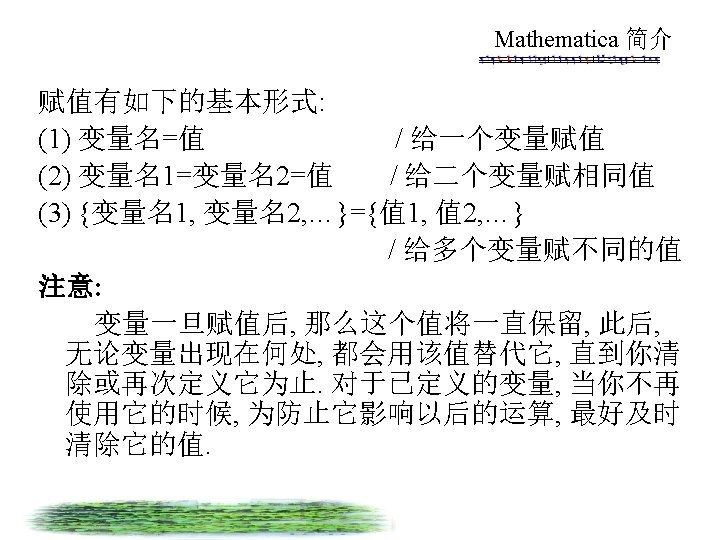
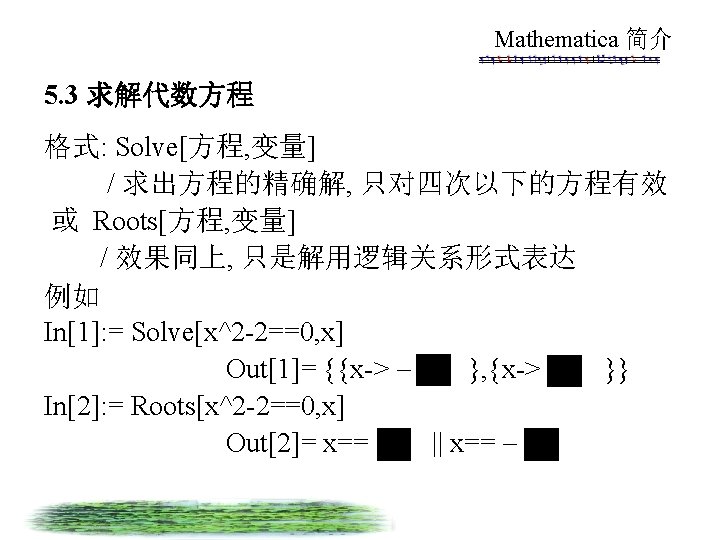
Mathematica 简介 In[2]: = Plot[{Sin[x], Cos[x]}, {x, -Pi, Pi}, Axes. Label->{“x”, ”y”}, Frame->True, Plot. Style->RGBColor[1, 0, 0]] Out[2]= -Graphics-
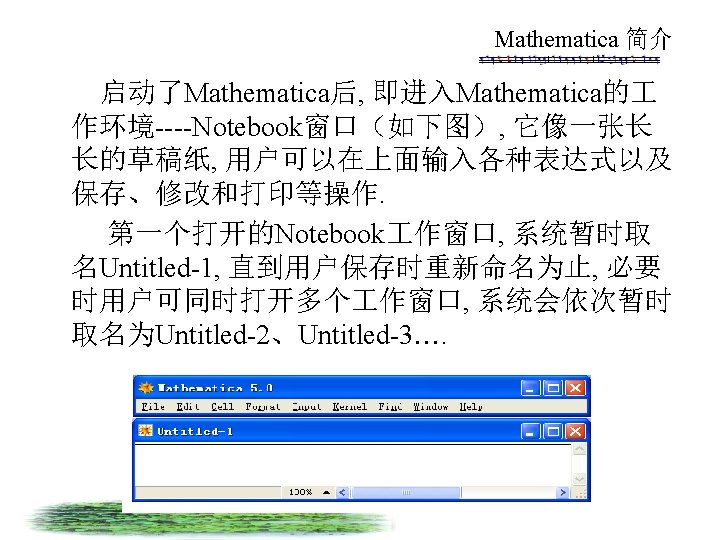
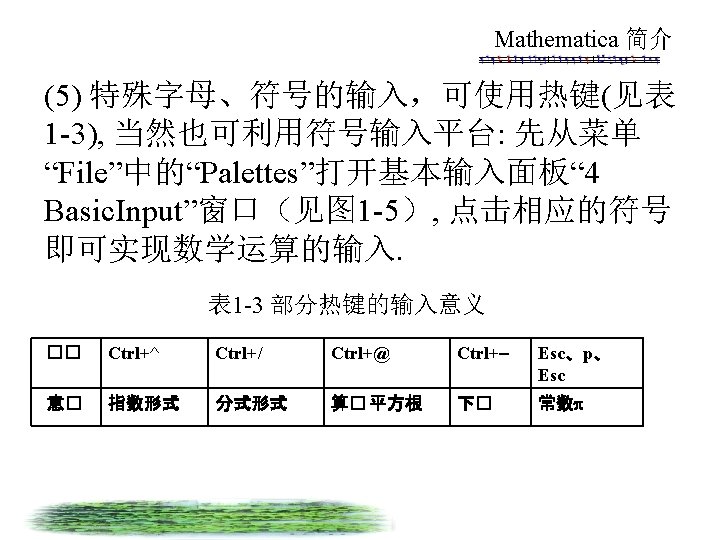
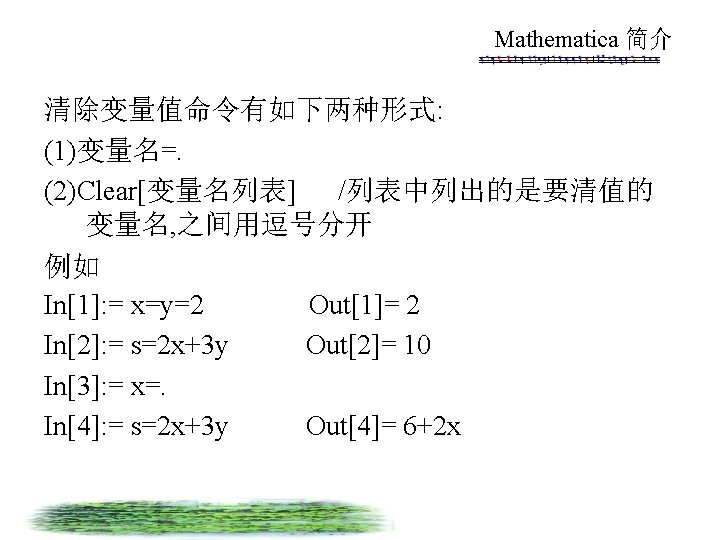
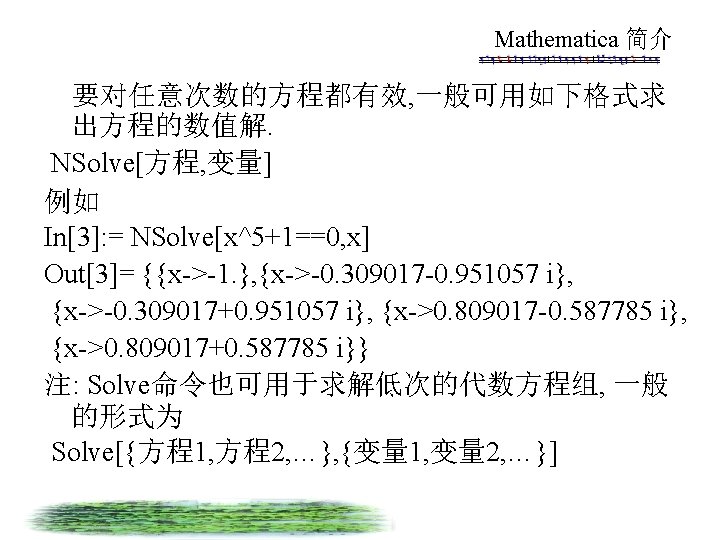
Mathematica 简介 6. 1. 2 数据集合图形 格式: List. Plot[{y 1, y 2, …}] / 绘出离散点(1, y 1), (2, y 2), … 或 List. Plot[{{x 1, y 1}, {x 2, y 2}, …}] / 绘出离散点(x 1, y 1), (x 2, y 2), … 或 List. Plot[{{x 1, y 1}, {x 2, y 2}, …}, Plot. Joined->True] / 将离散点连线 例如 In[1]: = P=Table[{x, Sin[x]}, {x, 0, 2 Pi, Pi/9}]; In[2]: = List. Plot[P] Out[2]= -Graphics- (图略) In[3]: = List. Plot[P, Plot. Joined->True] Out[3]= -Graphics- (图略)
Mathematica 简介 6. 1. 3 参数曲线图 格式: Parametric. Plot[{xt, yt}, {t, tmin, tmax}] /绘出参数图 或 Parametric. Plot[{{xt, yt}, {ut, vt}, …}, {t, tmin, tmax}] /同时绘出一些参数图 或 Parametric. Plot[{xt, yt}, {t, tmin, tmax}, Aspect. Ratio>Automatic] /设法保持曲线形状
Mathematica 简介 例如 In[1]: = Parametric. Plot[{t-Sin[t], 1 -Cos[t]}, {t, 0, 2 Pi}, Aspect. Ratio->Automatic] Out[1]= -Graphics- (绘出摆线)
Mathematica 简介 例如 In[1]: = G 1=Plot[Sin[2 x], {x, 0, 4 Pi}]; In[2]: = G 2=Plot[x*Sin[2 x], {x, 0, 4 Pi}] ; In[3]: = G=Show[G 1, G 2]; In[4]: = Show[Graphics. Array[{G 1, G 2, G}]] Out[4]= -Graphics-
Mathematica 简介 6. 2. 2 参数曲线、曲面图 格式: Parametric. Plot 3 D[{xt, yt, zt}, {t, t 0, t 1}] / 绘出参数曲线图 或 Parametric. Plot 3 D[{xst, yst, zst}, {s, s 0, s 1}, {t, t 0, t 1}] 例如 / 绘出参数曲面图 In[1]: = Parametric. Plot 3 D[{4 Cos[t], 4 Sin[t], t}, {t, 0, 4 Pi}] In[2]: = Parametric. Plot 3 D[{Cos[s](3+Cos[t]), Sin[t]}, {s, 0, 2 Pi}, {t, 0, 2 Pi}]
Mathematica 简介 例如 In[1]: = t=1; Do[t*=k; If[t>30, Break[]]; Print[t]], {k, 10}] / t*=k即t= t* k (分四列分别输出 1 、 2、6、24 这里省略) In[2]: = t=1; Do[t*=k; If[t<4, Continue[]]; Print[t]], {k, 6}] 24 120 720 In[3]: = f[x_]: =(If[x>5, Return[big]]; t=10*x; Print[t]) In[4]: = f[4] Out[4]= 40 In[3]: = f[10] Out[4]= big