Managing Uncertainty Geo 580 Jim Graham Topic Uncertainty


 – Precision • Issues")


 Estimate Remove Maintain Remove/Compensate Report")


 • Bias = Distance from truth Bias Truth Mean")
 •")


 Each band represents one standard deviation Source: Wikipedia")


 Red Snapper Occurrences (>6, 000 records)")


 • How many significant digits are in: – 12. 001 –")


= • T- (Mean 1*Num 1+Mean")
 • Multiply/Divide:")


- Slides: 73
Managing Uncertainty Geo 580, Jim Graham
Topic: Uncertainty • Why it’s important: – How to keep from being “wrong” • Definitions: – Gross errors, accuracy (bias), precision • • • Sources of uncertainty Estimating uncertainty Reducing uncertainty Maintaining uncertainty Reporting
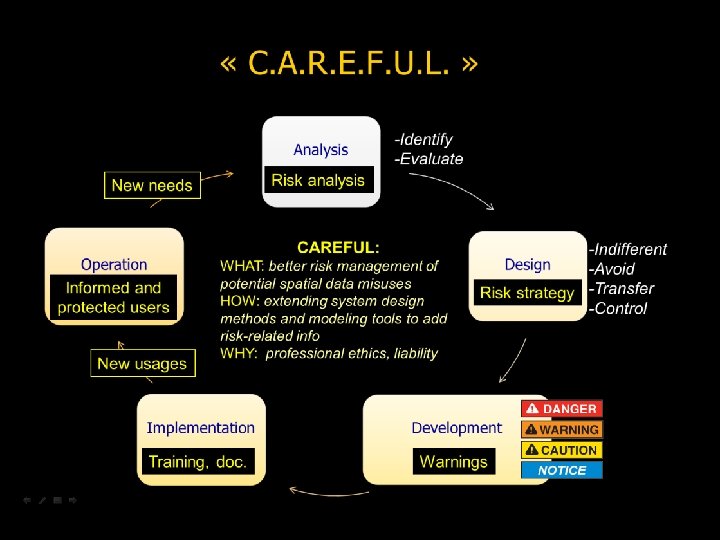
Consequences • Users assume data is appropriate for their use regardless of hidden uncertainty • “Erroneous, inadequately documented, or inappropriate data can have grave consequences for individuals and the environment. ” (AAG Geographic Information Ethics Session Description, 2009)
1999 Belgrade Bombing • In 1999 the US mistakenly bombed the Chinese embassy in Belgrade • Had successfully bombed 78 targets • Did not have the new address of the Chinese embassy • Used “Intersection” method • This was a GIS process error! https: //www. cia. gov/news-information/speeches-testimony/1999/dci_speech_072299. html
Life. Mapper: Tamarix chinensis Life. Mapper. org
Life. Mapper: Loggerhead Turtles Life. Mapper. org
Take Away Messages • No data is “correct”: – All data has some uncertainty • Manage uncertainty: – Have a protocol for data collection – Investigate the uncertainty of acquired data – Manage uncertainty throughout processing – Report uncertainty in metadata and documents • This will help others make better decisions
Sources of Uncertainty Real World Uncertainty? Protocol Errors, Sampling Bias, and Instrument Error Unintended Conversions Uncertainty increases with processing, human errors Measurements Storage Digital Copy Processing Incorrect method, interpretation errors Analysis Representation errors Results Interpretation errors Decisions
Definitions: Uncertainty • Types – Gross Errors – Accuracy (Bias) – Precision • Issues – – – Drift over time Gridding Collection bias Conversions Digits after the decimal in coorinates • Sources – – – People Instruments Transforms (tools) Protocol(s) Software
Dimensions of Spatial Data • Space: – Coordinate uncertainty • Time: – When collected? Drift? • Attributes: – Measurement uncertainty • Relationships – Topological errors
Polar Bears • Polar Bears Ursus maritimus occurrences from GBIF. org, Jan 1 st, 2013
Coastline of China • 1920 – 9, 000 km • 1950 s – 11, 000 km • 1960 s – 14, 000 km at scale of 1: 100, 000 – 18, 000 km at scale of 1: 50, 000
Horsetooth Lake - Colorado
Inputs Gross Errors Precision Accuracy (Bias) Estimate Remove Maintain Remove/Compensate Report
Protocol • Rule #1: Have one! • Step by step instructions on how to collect the data – Calibration – Equipment required – Training required – Steps – QAQC • See Globe Protocols: – http: //www. globe. gov/sda/tg 00/aerosol. pdf
Gross Errors • Wrong Datum, missing SRS • Data in wrong field/attribute • Transcription errors – Lat swapped with Lon – Dropped negative sign
Gross Errors • Estimating: – How many did you find? – How many didn’t you find? • Removing Errors: – Only after estimating • Maintaining: – Review process • Report: – Gross errors found – Estimate of gross errors still remaining
Accuracy and Precision High Accuracy Low Precision Low Accuracy High Precision http: //en. wikipedia. org/wiki/Accuracy_and_precision
Bias
Bias (Accuracy) • Bias = Distance from truth Bias Truth Mean
Bias • Estimating: – Have to have “ground-truth” data – RMSE (sort of) • Compensating: – Spatially: • Re-georeference data • If there are lots of points: – Adjust the “measures” by the “bias” – Dates: • Remove samples from January 1 st
January 1 st Dates • If you put just a “year”, like 2011, into a relational database, the database will return: – Midnight, January 1 st, of that year • In other words: – 2011 becomes: – 2011 -01 -01 00: 00. 00
RMSE From Higher Accuracy •
Precision • Estimate: – Standard Deviation: Precision – Standard Error: Precision – Confidence Interval: Precision – Min/Max: Precision • Manage: – Significant Digits – Data types: Doubles, Long Integers • Report
Standard Deviation (Precision) Each band represents one standard deviation Source: Wikipedia
Standard Error of Sample Mean • Wikipedia
Confidence Interval: 95% • 95%, typically means that your model will be within the interval 95% of the times you collect data and build the model
Min/Max or Plus/Minus: Range • Does this really mean all values fall within range?
Oregon Fire Data
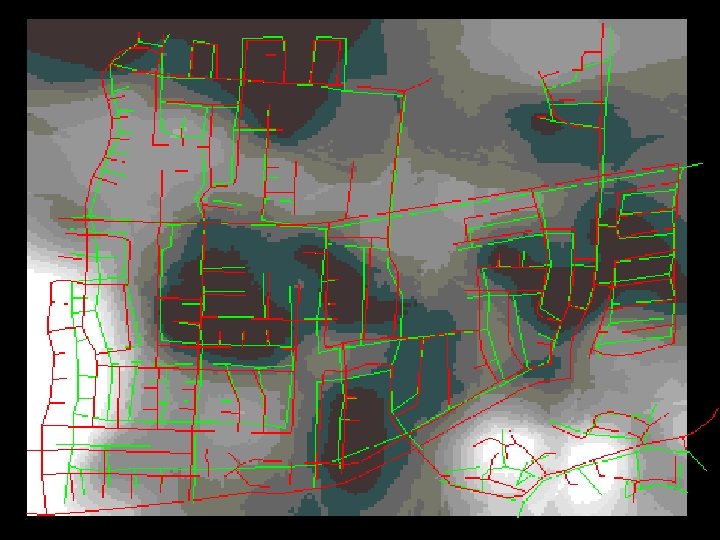
What’s the Resolution?
Gridded Data
Quantization/Gridding • • Fires Esimating: minimum distance histogram Removing: Can’t? Reporting:
Errors in Interpolated Surfaces • Kriging provides standard error surface – Only esimates the error from interpolating! • Can use Cross-Validation with other methods to obtain overall RMSE • “Perturb” the inputs to include existing uncertainties
Cross-validation • Maciej Tomczak , Spatial Interpolation and its Uncertainty Using Automated Anisotropic Inverse Distance Weighting (IDW) - Cross-Validation/Jackknife Approach , Journal of Geographic Information and Decision Analysis, vol. 2, no. 2, pp. 18 -30, 1998
Managing Uncertainty • Solution 1 – Compute uncertainty throughout processing – Difficult • Solution 2 – Maintain a set of “control points” • Represent the full range of values – Duplicate all processing on the control points – At least measure their variance in the final data set
Documenting Uncertainty • Record accuracy and precision in metadata! • Add uncertainty to your outputs – Data sources – Sampling Procedures and Bias – Processing methods – Estimated uncertainty • Add “caveats” sections to manuscripts • Be careful with “significant digits” – Some will interpret as “precision”
Documenting Uncertainty • For each dataset, include information on: – Gross errors – Accuracy – Precision
Communicating Uncertainy Colleen Sullivan, 2012
Additional Slides
Habitat Suitability Models • Adjusting number of occurrences for the amount of habitat Jane Elith 1*, Steven J. Phillips 2, Trevor Hastie 3, Miroslav Dudı´k 4, Yung En Chee 1 and Colin J. Yates 5, A statistical explanation of Max. Ent for ecologists
Removing Biased Dates • Histogramming the dates can show the dates are biased • If you need dates at higher resolution than years and the “precision” of the date was not recorded, the only choice is to remove all dates from midnight on January 1 st.
Histogram – Fire Data Number of Occurrences Histogram of Minimum Distances Minimum Distance Between Points
Uniform Data Number of Occurrences Histogram of Minimum Distances Minimum Distance Between Points
“Random” Data Number of Occurrences Histogram of Minimum Distances Minimum Distance Between Points
FGDC Standards • Federal Geographic Data Committee FGDC-STD-007. 3 -1998 • Geospatial Positioning Accuracy Standards • Part 3: National Standard for Spatial Data Accuracy – Root Mean Squared Error (RMSE) from HIGHER accuracy source – Accuracy reported as 95% confidence interval http: //www. fgdc. gov/standards/projects/FGDC-standards-projects/accuracy/part 3/chapter 3 Section 3. 2. 1
What does your discipline do? • Varies with discipline and country • Check the literature • Opportunities for new research?
Slides for Habitat Suitability
Resolution or Detail • Resolution = Resolving Power • Examples: – What would be visible on a 30 meter Land. Sat image vs. a 300 meter MODIS image? A 60 cm RS image? – What is the length of the coast line of China?
Road Map of Uncertainty • • Spatial Precision Spatial Accuracy Sample Bias Identification Errors Date problems Gross Errors Gridding • • Sample Data Over fitting? Assumptions? Predictor Layers • • • Modeling Software Settings • • • Realistic? Uncertainty maps? • • Match expectations? Over-fit? How to determine? Model Performance Measures Number of Parameters AIC, AICc, BIC, AUC Response Curves Habitat Map Noise Correlation Interpolation Error Spatial Errors Measurement Errors Temporal Uncertainty • What is the best model? Accurate measures?
SEAMAP Trawls (>47, 000 records) Red Snapper Occurrences (>6, 000 records)
Jiggling The Samples • Randomly shifting the position of the points based on a given standard deviation based on sample uncertainty • Running the model repeatedly to see the potential effect of the uncertainty
Jiggling No Jiggling Std Dev=4. 4 km Std Dev=55 km
Uncertainty Maps • Standard Deviation of Jiggling Points by 4. 4 km 0. 0008 0. 32
Bottom Lines • Much harder to estimate uncertainty than to record it in the field • We need to do the best we can to: – Investigate uncertainty – Make sure data is appropriate for use – Communicate uncertainty and risks • Don’t be like preachers – Be like meteorologists
Pocket Slides • This material will be used as needed to answer questions during the lectures.
GPS • Calibration • Dilusion of Precision: manufacturer defined! • Esimate: Repeated measurements against benchmark – Precision and Accuracy
Calibration • Sample a portion of the study area repeatedly and/or with higher precision – GPS: benchmarks, higher resolution – Measurements: lasers, known distances – Identifications: experts, known samples
Processing Error • Error changes with processing • The change depends on the operation and the type of error: – Min/Max – Average Error – Standard Error of the Mean – Standard Deviation – Confidence Intervals • There are “pocket slides” at the end of the lecture for more info on this approach
Storage Errors: Excel • 10/2012 -> Oct-2012 – However, Excel stores 10/1/2012! • 1. 00000001 -> 1 – However, Excel stores 1. 00000001 • 1. 00000001 -> 1 – Excel stores 1
Significant Digits (Figures) • How many significant digits are in: – 12. 001 – 12000 – 0. 00012 – 123456789 • Only applies to measured values, not exact values (i. e. 2 oranges)
Significant Digits • Cannot create precision: – 1. 0 * 2. 0 = 2. 0 – 12 * 11 = 130 (not 131) – 12. 0 * 11 = 130 (still not 131) – 12. 0 * 11. 0 = 131 • Can keep digits for calculations, report with appropriate significant digits
Rounding • If you have 2 significant digits: – 1. 11 -> ? – 1. 19 -> ? – 1. 14 -> ? – 1. 16 -> ? – 1. 15 -> ? – 1. 99 -> ? – 1. 155 -> ?
Managing Uncertainty Raster - Spatial Error in geo-referencing – Difficult to track, use worse case from originals Raster – Pixel Values Compute Accuracy and Precision from original measures, update throughout processing. Best case, maintain: Accuracy and Precision rasters Vector – Spatial Difficult to compute through some processes (projecting). Use worse case from originals or maintain “control” dataset throughout process. Vector – Attributes Compute accuracy and precision from original measures, update throughout processing.
Other Approaches • Confidence Intervals • +- Some range – Min/Max – Need a confidence interval • “Delusion of Precision” – Defined by the manufacturer
Combing Bias • Add/Subtraction: – Bias (Bias 1+Bias 2)= • T- (Mean 1*Num 1+Mean 2*Num 2)/(Num 1*Num 2) • Simplified: (|Bias 1|+|Bias 2|)/2 • Multiply Divide: – Bias (Bias 1*Bias 2)= • T- (Mean 1*Mean 2) • Simplified: |Bias 1|*|Bias 2| Derived by Jim Graham
Combining Standard Deviation • Add/Subtract: – Std. Dev=sqrt(Std. Dev 1^2+Std. Dev 2^2) • Multiply/Divide: – Std. Dev= • sqrt((Std. Dev 1/Mean 1)^2+(Std. Dev 2/Mean 2)^2) http: //www. rit. edu/cos/uphysics/uncertainties/Uncertaintiespart 2. html
Exact numbers • Adding/Subtracting: – Error does not change • Multiplying: – Multiply the error by the same number – E 2 = E 1 * 2
Human Measurements
Space Time Attribute Scale Relationships Accuracy Positional Temporal Attribute - - Precision Repeatabilit y, Sig. Digits Year, Month, Sig. Digits Day, Hour - - Resolution (Detail) Detail, Cell Size Year, Month, Day, Hour - - Logical Consistency Locational Temporal Completene ss Domain Topologic Complete ness
Examples • Resolution or cell size in a raster • How close is a stream centerline to the actual centerline? • How close is a lake boundary? • How close is a city point to the city? • How good is NLCD data?