Lecture 3 Unemployment Se Yan Guanghua School of

- Slides: 34
Lecture 3: Unemployment Se Yan Guanghua School of Management Peking University Spring 2013 1
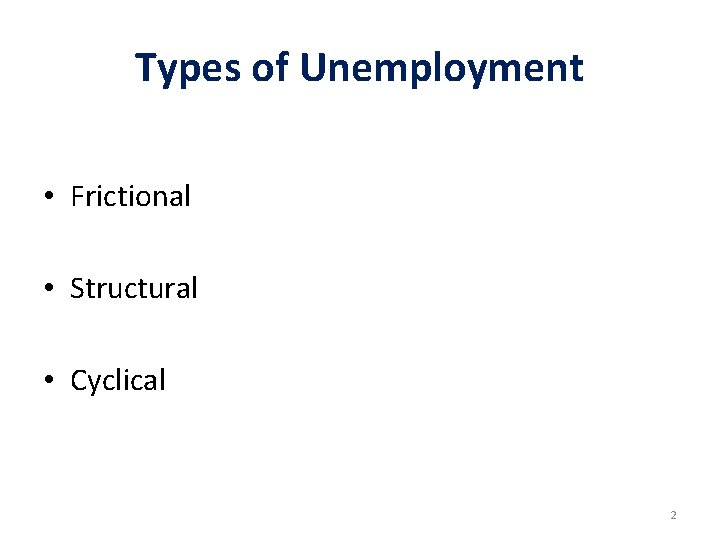
Types of Unemployment • Frictional • Structural • Cyclical 2
Frictional Unemployment • Frictional unemployment is unemployment that arises from normal labor market turnover. • The creation and destruction of jobs requires that unemployed workers search for new jobs. • Increases in the number of young people entering the labor force and increases in unemployment benefit payments raise frictional unemployment. 3
Structural and Cyclical Unemployment • Structural unemployment is unemployment created by changes in technology and foreign competition that change the match between the skills necessary to perform jobs and the locations of jobs, and the skills and location of the labor force. • Cyclical unemployment is the fluctuation in unemployment caused by the business cycle. 4
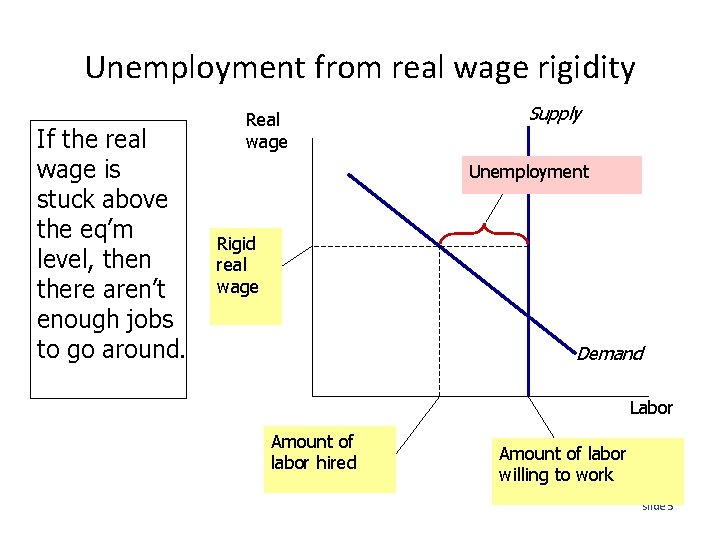
Unemployment from real wage rigidity If the real wage is stuck above the eq’m level, then there aren’t enough jobs to go around. Real wage Supply Unemployment Rigid real wage Demand Labor Amount of labor hired Amount of labor willing to work slide 5
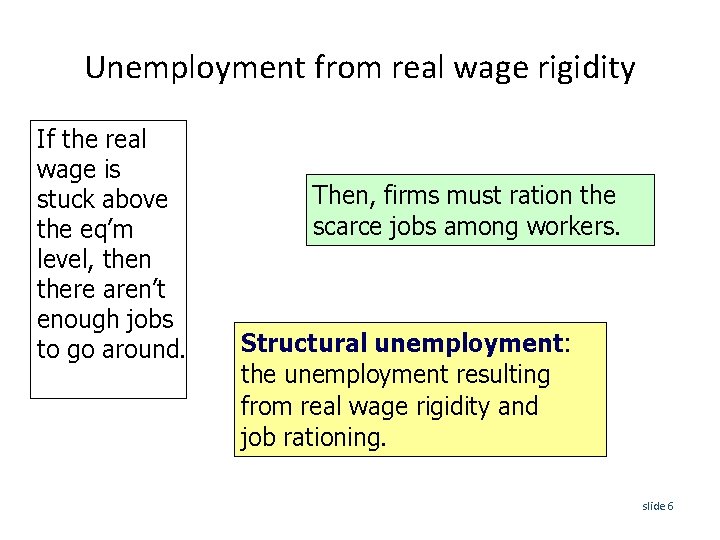
Unemployment from real wage rigidity If the real wage is stuck above the eq’m level, then there aren’t enough jobs to go around. Then, firms must ration the scarce jobs among workers. Structural unemployment: the unemployment resulting from real wage rigidity and job rationing. slide 6
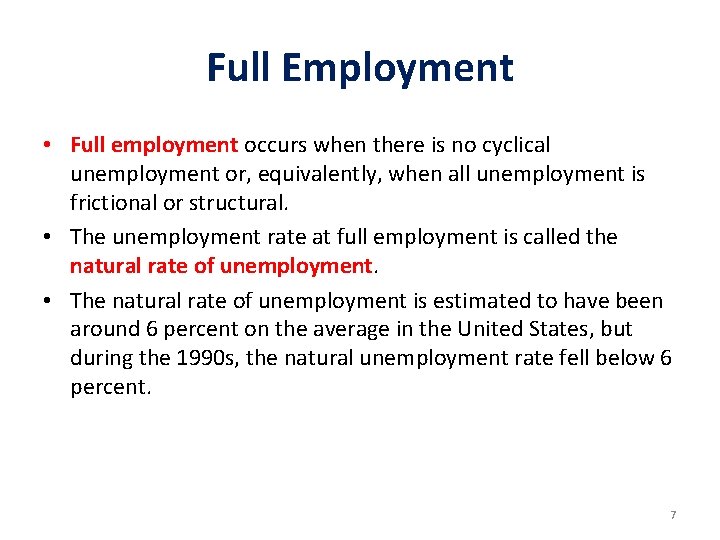
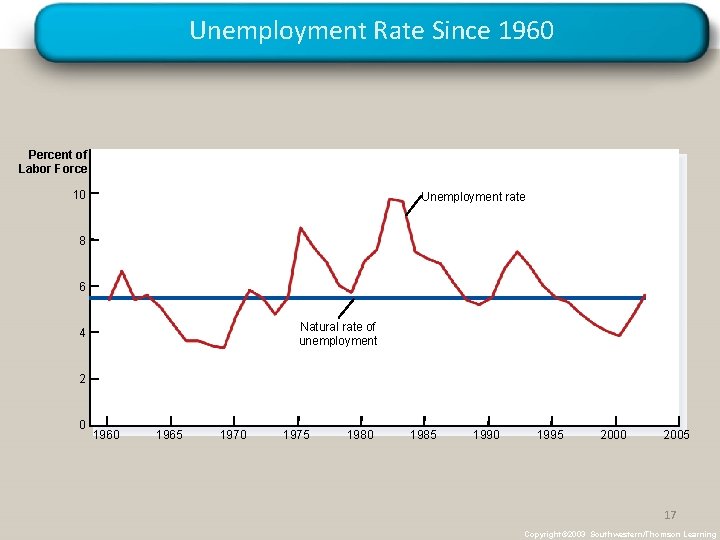
Full Employment • Full employment occurs when there is no cyclical unemployment or, equivalently, when all unemployment is frictional or structural. • The unemployment rate at full employment is called the natural rate of unemployment. • The natural rate of unemployment is estimated to have been around 6 percent on the average in the United States, but during the 1990 s, the natural unemployment rate fell below 6 percent. 7
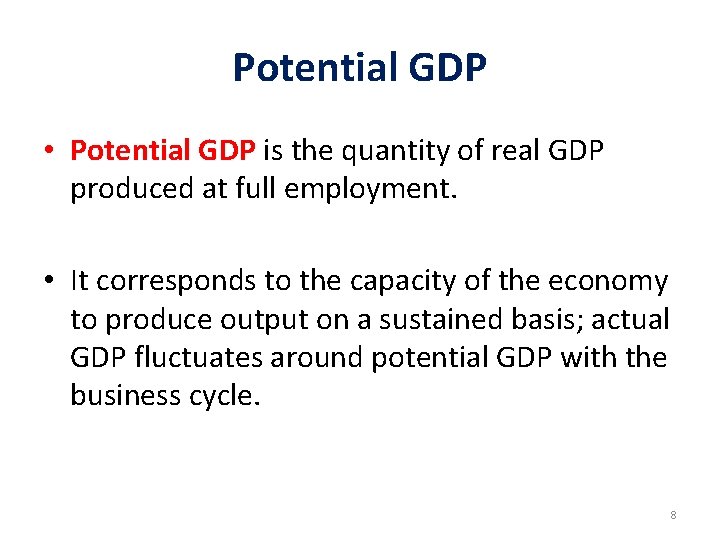
Potential GDP • Potential GDP is the quantity of real GDP produced at full employment. • It corresponds to the capacity of the economy to produce output on a sustained basis; actual GDP fluctuates around potential GDP with the business cycle. 8
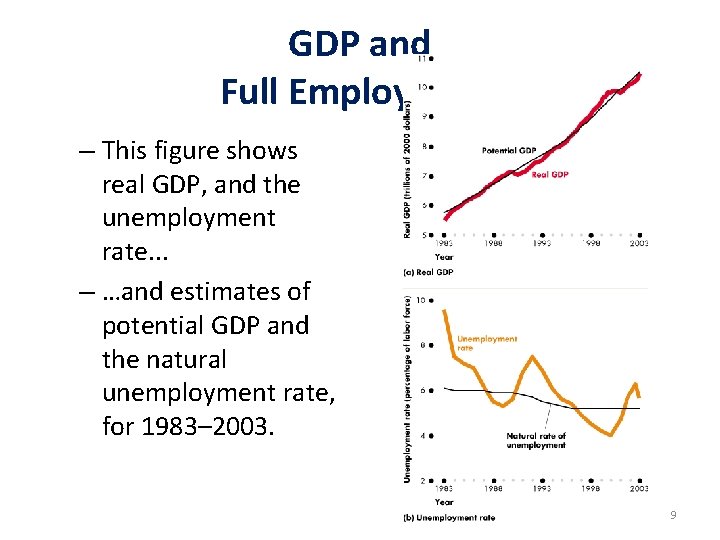
GDP and Full Employment – This figure shows real GDP, and the unemployment rate. . . – …and estimates of potential GDP and the natural unemployment rate, for 1983– 2003. 9
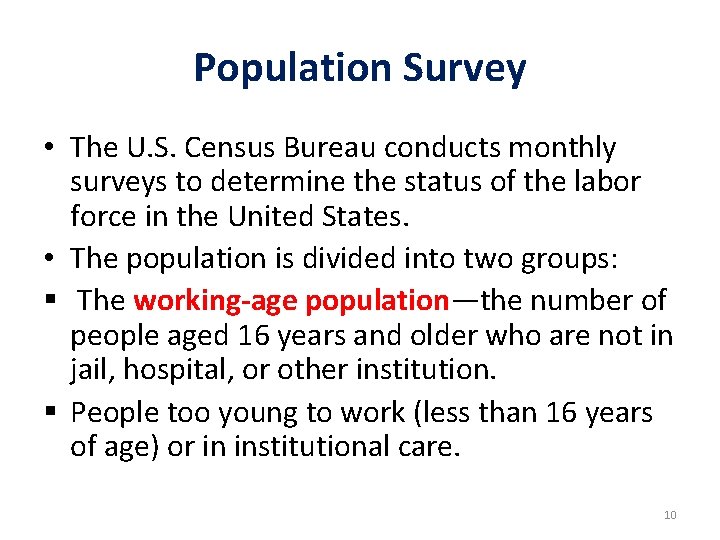
Population Survey • The U. S. Census Bureau conducts monthly surveys to determine the status of the labor force in the United States. • The population is divided into two groups: § The working-age population—the number of people aged 16 years and older who are not in jail, hospital, or other institution. § People too young to work (less than 16 years of age) or in institutional care. 10
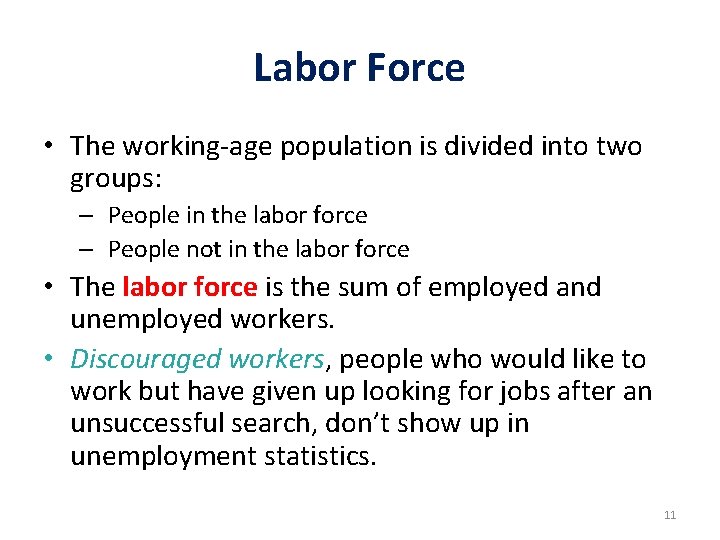
Labor Force • The working-age population is divided into two groups: – People in the labor force – People not in the labor force • The labor force is the sum of employed and unemployed workers. • Discouraged workers, people who would like to work but have given up looking for jobs after an unsuccessful search, don’t show up in unemployment statistics. 11
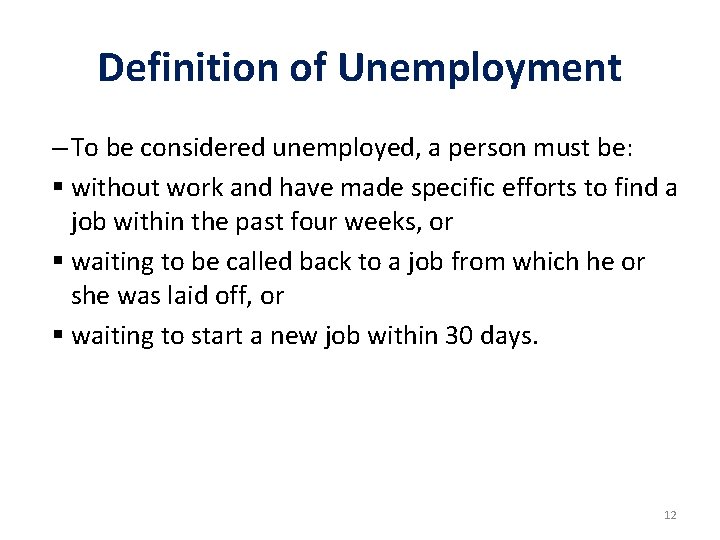
Definition of Unemployment – To be considered unemployed, a person must be: § without work and have made specific efforts to find a job within the past four weeks, or § waiting to be called back to a job from which he or she was laid off, or § waiting to start a new job within 30 days. 12
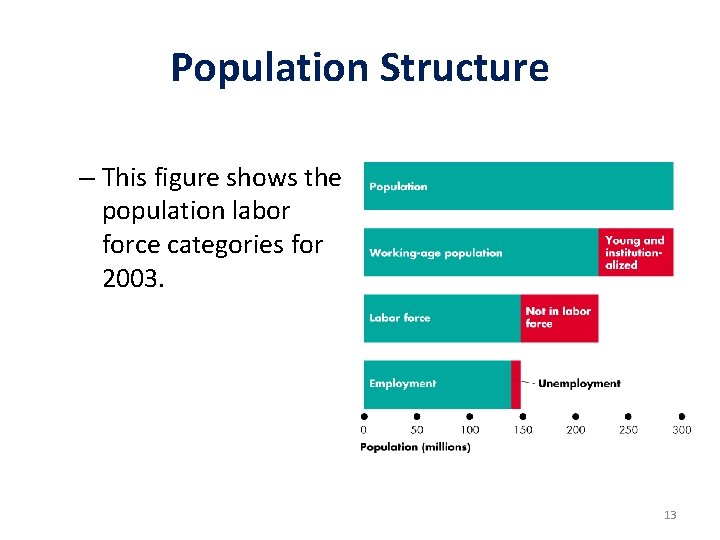
Population Structure – This figure shows the population labor force categories for 2003. 13
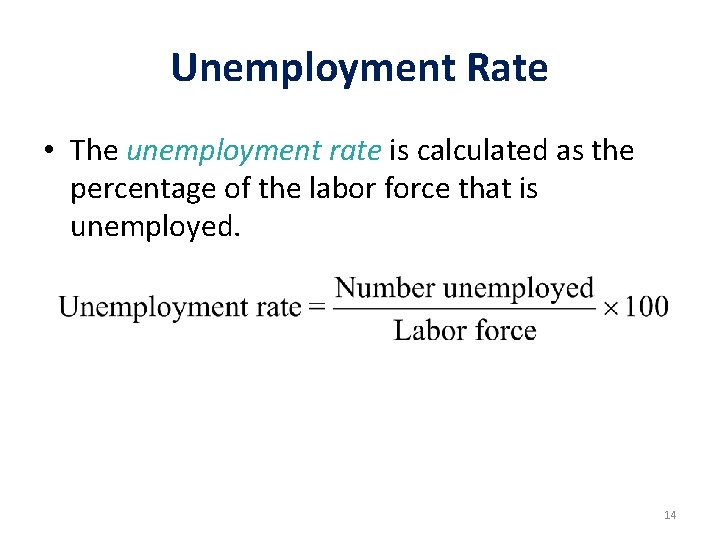
Unemployment Rate • The unemployment rate is calculated as the percentage of the labor force that is unemployed. 14
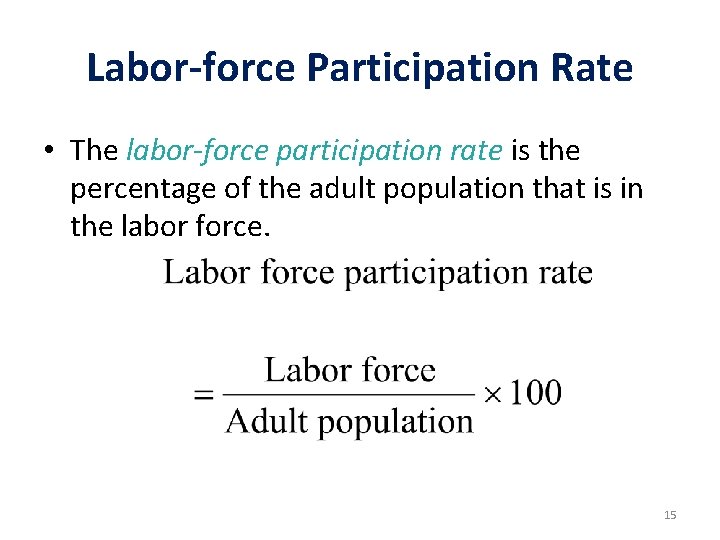
Labor-force Participation Rate • The labor-force participation rate is the percentage of the adult population that is in the labor force. 15
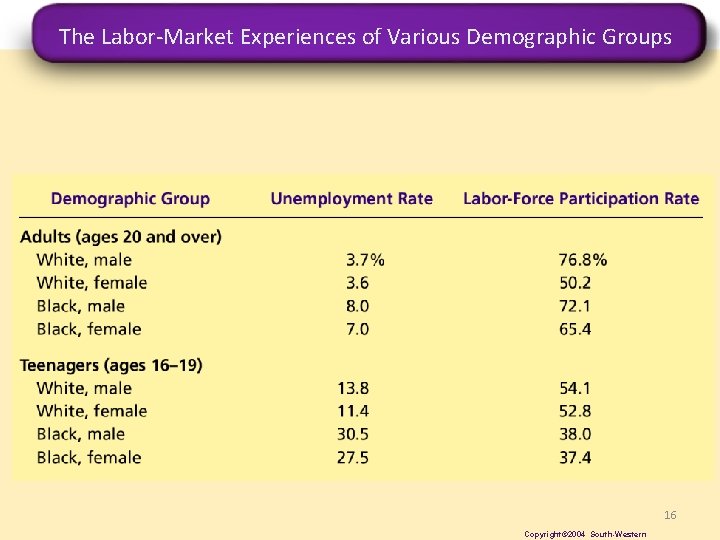
The Labor-Market Experiences of Various Demographic Groups 16 Copyright© 2004 South-Western
Unemployment Rate Since 1960 Percent of Labor Force 10 Unemployment rate 8 6 Natural rate of unemployment 4 2 0 1965 1970 1975 1980 1985 1990 1995 2000 2005 17 Copyright© 2003 Southwestern/Thomson Learning
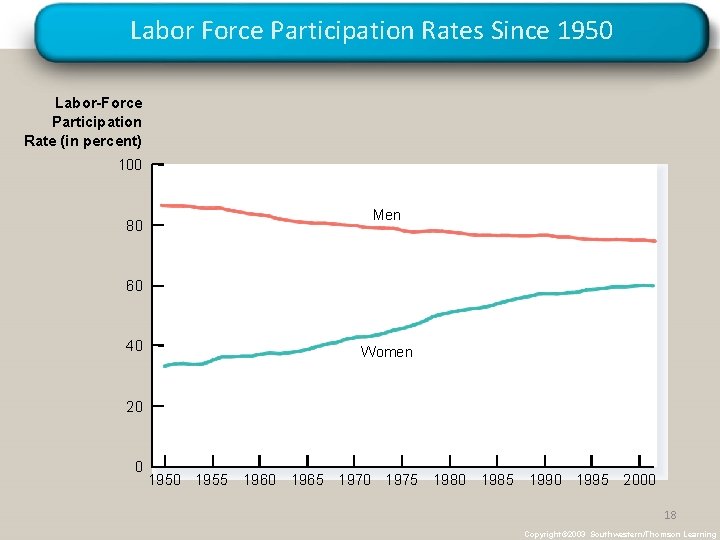
Labor Force Participation Rates Since 1950 Labor-Force Participation Rate (in percent) 100 80 Men 60 40 Women 20 0 1955 1960 1965 1970 1975 1980 1985 1990 1995 2000 18 Copyright© 2003 Southwestern/Thomson Learning
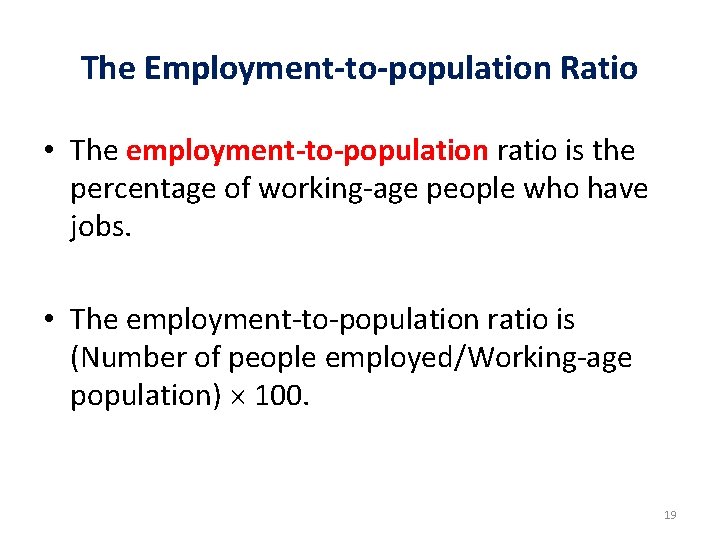
The Employment-to-population Ratio • The employment-to-population ratio is the percentage of working-age people who have jobs. • The employment-to-population ratio is (Number of people employed/Working-age population) 100. 19
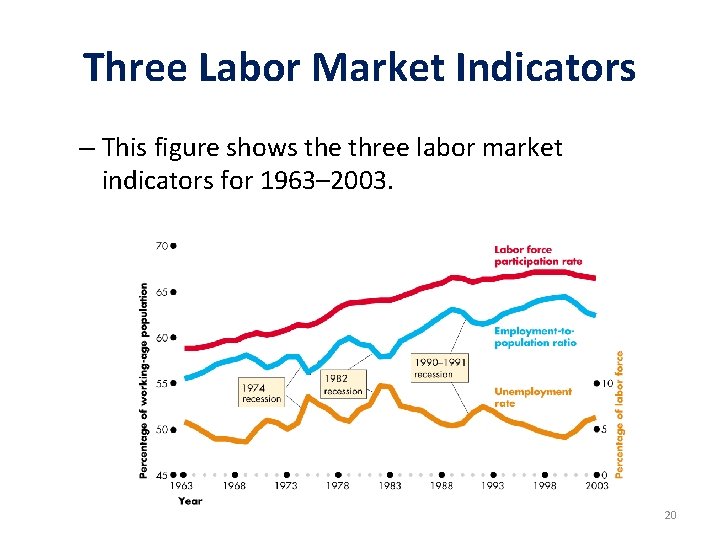
Three Labor Market Indicators – This figure shows the three labor market indicators for 1963– 2003. 20
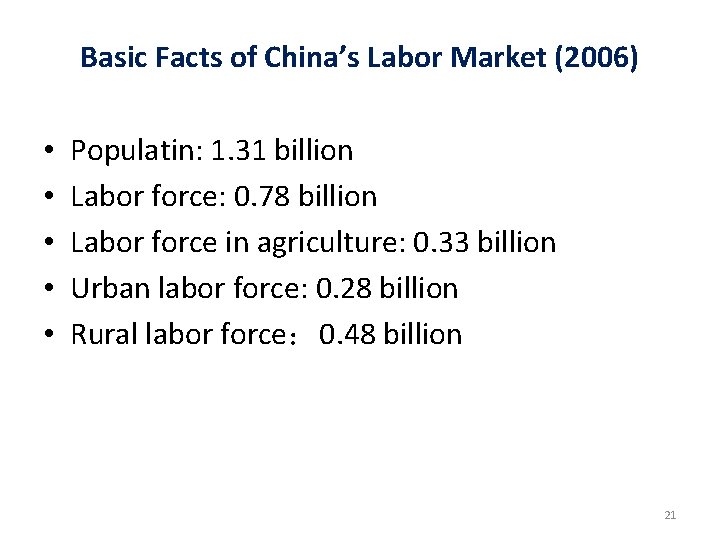
Basic Facts of China’s Labor Market (2006) • • • Populatin: 1. 31 billion Labor force: 0. 78 billion Labor force in agriculture: 0. 33 billion Urban labor force: 0. 28 billion Rural labor force: 0. 48 billion 21
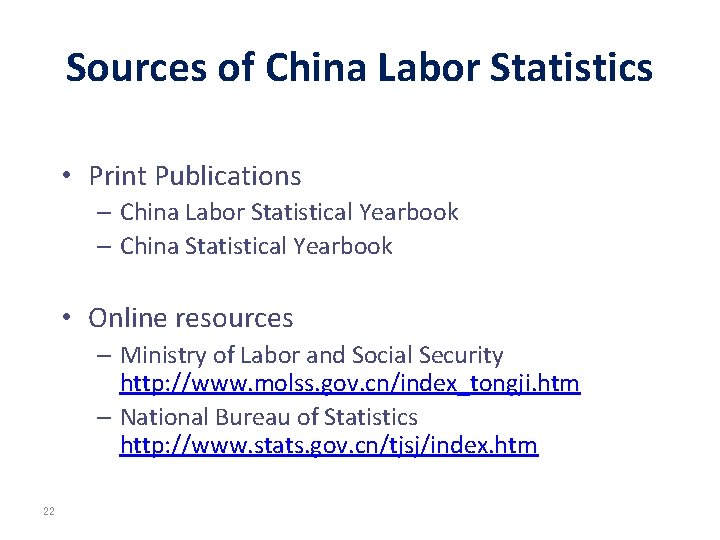
Sources of China Labor Statistics • Print Publications – China Labor Statistical Yearbook – China Statistical Yearbook • Online resources – Ministry of Labor and Social Security http: //www. molss. gov. cn/index_tongji. htm – National Bureau of Statistics http: //www. stats. gov. cn/tjsj/index. htm 22
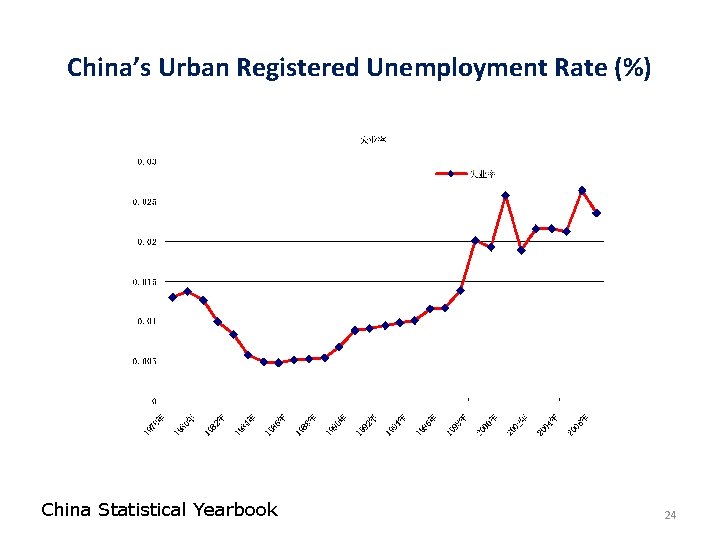
Measure China’s Unemployment • The only indicator is urban registered unemployment rate • Unemployment seriously underestimated because – Rural implicit unemployment is not taken into account – Laid-off workers are not taken into account 23
China’s Urban Registered Unemployment Rate (%) China Statistical Yearbook 24
Unemployment of Agricultural Labor and Migrant Labor • Agricultural unemployment: implicit, hard to account for • Unemployment of migrant labor: due to the financial crisis, about one third lost their jobs 25
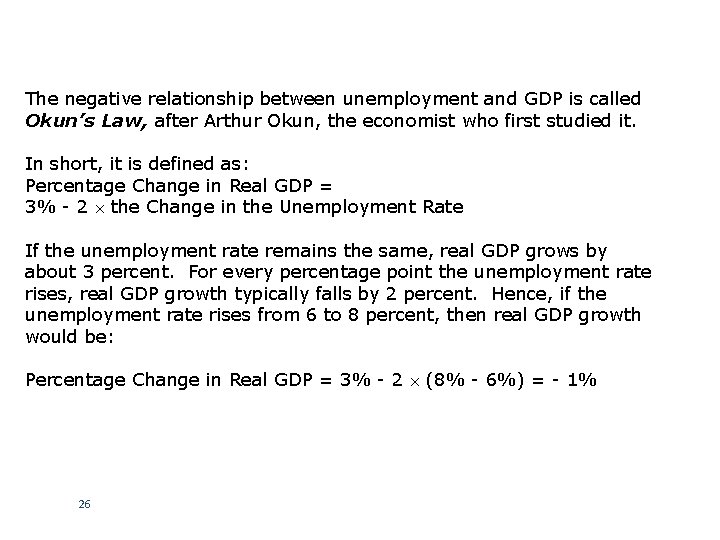
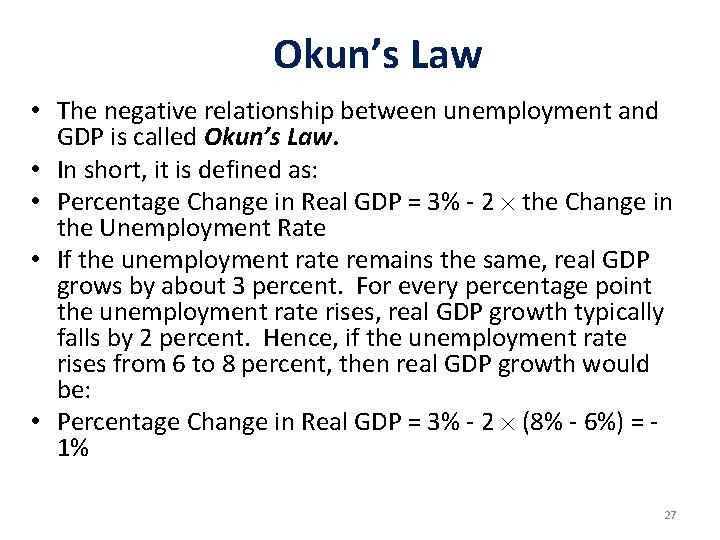
The negative relationship between unemployment and GDP is called Okun’s Law, after Arthur Okun, the economist who first studied it. In short, it is defined as: Percentage Change in Real GDP = 3% - 2 the Change in the Unemployment Rate If the unemployment rate remains the same, real GDP grows by about 3 percent. For every percentage point the unemployment rate rises, real GDP growth typically falls by 2 percent. Hence, if the unemployment rate rises from 6 to 8 percent, then real GDP growth would be: Percentage Change in Real GDP = 3% - 2 (8% - 6%) = - 1% 26
Okun’s Law • The negative relationship between unemployment and GDP is called Okun’s Law. • In short, it is defined as: • Percentage Change in Real GDP = 3% - 2 the Change in the Unemployment Rate • If the unemployment rate remains the same, real GDP grows by about 3 percent. For every percentage point the unemployment rate rises, real GDP growth typically falls by 2 percent. Hence, if the unemployment rate rises from 6 to 8 percent, then real GDP growth would be: • Percentage Change in Real GDP = 3% - 2 (8% - 6%) = 1% 27
Why Unemployed • In an ideal labor market, wages would adjust to balance the supply and demand for labor, ensuring that all workers would be fully employed. 28
Reasons of Unemployment – Minimum-wage laws – Unions – Efficiency wages 29
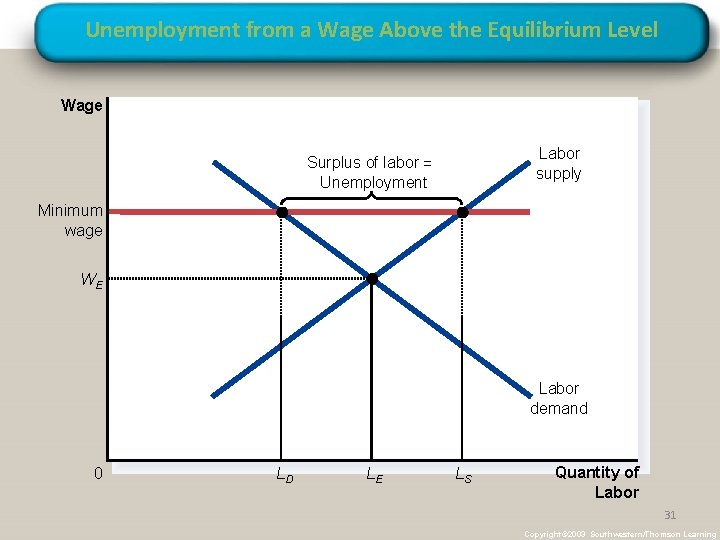
Minimum-wage Laws • When the minimum wage is set above the level that balances supply and demand, it creates unemployment. 30
Unemployment from a Wage Above the Equilibrium Level Wage Labor supply Surplus of labor = Unemployment Minimum wage WE Labor demand 0 LD LE LS Quantity of Labor 31 Copyright© 2003 Southwestern/Thomson Learning
Unions And Collective Bargaining • A union is a worker association that bargains with employers over wages and working conditions. • In the 1940 s and 1950 s, when unions were at their peak, about a third of the U. S. labor force was unionized. • A union is a type of cartel attempting to exert its market power. • The process by which unions and firms agree on the terms of employment is called collective bargaining. • Collective bargaining and strikes makes some workers better off and other workers worse off. 32
The Theory Of Efficiency Wages • Efficiency wages are above-equilibrium wages paid by firms in order to increase worker productivity. • A firm may prefer higher than equilibrium wages for the following reasons: – Worker Health: Better paid workers eat a better diet and thus are more productive. – Worker Turnover: A higher paid worker is less likely to look for another job. – Worker Effort: Higher wages motivate workers to put forward their best effort. – Worker Quality: Higher wages attract a better pool of workers to apply for jobs. 33
Question: should we force firms to raise wages of migrant labor? • Humanistic view: Yes, we should care about the welfare of migrant labor • Economic view: No – Do not distort price signal! – If we raise the wage higher than the equilibrium wage, this reduces the demand, and prevents further migration and poverty reduction 34