LAASHE Secondary Headteachers Wednesday 10 th May 2017


 students")


 Cost £ 16, 500")


 5 A*-C inc.")


 was")


- Slides: 52
LA/ASHE Secondary Headteachers Wednesday 10 th May, 2017 Dr Martina Lecky, Headteacher, Ruislip High School, since 2011
Evaluation of intervention and PP funding from a leadership perspective
London Borough of Hillingdon Ruislip High School Opened in 2006
School demographics • Number of students: 1, 050 • Number of girls: 51% • Students eligible for FSM: 20. 4% • % of ethnic minorities: 35. 8% • % of pupils with a SEN statement or EHC plan: 1. 9% • School deprivation indicator: 0. 14 (national 0. 20)
Section 8 Ofsted inspection, May 2015 5 A*-C inc. English and mathematics 2013 No. of students 2014 No. of students % % 27 41 National other 67 62 Gap -26 -29 Disadvantaged 27 33
Main recommendations: • Development of a coherent strategic plan to raise the achievement of disadvantaged students in relation to their peers and others nationally, rapidly. This needs to include clear indicators of success and timescales so that leaders and governors can monitor and evaluate the impact of pupil premium expenditure effectively. The plan needs to be developed and implemented with the utmost urgency. • Leaders should review systems for quality assurance to ensure they have greater confidence in the accuracy and reliability of teacher assessments.
Paradigm shift
FSM by ethnicity 2004 -2014 FSM - Girls 90 90 80 80 % achieving 5+GCSE A*-C grades (Incl En & Ma) % achieving 5+GCSE A*-C (Incl English & Maths) FSM - Boys 70 60 50 40 30 20 10 0 2004 2005 2006 2007 2008 2009 2010 2011 2012 2014 White British Indian Bangladeshi Black Caribbean White Other groups Pakistani Chinese Mixed White & Caribbean 70 60 50 40 30 20 10 0 2004 2005 2006 2007 2008 2009 2010 2011 2012 2013 2014 White British Indian Bangladeshi Black Caribbean White Other groups Pakistani Chinese Mixed White & Caribbean
Look at the evidence and good practice
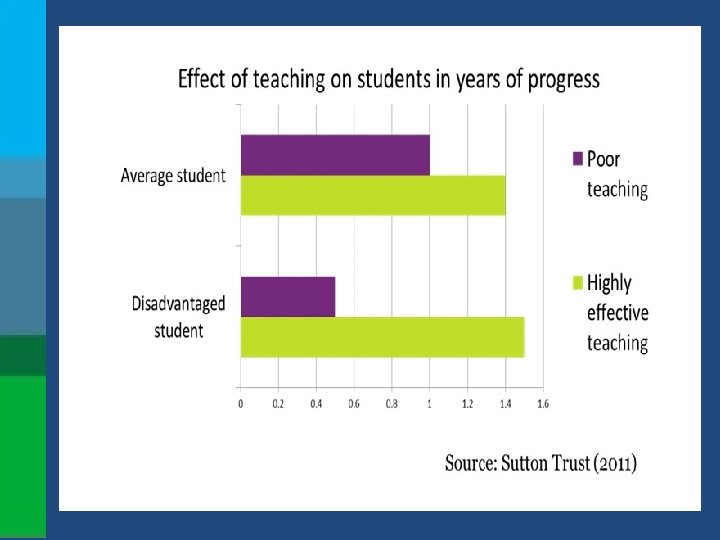
Recommendations from research
Recommendations from research by the National Education Trust • Be explicit about what you are trying to achieve and by when. ‘Improve numeracy levels’ is not clear enough. Hold yourself to account for this. • Strong values and moral purpose agreed across a whole school are key. Disadvantaged learners need a great experience at school in both structured and unstructured times during the school day. Ensure that disadvantaged leaners play a role in wider school life. • Disadvantaged learners are most successful where teachers in the classroom feel accountable for their outcomes.
Recommendations from research by Lambeth Local Authority • Strong leadership; • High-quality teaching and learning; • Effective use of pupil premium to challenge poverty through extensive use of the best teachers to teach intervention groups, or re-deploy support teachers who have a good track record in raising achievement.
Strategic Action Plan Whole-school targets 1. Whole-school approach including targets 2. Intervention 3. Methodology to measure and evaluate impact 4. Staff funded through PP 5. Evaluation report for governors 6. Examples of progress data
Strategic Action Plan Whole-school targets 1. Whole-school approach including targets 2. Intervention 3. Methodology to measure and evaluate impact 4. Staff funded through PP 5. Evaluation report for governors 6. Examples of progress data
1. Whole-school approach including targets Core principles We believe all students should be able to fulfil their potential irrespective of any barriers to learning. We believe intervention is important to support students with low levels of literacy and/or numeracy. We believe intervention needs to be led by classroom teachers through a co-ordinated and strategic leadership approach. We believe intervention should be preventative from the outset, eg. anticipating the types of students who are likely to struggle with different topics and concepts. We believe intervention should be the responsibility of staff at Ruislip High School and ideally should not require external support.
1. Whole-school approach including targets Core principles • We believe intervention should have measurable success criteria, including students’ attainment and achievement, engagement in extra-curricular activity attendance, and attitude to learning as well as parental engagement. • We believe barriers can be overcome through planned and targeted intervention with measurable outcomes. • We believe it is vital to monitor and evaluate intervention to ensure the model is flexible and responsive to the needs of students. • We believe parental engagement is vital to ensure intervention is sustained, and has a long-term impact.
1. Whole-school approach including targets Area Target Attendance 95% for all disadvantaged (DA) students Progress 5 A*-C in EM. DA students should be within 5% of non-DA students at RHS and within 5% of other students nationally. 3 and 4 levels of progress in English and mathematics – DA students should be within 5% of other students nationally. Literacy and numeracy intervention Numeracy: 90% of students who undertake an intervention to increase baseline score by a minimum of additional 50% and an increase of baseline score to be substantial one and six months after intervention has taken place. Sanctions and rewards Raise the overall average number of DA students that attend the reward trip from 30. 94% to 53. 22%; increase the amount of reward wheels awarded to DA students to demonstrate a positive difference when compared to other students; sanction data for DA students to be reduced and in line with other students.
1. Whole-school approach including targets Area Target Students’ confidence and resilience Positive attitudinal data for DA students for all year groups and action plan agreed for specific areas of concern. Parental engagement To increase the overall average number of parents of DA students that attend parents’ evening from 66. 8% to 100%. Residential trips 100% of DA students to attend the Isle of Wight trip in Year 7
Strategic Action Plan Whole-school targets 1. Whole-school approach including targets 2. Intervention 3. Methodology to measure and evaluate impact 4. Staff funded through PP 5. Evaluation report for governors 6. Examples of progress data
2. Intervention
Strategic Action Plan Whole-school targets 1. Whole-school approach including targets 2. Intervention 3. Methodology to measure and evaluate impact 4. Staff funded through PP 5. Evaluation report for governors 6. Examples of progress data
3. Methodology to measure and evaluate impact 1. Background 2. Students involved 3. Brief description of the intervention and staff involved 4. Outcome of the intervention 5. Commentary on the results 6. Conclusion and evaluation 7. Recommendations
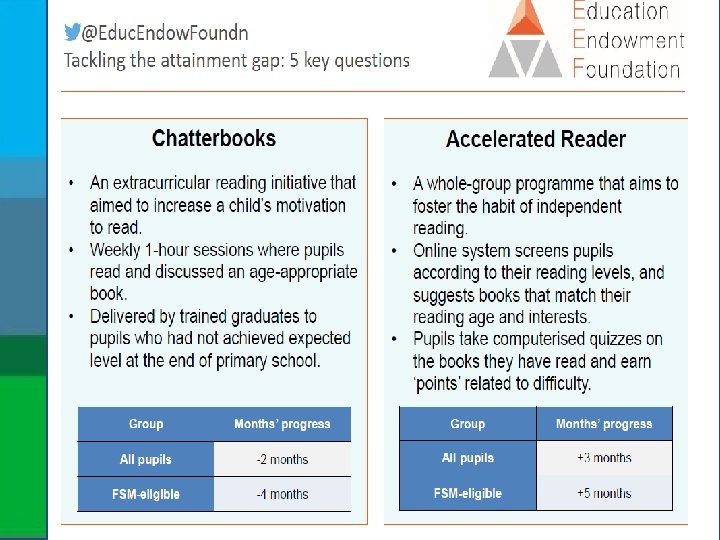
3. Methodology to measure and evaluate impact Accelerated reader Background A significant number of students join RHS in Year 7 with reading ages below their chronological age. These students will therefore find it more difficult to access the curriculum across the school as they are less able to read the texts given. Students involved 21 Year 7 students are part of Accelerated Reader. They all have reading ages below 10 years ranging from 6 years and 2 months through to 8 years and 10 months. Of the 21 students, 8 are known to be disadvantaged. 11 of the students are boys and 10 are girls. Description Students are in groups of around seven and meet with Catherine Caesar (CCA), the Literacy Higher Level Teaching Assistant for 30 minutes every day in the LRC. During this time, they read books designated as suitable for their current reading age. They are also expected to read for ten minutes every evening with their parent/guardian’s supervision. Each time they finish a book, they take an online comprehension quiz which checks that they have understood what they have read and works out their new reading age. The students will continue having this intervention until their reading age improves to match their chronological age.
3. Methodology to measure and evaluate impact Outcome of the intervention Table 43: a summary of the improvement of reading ages of students taking part in Accelerated Reader Average improvement 11. 8 months Boys’ average improvement 10 months Girls’ average improvement 13. 7 months Disadvantaged students’ average improvement 7 months Other students’ average improvement 14 ½ months
3. Methodology to measure and evaluate impact Following half a term of the intervention, it can be seen that students’ reading ages have improved, on average, by nearly a year. There were four students who did not improve their reading ages at all. DA students’ reading ages have improved, on average, by seven months with other students’ reading ages improving, on average, by just over 14 and a half months. The intervention has seen girls improve their reading ages by, on average, 13. 7 months with boys improving their reading ages, on average, by 10 months. Full details can be seen in Table 43. Commentary This shows that nearly all students have made progress and improved their reading ages. The average reading age for Year 7 is 12 years 6 months and these students are moving towards this average. Attendance at the 30 -minute daily sessions is clearly crucial; the four students who have not improved their reading ages have missed a number of sessions (due to absence from school rather than not attending the sessions) whilst the students who have made more progress have attended more sessions. DA students have seen their reading ages improve significantly in a short amount of time but other students’ reading ages have improved twice as much. This could be because of the support at home; part of Accelerated Reader involves students reading at home for ten minutes every day with the support of their parents and it is likely that the other students are more proactive at this. CCA has implemented strategies to assist with this such as: creating reading logs for parents to fill out at home; writing letters home; calling parents to give them updates; and creating the ‘Parent and I’ reading challenge over half term.
3. Methodology to measure and evaluate impact Conclusion and Evaluation Accelerated Reader is having an impact on students’ reading ages. CCA has ensured that the programme is tightly run and the sessions are productive and enjoyable; students want to attend and they report that they enjoy reading at home. CCA continues to work on strategies to ensure students attend each session and to engage parents to read at home. One issue has been with other teachers whose lessons the students are missing. Whilst teachers understand that students need to improve their reading ages to access all areas of the curriculum, it has been felt that students missing 30 minutes of period one each day impacts on some subjects more than others. Recommendations • • • To continue with the programme as it currently stands, although move the session times each term to avoid students missing part of the same subject throughout the year To continue to trial strategies to improve attendance and reading at home through parental engagement To ensure that the improvements are sustained
Strategic Action Plan Whole-school targets 1. Whole-school approach including targets 2. Intervention 3. Methodology to measure and evaluate impact 4. Staff funded through PP 5. Evaluation report for governors 6. Examples of progress data
4. Impact of staff funded through Pupil Premium • Family-liaison officers ( two x 0. 5 fte) £ 32 k • Assistant Heads of Year ( five x TLR 2 a) £ 16, 500 • One-to-one tutors in English and mathematics £ 30 k • HLTAs – literacy and numeracy £ 60 k
Pupil Premium
4. Staff funded through Pupil Premium Staff Impact Family-liaison officers • • Assistant Heads of Year • • One-to-one tutors HLTAs • • • Evaluation Improvement in DA students’ attendance and engagement of hardto-reach families A reduction in sanctions for DA students • Significant improvement in attendance of DA and other students Significant improvements in rewards and reduction in sanctions (Year 8, 9 and 10 – virtually no difference) Little impact with parental engagement in terms of parents’ evening Some impact with residential trips • • Narrowing the gap with attainment • test DA students make less progress than other students involved in intervention Greatest impact has been accelerated reading – most students are now at their chronological age Evidence is case-study based and therefore difficult to generalise Progress with the most hard-toreach families is less transformational Positions will be kept for Sept 20162017 because of the impact on attendance A different approach to parental engagement is required for parents’ evenings The barriers for residential trips are clearly deep-rooted and require further consideration Group work has less impact than one-to-one work
Role % Salary Assistant 100% Heads of Year (AHo. Ys) Cost £ 16, 500 PP role To report on a termly basis regarding the progress of DA students in their respective year group To monitor and improve attendance of DA students in their year group To increase parental involvement of DA parents in their year group Success criteria A termly report is produced that outlines the intervention that has taken place Overall DA year group attendance increases to 95% There is a clear and measurable increase in the percentage of DA students attending school parents’ evenings Monitoring points A termly report is produced that outlines the intervention that has taken place Half-termly meetings are held to monitor the progress of DA students and review intervention strategies Attendance is monitored on a weekly basis and reported to governors once a term An analysis of DA attendance is carried out following each parents’ evening Impact Evaluation Based on the impact of the AHo. Ys, in particular the attendance data, the SLT is committed to retaining these roles in the pastoral system. There is clearly more work to do. Attendance of DA students at parents’ evening remains an area the school is committed to targeting while the half-termly meetings to monitor DA progress proved very effective but a greater degree of consistency is needed across all year groups. A new approach will be launched in September 2016 that will be co -ordinated by the Associate Assistant Headteacher. The AHo. Y have had a significant impact in raising the attendance and achievement of DA students across the school. The termly reviews written by each AHo. Y reflect the personalised approach adopted by the staff and the impact of a number of schemes including the: Keep it 100 Return to school forms Breakfast club VIP club (For a more detailed summary of the impact of the above initiatives please refer to pages 19 -27 of Appendix 3) Overall DA attendance increased by 1. 1% over the academic year and reached an impressive average of 94. 68%.
Strategic Action Plan Whole-school targets 1. Whole-school approach including targets 2. Intervention 3. Methodology to measure and evaluate impact 4. Staff funded through PP 5. Evaluation report for governors 6. Examples of progress data
5. Evaluation report for governors Executive summary 1 a. Disadvantaged students’ data compared with other students 1 b. Destination data 2. Year group data on attendance, behaviour, rewards and parental engagement 3. Review of interventions
Strategic Action Plan Whole-school targets 1. Whole-school approach including targets 2. Intervention 3. Methodology to measure and evaluate impact 4. Staff funded through PP 5. Evaluation report for governors 6. Examples of progress data
6. Examples of data Summary of attendance: DA versus other students for each year group 2014 -2015 Whole year (September - July) DA % Other students % Difference % Year 7 95. 50 97. 18 1. 68 Year 8 94. 93 96. 21 1. 28 Year 9 93. 96 96. 02 2. 06 Year 10 90. 82 96. 48 5. 66 Year 11 90. 30 94. 63 4. 33 Total 93. 10 96. 10 3. 00 2015 -2016 Whole year (September - July) Other students % DA % Difference % Year 7 95. 11 97. 05 1. 94 Year 8 95. 26 96. 82 1. 56 Year 9 95. 38 96. 36 0. 98 Year 10 93. 30 96. 31 3. 01 Year 11 92. 67 95. 67 3. 00 Total 94. 56 96. 45 1. 89 Overall improvement in gap: 1. 11%
Headline figures – attainment (all 2014 data refers to first entry) 5 A*-C inc. English and mathematics 2014 No. of students Disadvantaged National other Gap 2015 No. of students % 2016 No. of students % % 27 33 20 50 20 57 62 63 63 -29 -13 -6
Developments 2016 onwards
Learning without labels School leaders and governors should ensure that: “No excuses” • the progress of disadvantaged students is a key whole-school priority with clearly defined roles and responsibilities including link governors; • disadvantaged students have the most effective teachers; • parent engagement is established and maintained through a number of key staff; • a personalised approach is used and disadvantaged students are separated into meaningful categories which allows leaders to prioritise and target specific resources; • there is an effective methodology with a clear plan to measure the impact of interventions which includes comparative data; and • there are key individuals, eg. governors or outside mentors, who can support disadvantaged students with their future expectations.
Developments 2016 -2017 Three categories for DA students • Group 1 - There is no data and/or information that indicates any vulnerability, eg. attendance, progress data • Group 2 - There is data and/or information that indicates some vulnerability, eg. attendance, progress data AHo. Ys, PM data for teachers, termly year review meetings • Group 3 - hard-to-reach families with outside agency involvement FLOs and SLT AHo. Ys- trial projects Parents’ evenings • AHo. Ys – for parents’ evening, the appointments for DA students are now done before the ‘other’ students; this has led to an improvement in attendance with 100% attendance at the Year 9 options evening. Governors’ mentoring scheme • Nine DA students in Year 11 are being mentored weekly by three governors. Attendance and progress data is very encouraging.
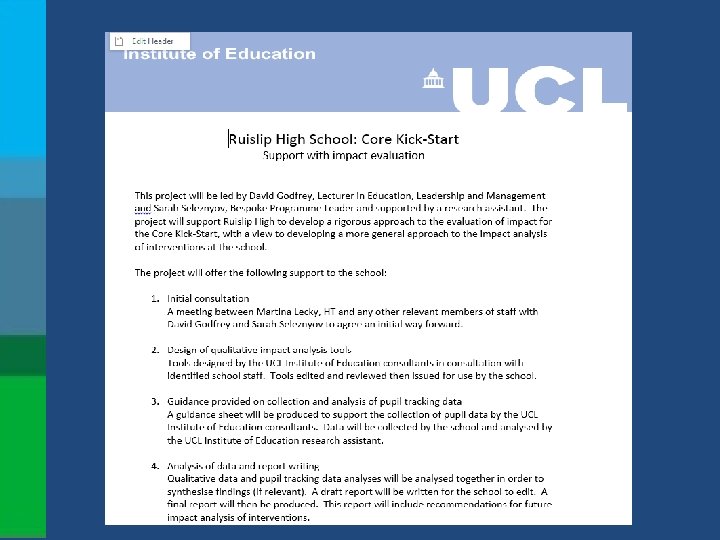
Developments 2017 -2018 • Alternative provision: in-house solution using two adjacent classrooms - trial since February has been successful using support staff (no additional cost - current staff). • Appointment of an intervention teacher (replacing HLTAs): low attaining Year 7 students based on KS 2 data to be withdrawn from computer science, geography and history for six periods a week, two per subject for intervention on literacy and numeracy (costs less than current HLTAs and one-year contract). • Commissioning the Io. E to compile a report on the effectiveness of CKS (£ 5 K).
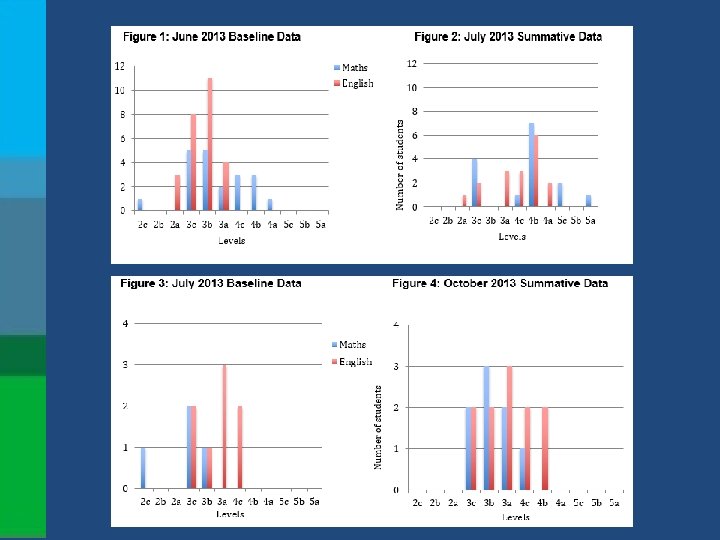
Core Kick Start – Year 6 into 7 transition programme Core Kick-Start (CKS) was launched in June 2013. Its task was to support underachieving incoming Year 7 students in English and mathematics through the transition period. Weekly workshops, in both subjects, were delivered to students by staff at RHS. Students were targeted using the most recent summative assessment data collected from their primary school; all students who attained a 4 c or below in Maths and/or English were invited to attend. Of the thirty-six students identified, thirty students attended the CKS programme in June 2013. To engage parents with the learning of their son/daughter, and to improve communication between school and home, parents were encouraged to attend the workshops with the students. This strategy proved highly successful.
Expectation and aspiration Changes in attitudes and behaviours between ages 14 and 16 are strongly associated with changes in educational attainment over the same period. For example, a substantial number of young people, particularly those from amongst the poorest families, stop thinking it likely that they will go to university between age 14 and age 16. These individuals make considerably less progress between Key Stage 3 and Key Stage 4 than others whose expectations for higher education remain more stable.
Neuroscience – teenage brain • “Dr Leah Somerville and her colleagues at Harvard found that as one grows from childhood to adolescence, the medial prefrontal cortex becomes more active in social situations, peaking at around fifteen years old. At this point social situations carry a lot of emotional weight, resulting in a self-conscious stress response of high intensity. ” Learnus and Jeremy Jones – talks in school for free on educational neuroscience Tuesday 10 th October: Teenage Brain conference, 3: 45 pm to 5: 45 pm at RHS; keynote speaker is Professor Michael Thomas
• • • The single most important thing is that teachers care about their students. Students need to know that their teachers care about them and believe in them - we can’t fake this as they will see through it. It is crucial for teachers to know some of the background of disengaged students ie a student’s father is in prison, a student’s mother has cancer. The best learning environment is when we take a holistic approach, where we are not just meeting a student’s learning needs but also his/her wider emotional and mental needs. Praise is key for these learners - and praise for even slight progress. These students need extra motivation – perhaps we could even ask them “who do you want to make proud and what would make them proud? " This could then be used to motivate and encourage the student. Ultimately it's that strong belief that all learners have potential and it is our role to tap into their potential. Some of the most gifted students tick in different ways; if we can help them tick we will see their potential realised. . . the next Alan Sugars might not come from Cambridge but could well be disengaged learners who just need their potential unlocked. Suzy Stride, City Gateway and local councillor
Summary from a leadership perspective • “No excuse” culture • Evidence – methodology • Best teachers • Evaluate the impact of staff and make changes • Personalised approach to students
Equality for DA students – the moral imperative to make a difference!