Introduction to Infrared Spectroscopy IR Excited electronic state


- Slides: 16

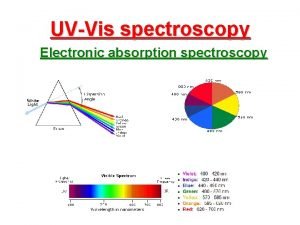
Introduction to Infrared Spectroscopy (IR) Excited electronic state Electronic transitions (uv-vis) 300 -800 nm A jump between electronic states 8 7 Mid-IR transitions (nm) 2500 -50, 000 nm 6 5 Ground electronic state 4 3 2 1 vibrational level UV-VIS vs IR effects Change of vibration level of atoms against each other (in the ground state, usually)

Energy of UV-VIS vs IR effects Energy scale UV-VIS mid IR , nm 300 -800 2500 -50, 000 , m 0. 3 -0. 8 2. 5 -50 300, 000 -100, 000 4000 -200 f(Hz) 1*1015 -3. 8*1014 1. 2*1014 -6*1012 E, kcal/mol 100 -38 11 -0. 6 Twinkie units 1 -0. 4 0. 1 -0. 005 1/ cm-1 E/photon = hf= 6. 62*10 -34 *f(Hz) in J f(Hz) = c/ = 3*108 / (m) => E/photon = hc/ = 1. 99*10 -25/ (m) E/mole = No* E/photon = 6. 02*1023*E/photon =3. 98*10 -10 *f(Hz) in Joules/mol= 0. 952*10 -13 * f(Hz) kcal/mol (see also p 431 or p. 147 of text) Unit of choice for UV-VIS Unit of choice for IR 1 Twinkie =100 kcal

IR of air …. What’s missing ? ? ? O 2, N 2, Ar missing ! (99. 6% of total)

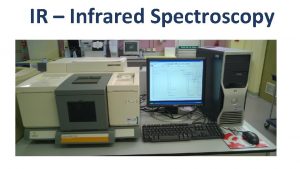
Double beam dispersion style IR (Perkin-Elmer 735 B “Curly”) 1) Globar source SKOOG pg 445 chopper 4) Detector (TC) 2) Reference and sample 3) Monochromator (standard echellette grating) Modulator compares sample vs ref and adjusts attenuators to null out difference. . current to do this is recorder on chart (slow)

IR LIGHT SOURCES GLOBAR source is modern (1100 o. C ) Si. C or similar refractory electrically heated with resistance wire (in grooves) Nernst glower (2000 o C) Now obsolete (Zr. O 2 or Th. O 2 filaments)

See figure 5. 9 and figure 16 -16 of text for outputs. Globar output is smooth and slow varying (good). Nernst glower decays to low cm-1 and has `holes’ in intensity

Bolometer detector for IR IR heats bit of metal at RB whose resistance changes and causes circuit to `unbalance’ from 0 IR light in resistance. Change in variable R to `re zero’ MA current is proportional to IR energy detected Variable R * *Leads for detector IR * What’s inside device (sort of) … Original design used for astronomy in telescopes to detect radio and IR radiation from stars etc. (Pierpont 1876 !)

Single beam Fourier Transform IR (FTIR) design (Nicolet SX 60) 2) Interferometer (conversion of IR time domain to mirror time domain) 1) Source (Globar or Nernst glower) 4) Transducer (photoconducting cell) 2) Laser source allows alignment and accurate positioning of interferometer 5)Compute runs FT conversion to frequency space computer 3) Sample cell (several kinds) pp 457 -9 SKOOG p. 443

Deuterated Tri. Glycine Sulfate (DTGS) or Tri. Glycine Sulfate (TGS) detectors are `pyroelectric’ IR transducers (=detectors) operated near room temperature ASC IR uses DTGS Structure is particularly sensitive to expansion when heated even a little

Deuterated Tri. Glycine Sulfate (DTGS) or Tri. Glycine Sulfate (TGS) detectors are `pyroelectric’ IR transducers (=detectors) operated near room temperature How they work. . See also page 451 IR light causes entire crystal to heat, causing physical expansion along b axis which creates slight +…- separation and thus a voltage 1) IR in DTGS + Vout +…- reattract and DTGS returns to start 2 a) DTGS Transiently hot…expands* (quickly) 2 b) as expansion happens, +…- separation occurs across whole crystal *TGS’s special 2 c) voltage developed is amplified and measured (usually via capacitive methods) response to polarization

Dispersive vs FT Method Dispersive method FT Method • Double beam • Single beam • Uses grating monochromator • Monochromator replaced by interoferometer • Detector is temperature based (bolometer or thermocouple (slow) • Detector is photoconduction or pyorelectric based (fast) • Scan time ~ 2 min/scan • Scan time can be 0. 01 s/scan • Spectrum produced by synchronous motor nulls of reference vs sample • Spectrum mathematically extracted from `power spectrum’ via Fourier Transform method (computer)

IR from FT of Background (air) p. 445 Skoog

How FTIR works …a brief overview (pp 206 -211, section 7 I-2) Basic idea is to collect the complete interference pattern of sample and background (Power vs t) of all IR frequencies at once Mathematically deconvolute ratio Ps/PB Ps All wavelengths in IR sent at once through sample (S) and background (B) PB t t Interferogram of all wavelengths of sample and background (time domain) %T cm-1~frequency=f IR spectrum (frequency domain)

Example of Power spectrum of two wavelengths overlapped ~1014 =f Direct observation of P(t) not possible: detectors too slow

The Michelson-Morley Interferometer allows us to assign distances traversed to specific f f(obs) ~ distance ~ 10 -10 f See p. 209 Trick of interferometer is to slow down frequency of input energy to much slower rates tied to the rate of mirror motion

Time domain Single f two f Multiple f frequency domain obtained from FT deconvolution
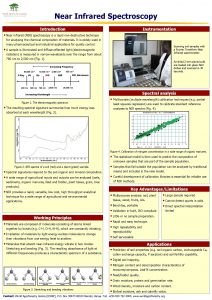
 Near infrared spectroscopy instrumentation
 Primary amine ir spectrum
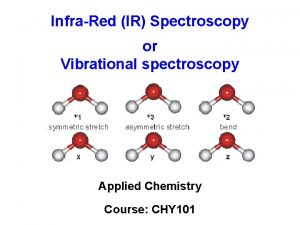
 Infrared spectroscopy theory
 Infrared spectroscopy ppt
 Spectroscopy infrared
 Orbital vs subshell
 Auxocromo
 Excited state electron configuration
 Ground vs excited state
 Bohr atom modeli
 How do electrons get excited
 Orbital diagram for ca
 An electronic is the electronic exchange of money or scrip
 Electronic field production examples
 Applications of uv visible spectroscopy
 Charge d'un électron
 Infrared vs bluetooth
