Introduction to Economic History Master APE PPD EHESS
 (EHESS & Paris School of Economics)")

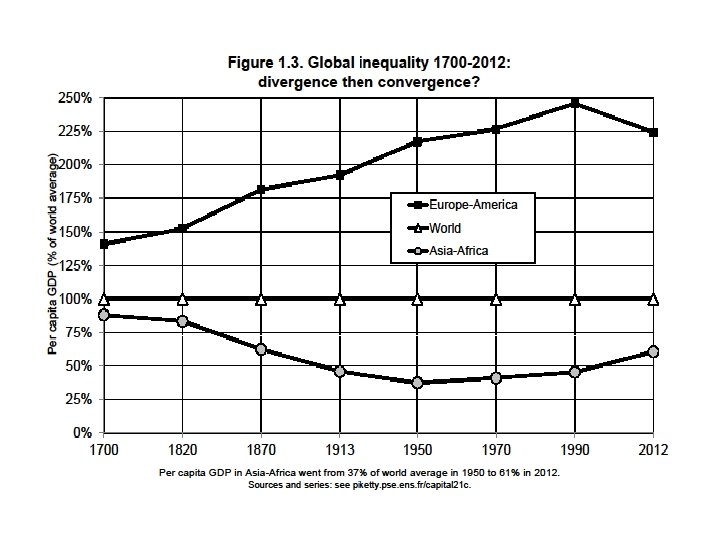
 Between-country income inequality 1700 -2015: divergence between Western")
")
 = gross foreign assets (gross assets owned")


 growth was exceptionally high in Europe and Japan")
 One")
 Free markets and private property sacralization during 19 c and early")
 Rise of emerging countries certainly benefited from market openess, but did")


, the fact that r>g is")
: WA=400 000€, WB=0€ • With free capital flows,")
: WA=600 000€, WB=-200 000€ (debt) • With")
- Slides: 57
Introduction to Economic History (Master APE & PPD) (EHESS & Paris School of Economics) Thomas Piketty Academic year 2017 -2018 Lectures 1 -2: Income, capital and growth in the long run: how did rich countries become rich ? (check on line for updated versions)
Roadmap of lectures 1 -2 Introduction: three U-shaped curves Basic concepts: output, income, capital National accounts: the measurement of growth Facts and questions about long-run growth How did rich countries become rich? A quick roadmap of the literature on comparative development and property regimes: Braudel, Pomeranz, Polanyi, and others • The standard growth model: output convergence, not income or wealth convergence • • •
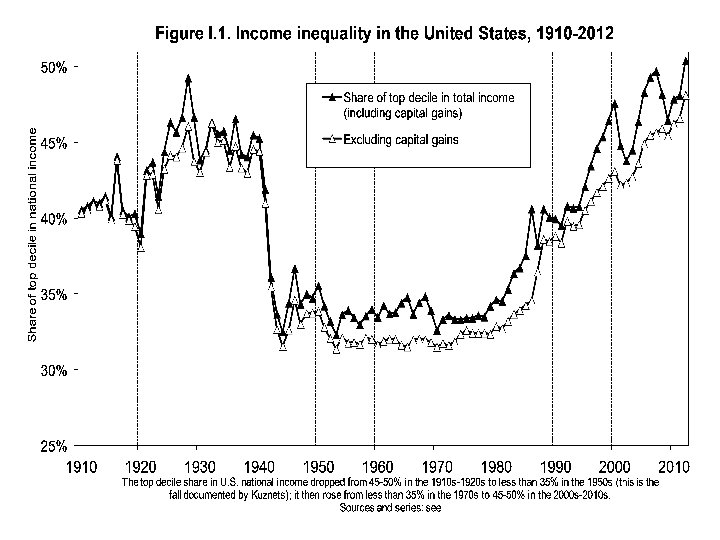
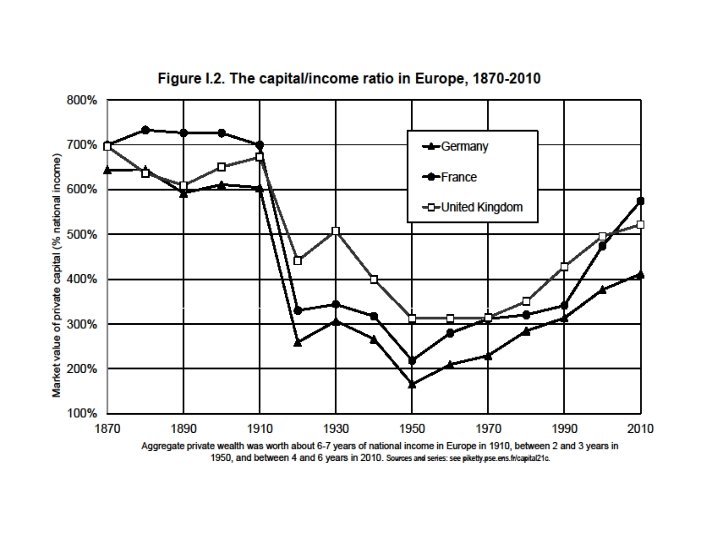
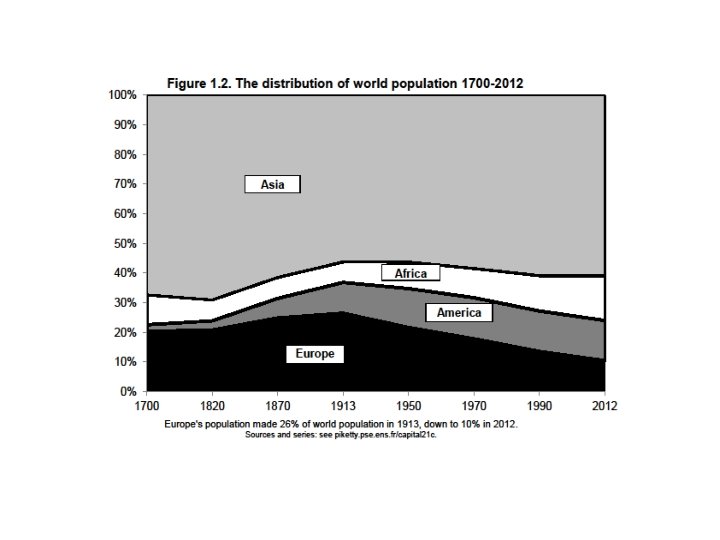
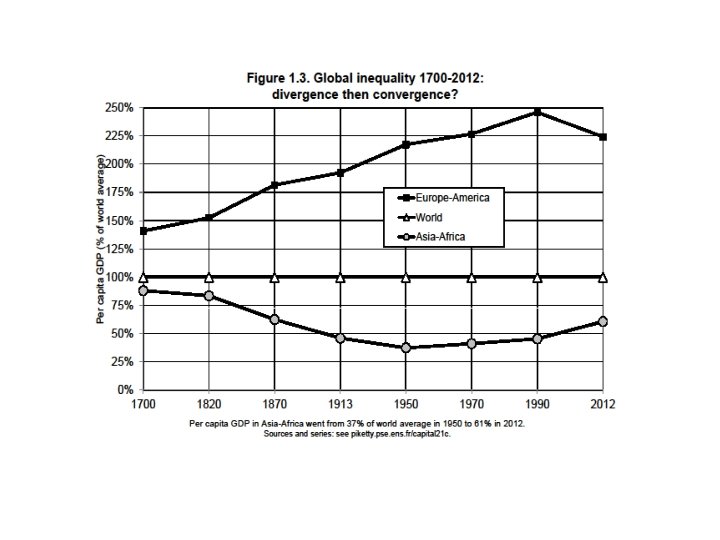
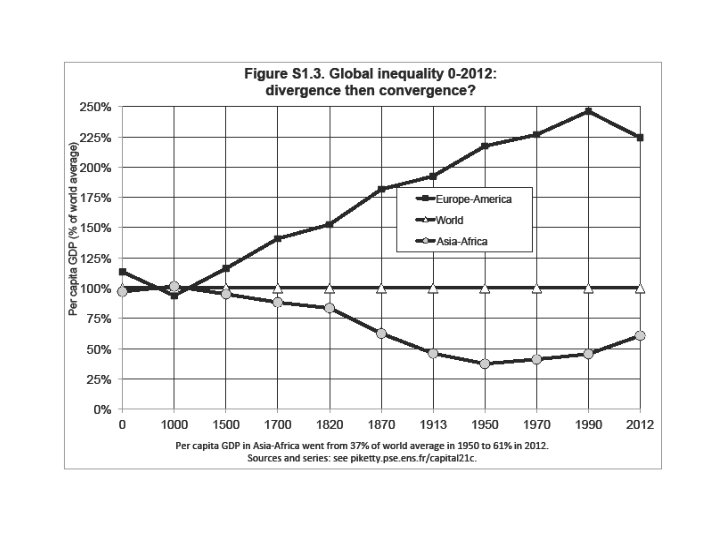
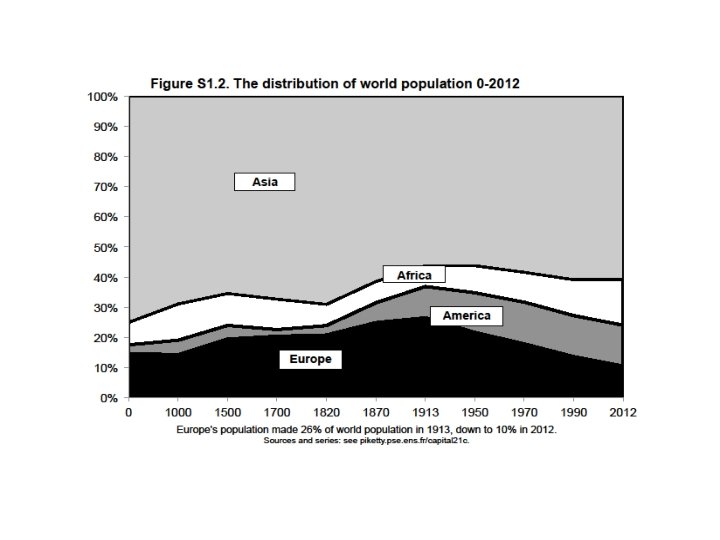
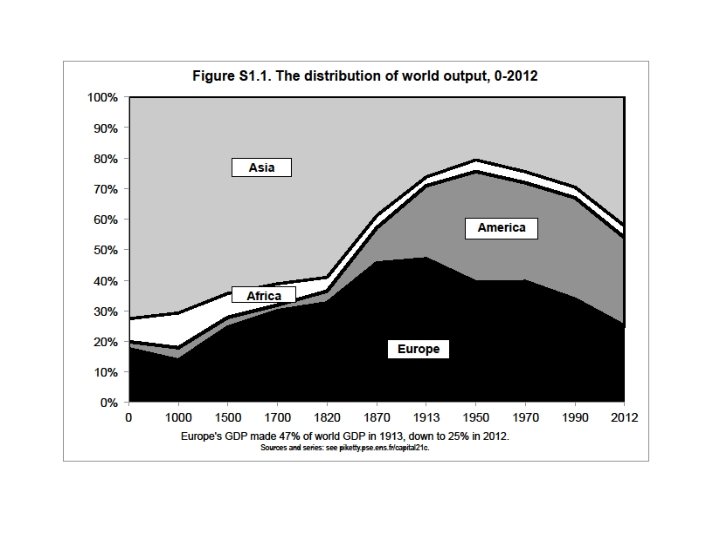
Introduction: three U-shaped curves • (1) Between-country income inequality 1700 -2015: divergence between Western and other countries during 19 c & until mid 20 c, convergence since 1980 -1990 (reduction of inequality) • (2) Within-country income inequality: in the US, income inequality rose since 1980 & is now back to the levels observed in early 20 c : i. e. about 50% of national income for the top 10% • (3) Capital/income ratio: in Europe & Japan, K/Y is almost back to the level observed in early 20 c : i. e. about 500 -600% for K/Y • These three evolutions are partly related (world wars, decolonization, end of communism, globalization), but also invole country specific mechanisms: (1) largely due to internal evolutions of emerging countries ; (2) mostly US trend; (3) mostly Europe and Japan (postwar recovery, demography) ; (2) & (3) could well happen together everywhere in the future - or not • One of the key objectives of this course is to better understand these long-run evolutions: how did rich countries get rich, and how do inequality, state formation & development interact?
Basic concepts: output, income, capital • National income Y = domestic output Yd (NDP) + net foreign factor income • Domestic output Yd (NDP = Net domestic product) = GDP (Gross domestic product) – capital depreciation • Typically Y and Yd = about 85 -90% GDP in rich countries today • I. e. capital depreciation = about 10 -15% GDP (but can be <5% in agrarian societies: low land depreciation rates as compared to buildings, equipment, computers, etc. ) • Net foreign factor income can be >0 (typically in countries with net foreign asset position > 0), or <0 (typically in countries with net foreign asset position < 0)
• Net foreign asset position (NFA) = gross foreign assets (gross assets owned by the residents of a country in the rest of world) – gross foreign liabilities (debt) (gross assets owned by rest of the world in the country) • Net foreign capital income = close to 0% of Yd in most rich countries (between +1 -2% & -1 -2% Yd) : right now, rich countries own approximately as much foreign assets in rest of the world as rest of the world owns in home assets, so that national income ≈ domestic output • But this has not always been like this (colonial times); and it could change again: Germany and Japan – and China and oil producing countries – are currently accumulating large NFA, while NFA of Africa (or Greece) is v. negative >> see lecture 3 • At the world level, net foreign income flows cancel out, so that national income Y = domestic output Yd
• National income Y = Yd + r NFA • Private capital (or private wealth) W = non-financial assets (real estate, family firms, . . ) + financial assets (equity, bonds, life insurance, deposits, cash, pension funds, . . ) – financial liabilities (debt) held by private individuals (households) (+non-profit inst. ) • Public capital (or public wealth) Wg = non-fin + fin assets – liabilities held by the government (all levels) • National capital (or national wealth) Wn = W + Wg • National wealth Wn = domestic capital K + net foreign assets NFA • Domestic capital K = agricultural land + housing + other domestic capital (=structures, equipment, patents, . . used by firms & govt) • Note that firms are valued at market prices through equity • Private wealth/national income ratio β = W/Y • National wealth/national income ratio βn = Wn/Y • Domestic capital/output ratio βk = K/Yd • At the world level, national wealth/national income ratio = domestic capital/output ratio; but at the country level, it can differ
• Basic orders of magnitude in rich countries today • National wealth Wn ≈ private wealth W (i. e. public wealth Wg ≈ 0) (or <0. . ) • National wealth Wn ≈ domestic capital K (i. e. net foreign asset NFA ≈ 0) (but large gross foreign positions) • National wealth Wn ≈ 500 -600% of national income Y ≈ residential housing + other domestic capital (≈ 50 -50) • Typically, in France, UK, Germany, Italy, US, Japan: Per capita average income Y ≈ 30 000€ (= national income/population) Per capita aver. wealth W ≈ 150 000 -180 000€ (=private wealth/pop) • I. e. β = W/Y ≈ 500 -600% • YK = capital income = rent, dividend, interest, profits, . . • α = YK/Y = capital share in national income ≈ 25 -30% • I. e. average rate of return r = α/β = 4 -5% • Basic accounting law: α = r x β → Lecture 3 on dynamics of β and α
National accounts: the measurement of growth • Maddison 2008 database = the most extensive compilation of historical national accounts (The World Economy. . . 2001, appendix) • See this excel file for a combination of Maddison series and official UN population series and WB GDP series for recent decades; see also Capital…, chap. 1 -2, & on-line appendix tables for chapter 1) • On the history of national accounts, see R. Stone, “The accounts of society”, Nobel lecture 1984, and Vanoli 2002 • Since the 1930 s-40 s and until recently (≈ btw 1929 and 2008), national accounts were mostly about flows of output, income and consumption/invt, and not about stock of capital, assets & liabilities • Maddison: no data on capital stock (only GDP and population) • See lecture 3 on the history of measurement of capital and wealth; recent return to stock measurement (back to 18 c-19 c and to an earlier tradition of national accounts)
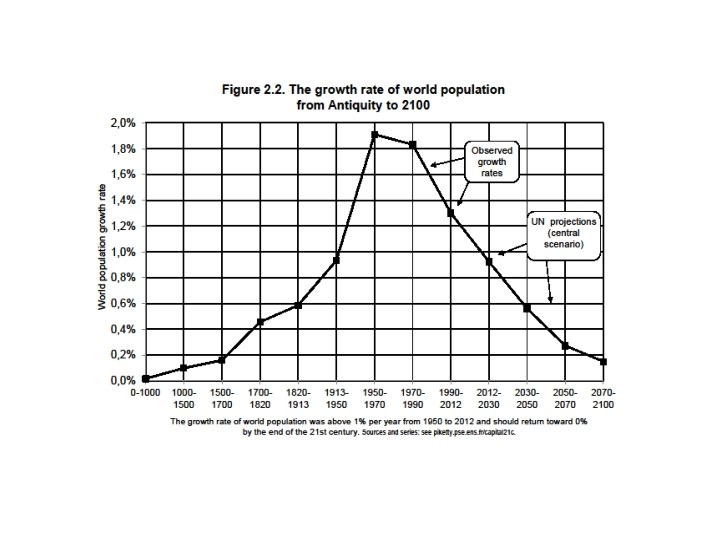
Facts & questions about long-run growth • Fact 1: Convergence • Convergence between poor and rich countries now seems well under way; but not over yet (? ) • Fact 2: Global growth slowdown in 21 c • Productivity growth is always slow for countries at the world technological frontier; once global catch-up process is over, growth might be low everywhere (? ) • Population growth seems to be → 0 (or <0) (? )
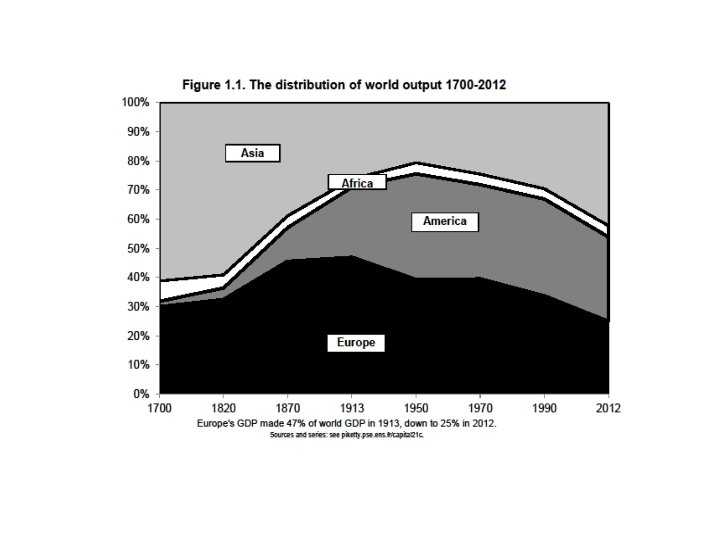
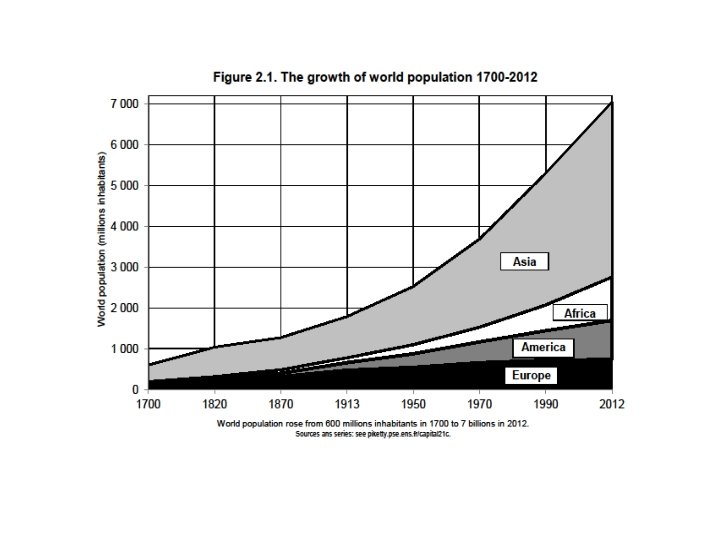
Fact 1. Convergence • Between 1900 and 1980, Europe + America ≈ 70 -80% world GDP • In 2013: down to about 50% (as in 1860) • At some point during 21 c: down to 20 -30%, i. e. to the share of Europe + America in world population = convergence in per capita output and income • But will convergence be over in 2030, 2060 or 2090? Nobody knows. Probably closer to 2040 in East Asia, and closer to 2090 in South Asia and Africa. • Convergence occured mostly through domestic investment (not so much through foreign investment: emerging countries are not owned by rich countries… except Africa) • Economic openness had a critical impact on development via free trade (specialization effect) and via diffusion of technology and know-how; but maybe not so much via free capital flows
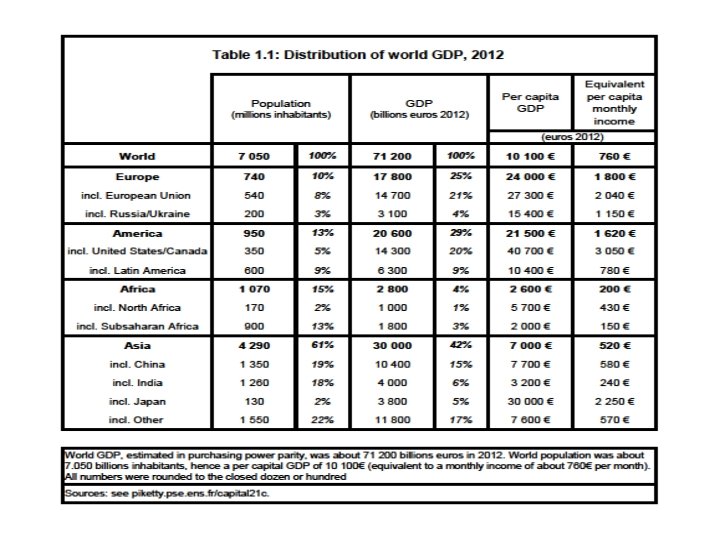
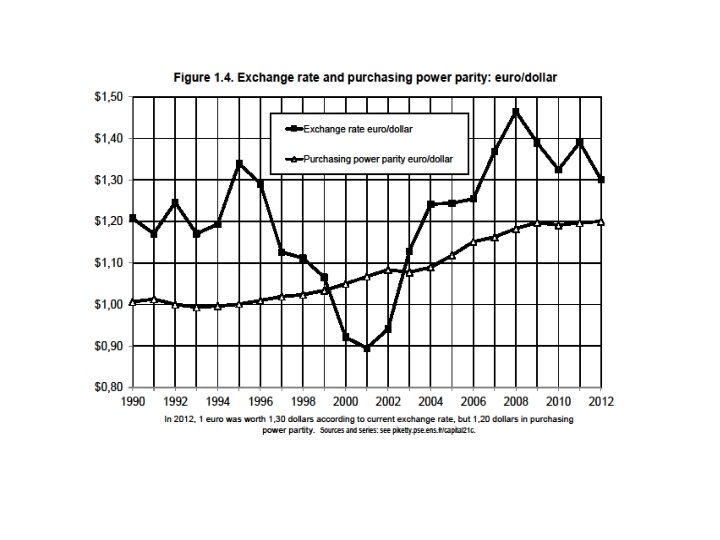
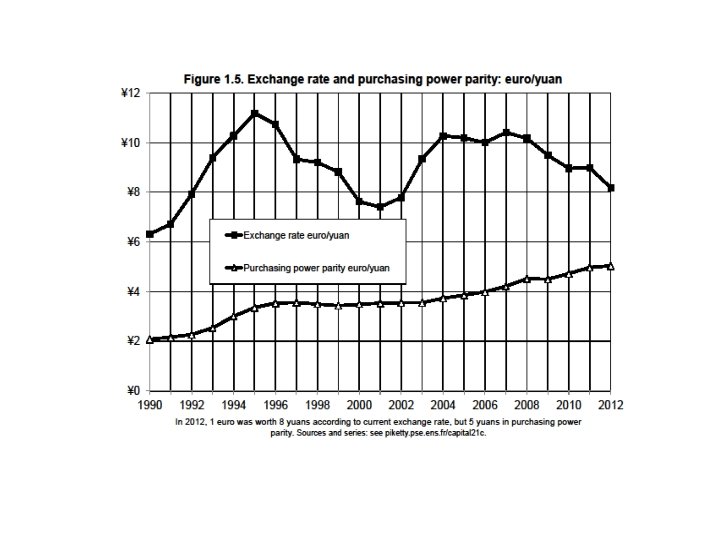
• Basic orders of magnitude to remember: • World GDP 2012 = about 70 trillions € (i. e. 70 000 billions €) • World population = about 7 billions • Per capital GDP = about 10 000€ • Per capital income = about 800€/month • Rich countries = about 2000 -3000€/month • Poor countries = about 200 -300€/month • More inequality in income than in output, and in market exchange rates than in PPP
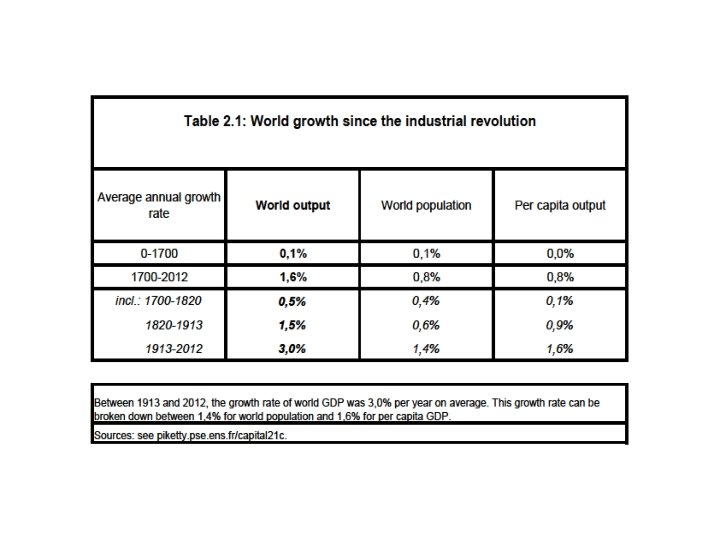
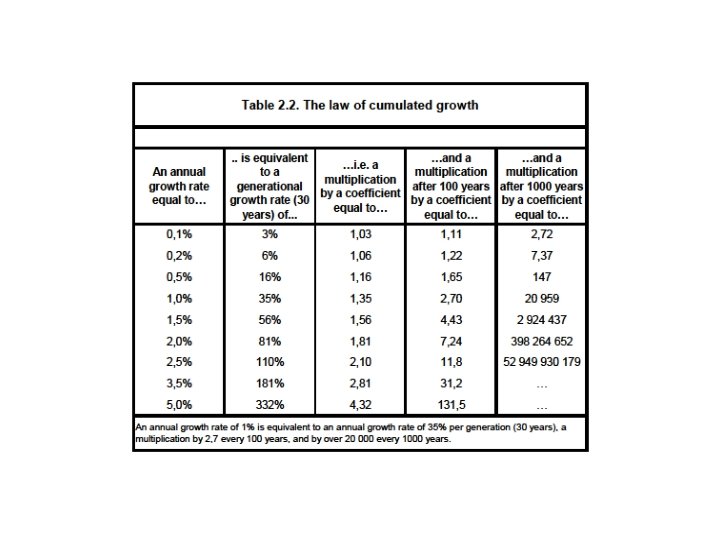
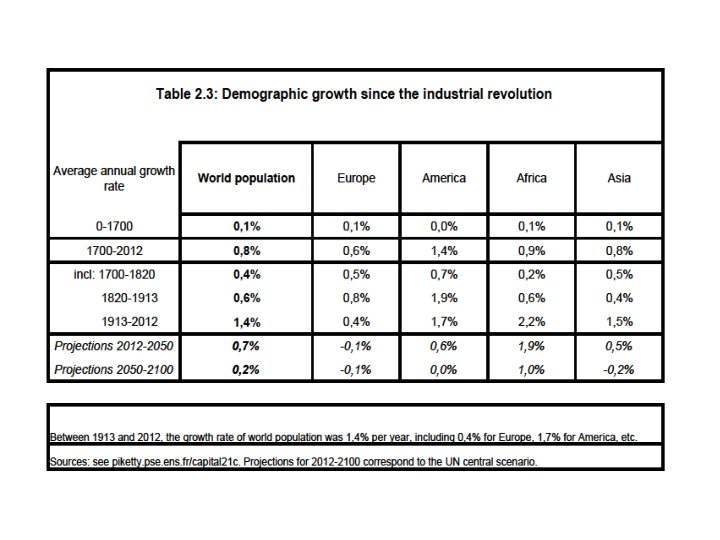
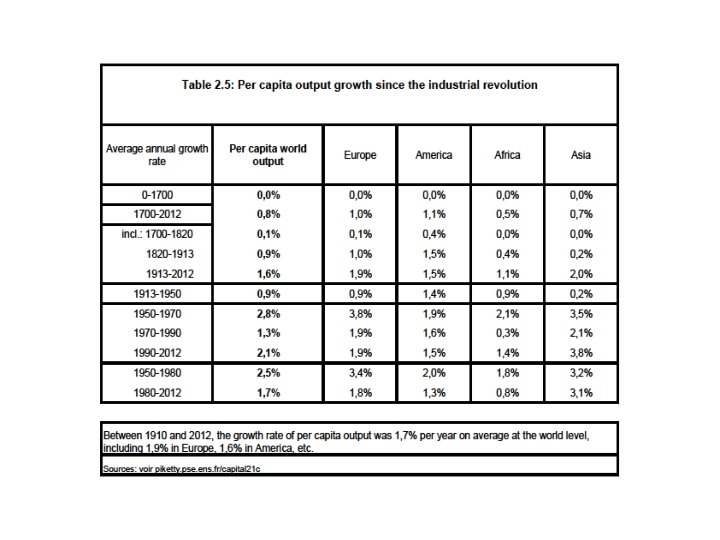
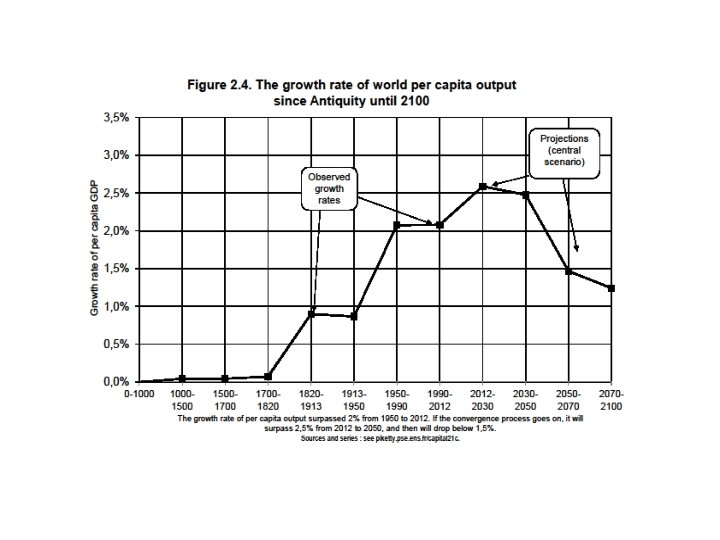
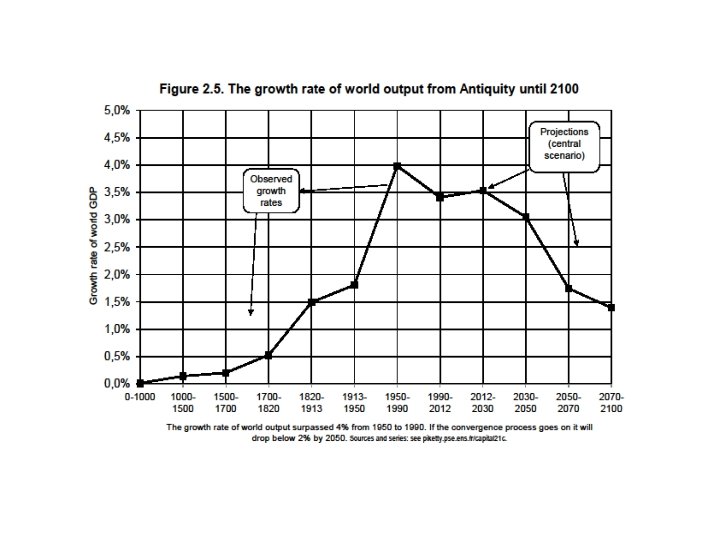
Fact 2. Growth slowdown • Productivity growth is always slow for countries at the world technological frontier; once global catch-up process is over, growth might be low everywhere • Population growth seems to be → 0 (or <0) • Average world growth 1700 -2012: g=1, 6%, including n=0, 8% for population and h=0, 8% for per capita output • But 0, 8% per year was enough to multiply world population (and average income) by a factor of 10 • g = n + h with n = population growth and h = productivity growth • In the very long run, maybe n ≈ 0% and h ≈ 1 -1, 5%, so that g=n+h≈1 -1, 5% • Some economists are even less optimistic: long-run g<1% according to Gordon 2012 and secular stagnation debate
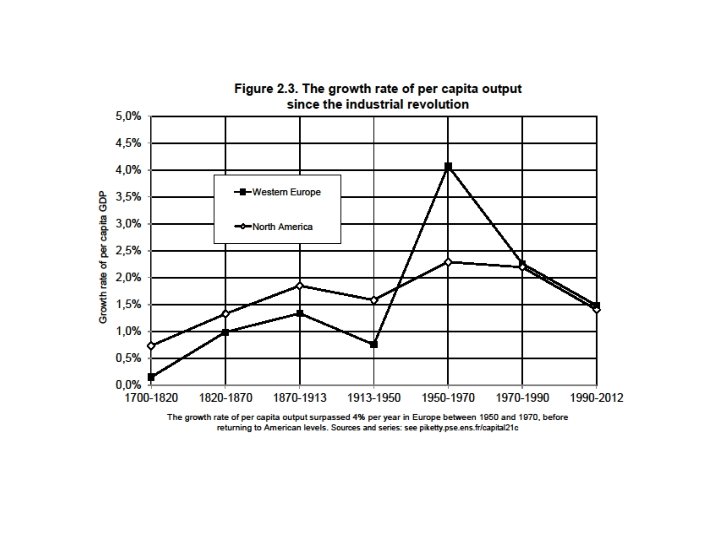
• Per capita (per inhabitant) growth was exceptionally high in Europe and Japan in the 1950 -1980 period (h=4 -5% per year) because of a catch-up process with the US; but since 1980, per capital growth rates have been low in all rich countries • In the very long, h=1% is already quite fast and requires permanent reallocation of labor (about one third of the economy is being renewed at each generation)
How did rich countries become rich, and how did convergence happen? • (0) One possible view: with free markets and private property, everybody should become rich. The West first adopted these « institutions » (rule of law, well-protected property rights, …, freedom, democracy, …) and became rich. If the rest of the world follows this strategy, then everybody will become rich & happy. • A bit simplistic & western-centric: • (1) Rise of the West over 1500 -1900 period came with a lot of violence: key role of armed trade, slavery, colonization, military domination. Not really peaceful institutions and the rule of law. • (2) Rising living standards in 20 c came with the rise of government (tax revenues: 10% Y before WW 1; 30 -50% Y in all developed countries today). In order to understand development, one needs a broader view of institutions : public infrastructures, education, social welfare, economic and political democracy. Not just property rights.
• (3) Free markets and private property sacralization during 19 c and early 20 c led to extreme inequality and social tensions >>> nationalism, wars, communism >> the elites finally accepted public regulation, welfare state, progressive taxation >>> reduction of inequality = the « Great Transformation » of the 1914 -1945 period • But complex legacy of 20 c shocks: different memories of post-WW 2 exceptional period: - high-growth egalitarian ideal in western Europe (Trente glorieuses) - mixed memory in US/UK (relative decline; Reagan-Thatcher reaction) - negative memory for ex-communist countries (Russia/China/East. Eur. ) >> pro-market reaction, back to private property sacralization - Third world: decolonization period, mixed experience with state intervention; European colonial power replaced by US power system… until today and the rise of China (pluto-communism? ) interaction between domestic inequality, international power
• (4) Rise of emerging countries certainly benefited from market openess, but did not come simply from market forces; in particular, foreign investment played a relatively minor role: convergence came from domestic saving and investment, public infrastructures and education, the diffusion of knowledge and state formation; e. g. bigger govt and public spend. in China than India, & higher growth; there are different ways to organize economic & political institutions • The standard growth model predicts output convergence, not income and convergence; if we simply rely on market forces (rather than investment in productivity, knowledge and education), we can end up with permanent wealth inequality, foreign-owned countries, political instability and redistribution cycles (Africa, South America) • International property relations are particularly complicated to regulate peacefully • Learning to live with inequality, collective learning about the ideal compromise & institutions: the dimensions of political conflict
A quick roadmap of the global history/ comparative development literature • Hundreds of authors have written about comparative development (why some countries develop and not others) since 18 c : Montesquieu 1748 (climate), Smith 1776 (markets), Marx 1867 (primitive accumulation, colonial extraction), Weber 1904 (protestant ethic), etc. • Impossible to summarize everything; here I give a very quick overview and introduction; I will return to several themes later • Braudel 1979 Civilisation and capitalism (3 vol. ): the first global, multidimensional history of capitalism 1500 -1800; much broader than Weber; enormous influence on subsequent research and the rise of « world history » • Pomeranz 2000 The Great Divergence: China and Europe in the Making of the Modern World Economy (see also AHR 2002 ) = possibly the most important book in global history since Braudel
• K. Pomeranz 2000: btw 1500 and 1750 -1800, (the most advanced regions of) China/Japan and Europe followed more or less the same devt path: slow but positive population growth, agriculture/textile domestic proto-industrialisation • If anything, China/Japan had more « Smithian » market institutions than Europe until 1800: more unified land grain markets (less church property, more political unity, fewer wars), more labor mobility (less serfdom & labor control) • The Great Divergence only begins with armed trade & military domination of the West around 1750 -1850; in effect, this allowed the West to escape the proto-industrialization « ecological constraint » (massive deforestation in 18 c): coal, slaves, New World • National accounts of colonial extraction are highly uncertain (Williams 1944 vs O’Brien 1982); Pomeranz innovation is to use land accounts: btw 1500 & 1800, share of forested land goes from 30 -40% to 5 -10% in Europe; by 1830, British imports of cotton/timber/sugar ≈ 1. 5 -2 additional Britain in arable land
• S. Beckert 2014, Empire of Cotton – A Global History: until 1500 -1600, cotton and textiles had always been produced locally; things started to change with the Great Discoveries and the military expansion of Europe: the West appropriated land in America, sent slaves from Africa in order to produce raw cotton, and finally banned Indian textiles → by 1750 -1850, Europe controlled global textile manufacturing (= complementary to Pomeranz 2000) • Key role of slavery: half of all slaves transported over 1492 -1887 period were transported after 1780; huge acceleration 17801860; it is only after US Civil War that Indian cotton rises again • « 18 c-19 c were the age of barbarity and catastrophe; one has to be v. eurocentric to view 20 c as the age of catastrophe: it is the age of independance and end of slavery; global capitalism today is still shaped by the struggles for independance, and for a fair empire of cotton »
• Rosenthal-Wong 2011, Before and Beyond Divergence: The Politics of Economic Change in China and Europe: stress on size of political communities (polities); Europe = smaller polities → more competition between small nation-states, more military innovation (and war-&public-debt-incuded financial innovation) → rise of the West; but also self-destruction of Europe during 20 c, and major coordination problems today within EU…; China = larger polity, less military innovation during 17 c-19 c, but probably better in the long run • During 17 c-18 c, China not only had more Smithian market institutions than Europe, but also more Smithian governement: no war, low taxes, development-friendly spending, no public debt… until Western indemnities and war tributes imposed by the West during 19 c (key role of public debt in colonial coertion: China, Turkey, Morroco, …)
• See also P. Hoffman, « Prices, the military revolution, and western Europe’s comparative advantage in violence » , EHR 2011; “Why Was It Europeans Who Conquered the World? ”, JEH 2012 • J. Goody 2006, Theft of History : analysis of Western-centric bias in some of the main writings in modern social sciences • R. Allen 2007, The British Industrial Revolution in Global Perspective
World systems, power and ideology • K. Polanyi, The Great Transformation, 1944: 19 c capitalist system was inherently unstable, which led to its own destruction in 1914 -1945 • Sacralization of private property + generalized competition between individuals and nations = v. unequal & unstable system, both within and between countries → wars, monetary chaos, revolutions, fascism • Key pb = myth of self-regulated markets for labor, land money • Over-optimistic view of pre-industrial restrictions on labor mobility? • Compare with H. Arendt 1951: same premises, different conclusions • See also I. Wallerstein, The Modern World System, 1974 -1989 • G. Arrighi, The Long Twentieth Century, 1994; global history = succession of world systems, or core-periphery systems: Genoa 14001600, Holland 1600 -1750, UK 1750 -1920, US 1910 -? , China: ? -? • On core-periphery growth models: see Krugman-Venables QJE 1995 : a decline in transport costs can make big parts of the world worst off • Arrighi : power = military dominance + moral/idelogical leadership; “power = the grey zone between coercion and consent”
State formation and the rise of government • P. Lindert, Growing Public- Social Spending and Economic Growth since the 18 th Century, Oxford UP 2004 • Very interesting and etailed history of the rise of modern government and social spendings (tax revenues: 10% Y during 18 c-19 c and pretty much until WW 1; 30 -50% Y in all developed countries today) • Rising living standards during 20 c came with the rise of governement • Rise of fiscal and social state was not bad for growth and development because public spendings were for the most part growth-enhancing: public infrastructures, education, health, etc. • Up to a point, there is no equity/efficiency trade-off
Long run impact of inequality on development • Sokoloff- Engerman, “Institutions, Factor Endowments, and Paths of Development in the New World”, 1997 ; JEP 2000 : more initial inequality in South America than in North America (colonial extraction vs settlers colonies) → more instability, less development • J. S. You, “Land reform, inequality and corruption: a comparative historical study of Korea, Taiwan and the Philippines”, 2014 : less inequality in Korea/Taiwan than in the Philipinnes (particularly due to more ambitious land reform in 1950 and more egalitarian social and education services) → more growth in Korea/Taiwan in 1950 -2000 than in the Philipinnes, although the starting points were not very different in terms of per capita GDP (see also China vs India) → extreme inequality is not good for growth & development, both because of inequality-induced political instability, and because high inequality tends to come with low mobility (high mobility and inclusive investment in social and educational services are good for growth)
• Capital in the 21 st century : an attempt to put the study of inequality, beliefs systems and institutions at the center of economics/economic history/political economy; key role of 1914 -1945 shocks in historical reduction of inequality; risk of returning to extreme inequality (r vs g); but many other evolutions are possible • Basic idea = how each country deals with inequality & property relations is central for the construction of a legitimate government, state formation, and the development process; pb = each country tends to be self-centered + power of self-serving ideology • This book is a very incomplete attempt to move in this direction, particularly regarding the study of beliefs systems and politics • See «Putting Distribution Back at the Center of Economics» , JEP 2015; « Vers une économie politique et historique » , Annales – Histoire, sciences sociales 2015, « About Capital in the 21 st century » , AER 2015, and other debates and symposia
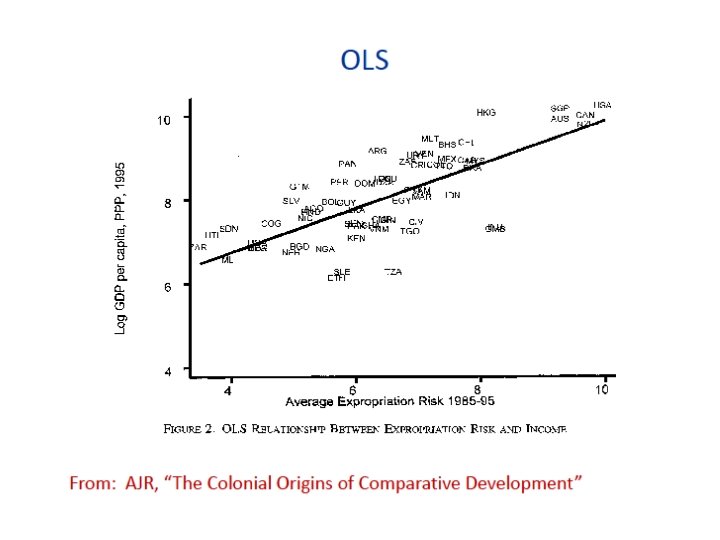
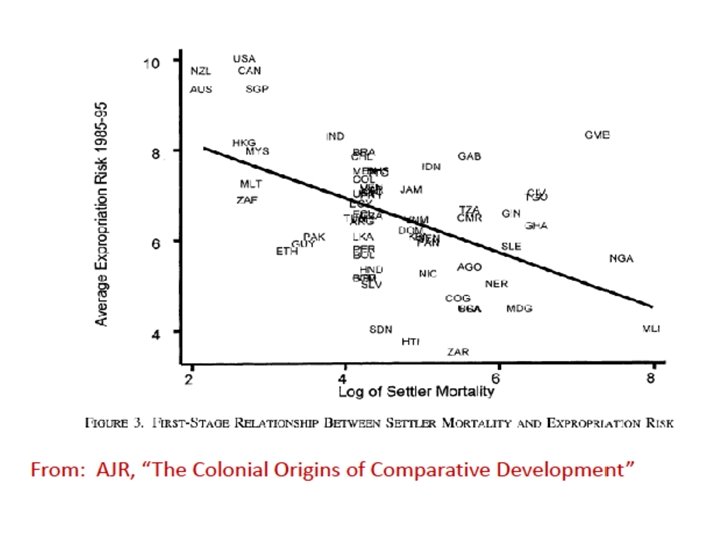
The property-rights/western-centric viewpoint • North-Weingast, « Constitutions and commitment » , EHR 1989 : British 1688 parliamentary miracle → financial & industrial devlopt • Acemoglu-Robinson, Why nations fail, 2012; AER 2001; etc. : « if property rights are well protected (small risk of expropriation, nationalization, etc) & small government, then developmt occurs » • Very interesting, but (in my view): • Somewhat narrow approach to « institutions » : too much centered on the protection of private property rights • Somewhat too vague and ahistorical: AR also refer to « inclusive vs extractive institutions » , but they are often not very precise; v. little on specific institutions/policies such as education systems, welfare state, fiscal systems, etc. ; almost nothing on 20 c state formation • Somewhat too Western-centered (or US-centered): « if western settlers impose the right institutions, then devlopment occurs » • Read them & make your own mind !
The standard growth model: output convergence, not income & wealth cv • The standard (neoclassical) growth model has many limitations: one-good model (no relative asset price), perfectly competitive markets with full information, little attention to inequality, etc. • But it is a useful starting point to think about growth mechanics • Output Y = F(K, L) = production function with K = capital input (= non-human capital: land, buildings, equipment, robots, patents, etc. ) and L = labor input (= human capital: efficient labor units = active population x labor productivity) • Exemple: Cobb-Douglas production function: F(K, L)=Kα L 1 -α → one needs capital K and labor L to grow at the same rate in order to have balanced long-run growth of Y (also true with more general production functions: see lecture 3)
• Basic logic of the convergence model: if capital can freely flow from rich to poor countries, and if labor productivity is the same everywhere, then per capita output will be the same everywhere = « convergence » • This result requires strong assumptions: perfect competition, onegood model, no specialization effect (core/periphery models), no colonial extraction, etc. • But even if these strong assumptions are all satisfied, the point is that the standard growth model predicts output cv, not income or wealth cv: one can end up with permanent wealth inquality, foreign-owned countries, political instability and redistribution cycles (Africa, South America) • Asian miracles were induced by domestic saving, diffusion of knowledge and education, pro-development policies and public investment, not by capital flowing from rich to poor countries
• More on standard growth models: see Solow QJE 1956, Barro-Salai-Martin 2004 Chap. 1 -2 , Jones-Romer AEJ 2010 • Most important steady-state formula to remember: modified Golden rule formula r = θ + γ g ( >g ) (θ = rate of time preference, γ = curvature of utility function) • r > g does not mean ever-rising inequality: it simply means that ownership makes sense, i. e. that capital owners only need to reinvest a fraction g/r (<1) of their capital income to ensure that their wealth rises as fast as the size of the economy • I. e. if r=5%, g=1%, capital owners only need to reinvest 20% of their capital income and can consume 80% • r<g would imply that they need to reinvest more than 100% of capital income ( « dynamic inefficiency » : too much capital) • See also course notes on wealth models (particularly on the relation between equilibrium wealth inequality and r – g) • Here I only provide simple numerical exemples
• Two countries A and B with same population & labor productivity LA=LB • Exemple 1: A and B have same per capita wealth WA=WB=200 000€ • No need for capital flows between countries A and B: each country has the same per capita domestic capital KA=KB= 200 000€ • Assume Y=F(K, L) is such that per capita output YA=YB= 25 000€, i. e. capital-output ratio β = K/Y = wealth-output ratio W/Y = 800% • No net foreign wealth: per capita income = per capital output = 25 000€ • Assume growth rate g = 1% (population + productivity growth) and rate of return to capital r = 5% (marginal product of capital + preferences) • Capital share α = YK/Y = r x β = 40%: in both count. , labor income YLA=YLB=15 000€, capital income YKA=YKB=10 000€ (=5% x 200 000€) • Balanced (steady-state) growth: K must rise at same speed as Y and L • If g=1%, r=5%, one needs to reinvest a fraction g/r=20% of YK (2 000€), and one can consume a fraction 1 -g/r=80% (8 000€) → Y = 25 000€ = S + C = 2 000€ (8%) + 23 000€ (92%) • With g=2%, r=5%, one needs to reinvest a fraction g/r=40% of YK , etc.
• With full equality (within & between countries), the fact that r>g is not a pb at all: it simply means that everybody needs to save and reinvest a fraction g/r of YK so that K rises at the same speed as Y and L (steady-state growth), & can consume a fraction 1 -g/r of capital income = this is the purpose of K accumulation and ownership: one can consume more than without K accumulation • r < g would be a pb: one would need to reinvest more than YK in order to keep K rising at same speed as Y and L, which makes no sense: « dynamic inefficiency » , i. e. over-accumulation of K (r<g impossible in infinite-horizon models; possible in OLG models) • But with inequality between individuals (shocks to rates of return, labor incomes, demographics, etc. ), a higher gap between r & g tends to amplify shocks and wealth concentration (see lecture 3) • What about impact of r – g on inequality between countries?
• Exemple 2 (unequal countries): WA=400 000€, WB=0€ • With free capital flows, half of country A’s wealth is invested in country B, so that each country still has the same per capita domestic capital KA=KB= 200 000€ and the same per capita output YA=YB= 25 000€ • The difference is that now country B’s capital is owned by country A: income YB* in country B = labor income YLB = 15 000€, while income YA* in country A = YLA + YKB = 35 000€ • Balanced growth: country B doesn’t save (& consumes 15 000€), while country A saves a fraction g/r of YKA + YKB (& consumes the rest) • If g=1%, r=5%, YA* = 35 000€ = S + C = 4 000€ (8%) + 31 000€ (92%) → Market forces can lead to output convergence (under certain conditions), but not to convergence of wealth, income & welfare: in standard models, any initial level of wealth inequality is self-sustaining • Higher gap between g & r implies higher steady-state inequality of consumption and welfare (if g≈r, then all YK needs to be reinvested) • Only solution: country B needs to save more (not easy since country B is poorer than country A → more natural to accumulate debt) …or to expropriate country A! (→large foreign assets often come with political and military domination, so as to avoid expropriation: colonies)
• Exemple 3 (v. unequal countries): WA=600 000€, WB=-200 000€ (debt) • With free capital flows, half of country A’s wealth is again invested in country B, so that each country still has same domestic capital KA=KB= 200 000€ and the same per capita output YA=YB= 25 000€ • The difference is that now country B’s capital is owned by country A, and that in addition count. B needs to repay interest payments of its foreign debt (r x DB = 10 000€ if r=5% and DB=200 000€) income YB* in country B = labor income YLB - r. DB = 5 000€, while income YA* in country A = YLA + YKB + r. DB= 45 000€ • Balanced growth: count. B doesn’t save (& consumes a frac. g/r of r. DB), while count. A saves fraction g/r of YKA+YKB+r. DB (& consumes the rest) • If g=1%, r=5%, YB* = 5 000€ = S + C = -2 000€ + 7 000€ , while YA* = 45 000€ = S + C = 6 000€ + 39 000€ → There’s nothing in standard economic models that prevents extreme inequality to persist forever, especially if g << r: possibility of permanent inequality between countries (or dynasties), with some countries (or dynasties) working for ever for others >> difficult to justify and regulate