NDT Technologies for Pavement Evaluation FHWA Directions and
- Slides: 21
NDT Technologies for Pavement Evaluation: FHWA Directions and Initiatives H. Thomas Yu Office of Asset Management, Pavement, and Construction Federal Highway Administration
Content § Background § Status § Future
Background § Deployment of innovative technologies is an important mission of the Office of Pavement Technology Ø Identify needs and opportunities Ø Deploy promising technologies § Focused on available, near market-ready technology § Emphasis area: NDT technologies for pavement evaluation
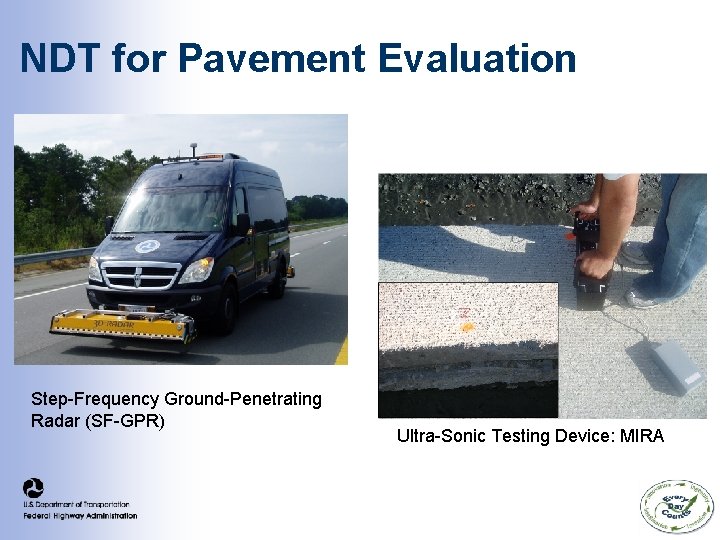
NDT for Pavement Evaluation Step-Frequency Ground-Penetrating Radar (SF-GPR) Ultra-Sonic Testing Device: MIRA
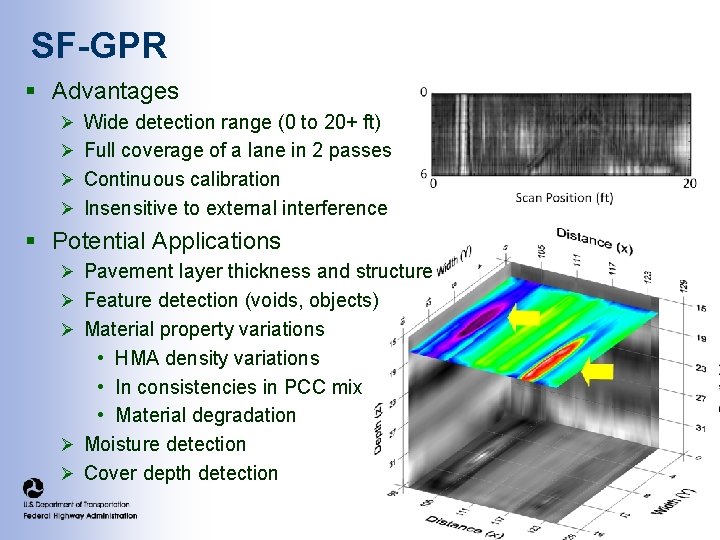
SF-GPR § Advantages Ø Wide detection range (0 to 20+ ft) Ø Full coverage of a lane in 2 passes Ø Continuous calibration Ø Insensitive to external interference § Potential Applications Ø Pavement layer thickness and structure Ø Feature detection (voids, objects) Ø Material property variations • HMA density variations • In consistencies in PCC mix • Material degradation Ø Moisture detection Ø Cover depth detection
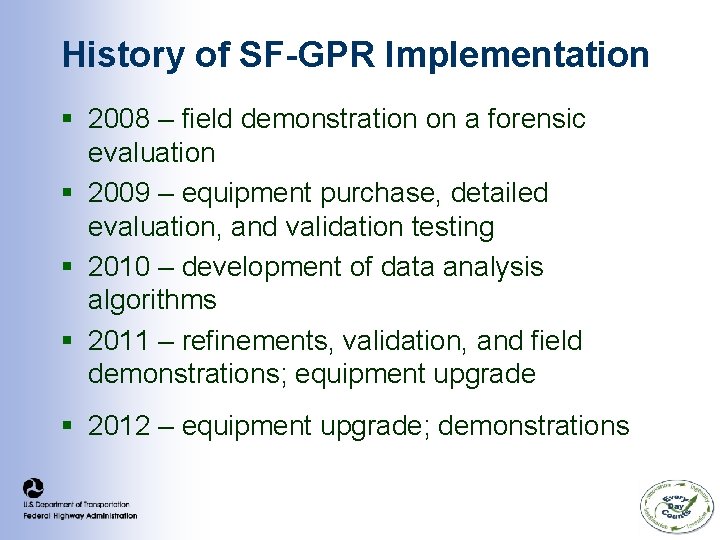
History of SF-GPR Implementation § 2008 – field demonstration on a forensic evaluation § 2009 – equipment purchase, detailed evaluation, and validation testing § 2010 – development of data analysis algorithms § 2011 – refinements, validation, and field demonstrations; equipment upgrade § 2012 – equipment upgrade; demonstrations
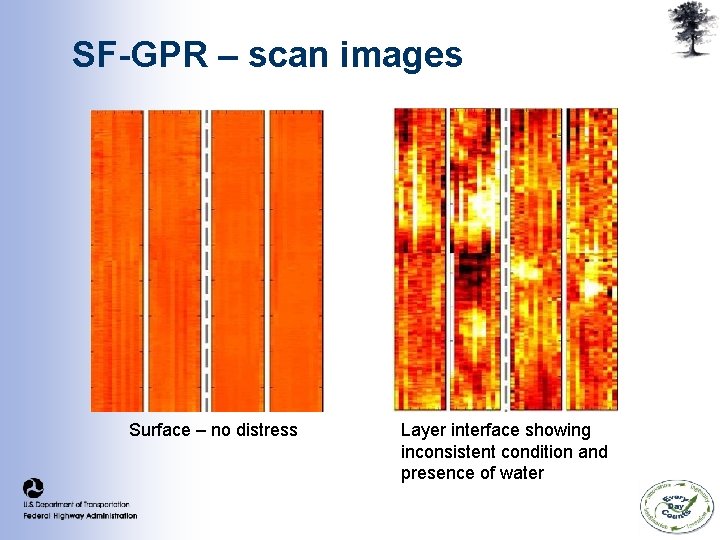
SF-GPR – scan images Surface – no distress Layer interface showing inconsistent condition and presence of water
SF-GPR Status § Several applications are ready for pilot implementation Ø Surface layer thickness for construction QA Ø Pavement structure survey Ø Feature detection Ø Material property variations § SF-GPR could be customized for many applications Ø Automation of data processing can be achieved Ø Some expert interpretation will be needed, depending on the maturity of the application
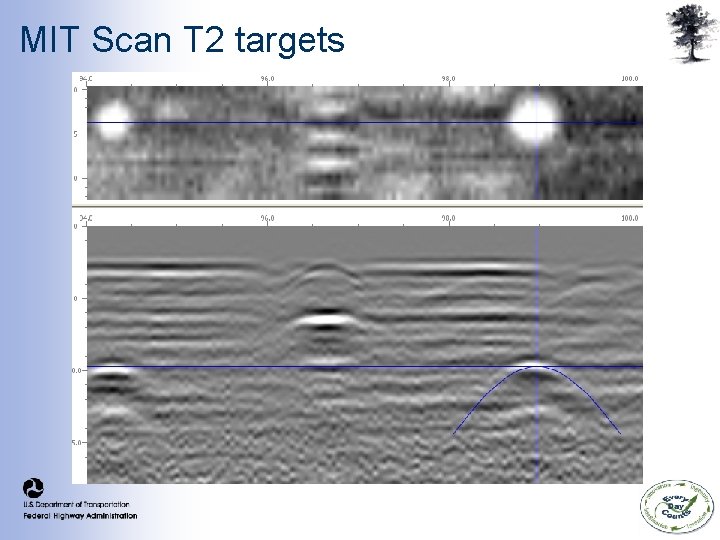
MIT Scan T 2 targets
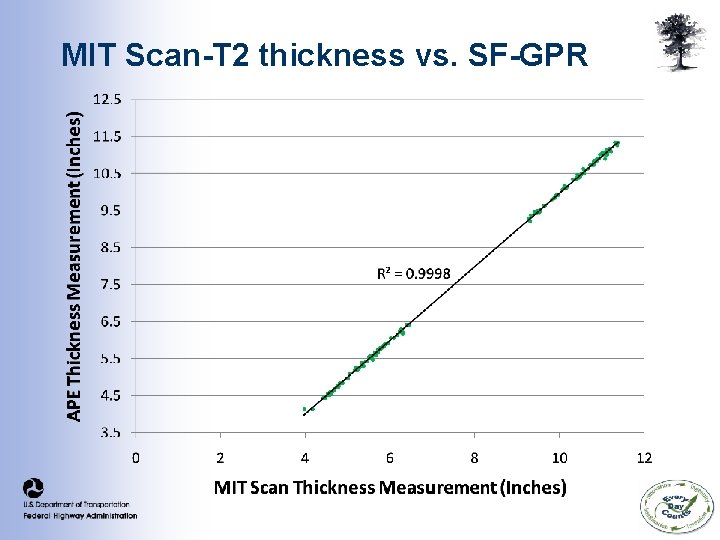
MIT Scan-T 2 thickness vs. SF-GPR
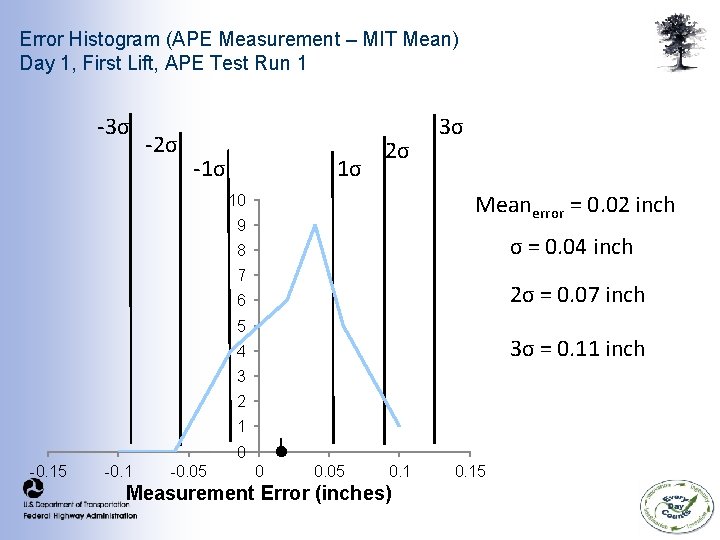
Error Histogram (APE Measurement – MIT Mean) Day 1, First Lift, APE Test Run 1 -3σ -2σ -1σ 1σ 2σ 3σ Meanerror = 0. 02 inch 10 9 σ = 0. 04 inch 8 7 2σ = 0. 07 inch 6 5 3σ = 0. 11 inch 4 3 2 1 0 -0. 15 -0. 1 -0. 05 0. 1 Measurement Error (inches) 0. 15
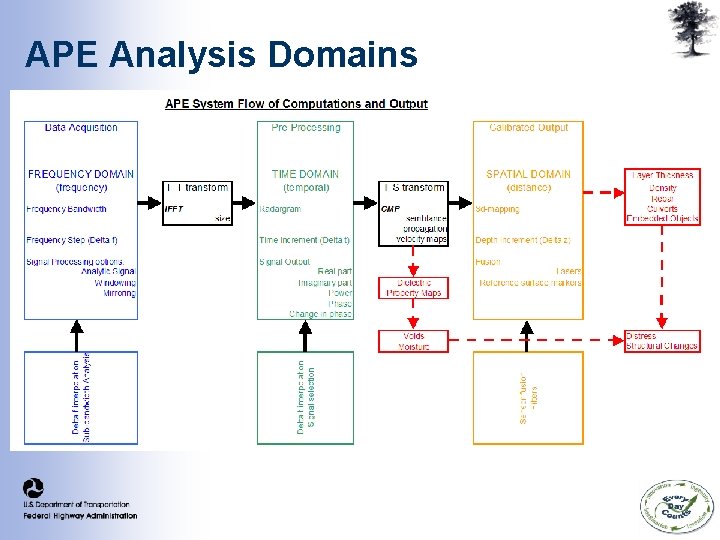
APE Analysis Domains SF-GPR Data in Frequency Domain
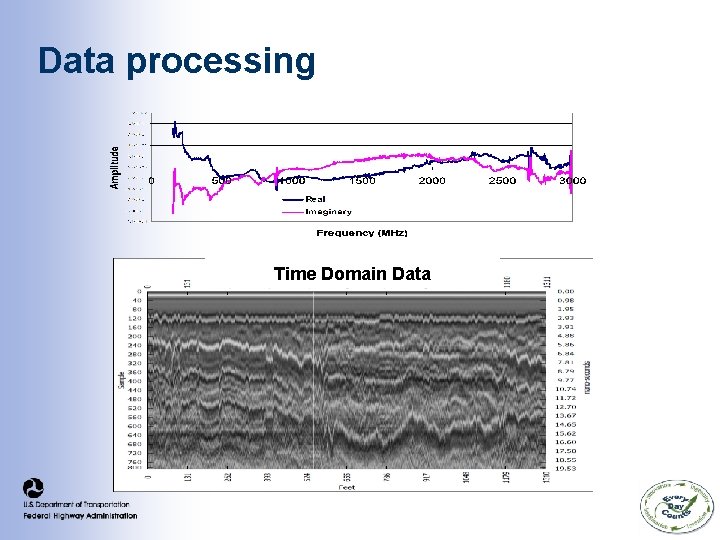
Data processing Time Domain Data
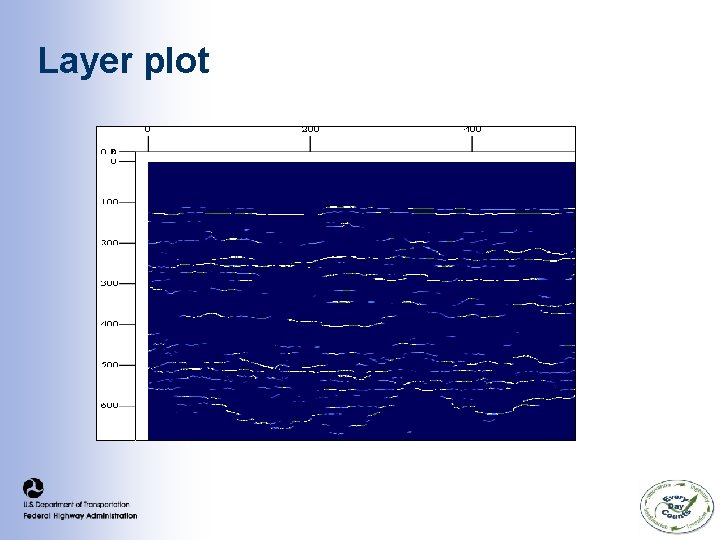
Layer plot
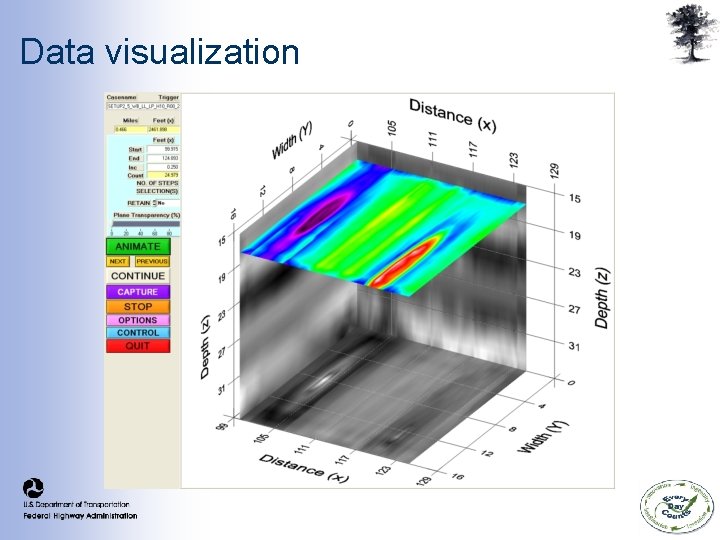
Data visualization
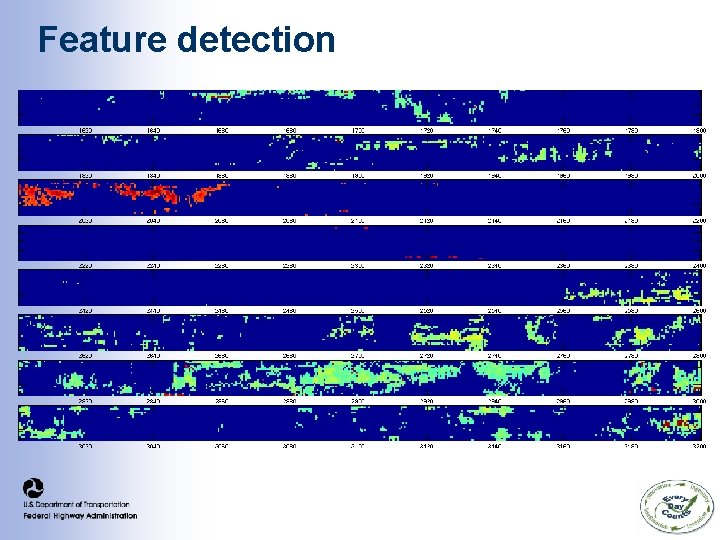
Feature detection
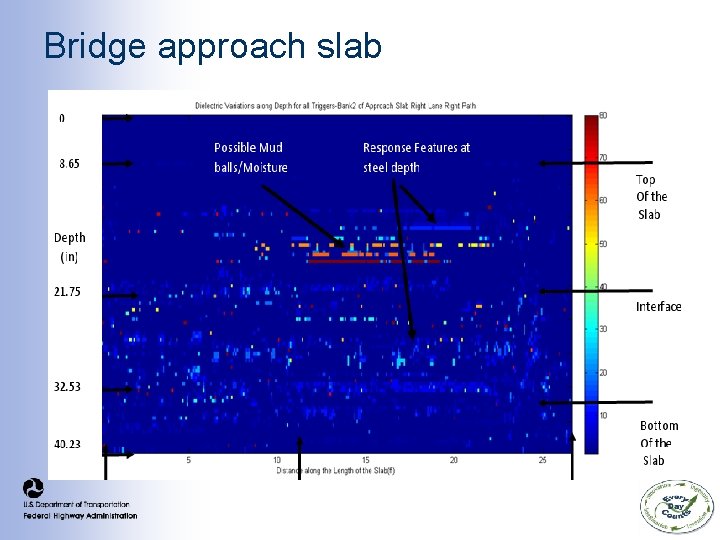
Bridge approach slab
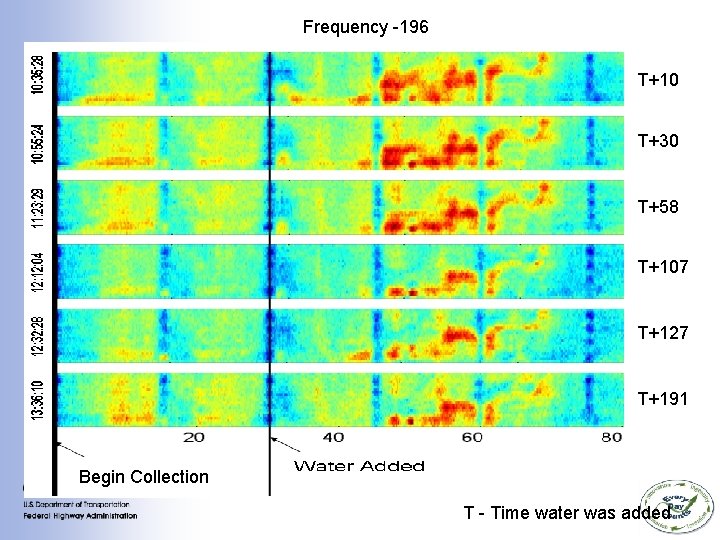
Frequency -196 T+10 T+30 T+58 T+107 T+127 T+191 Begin Collection T - Time water was added
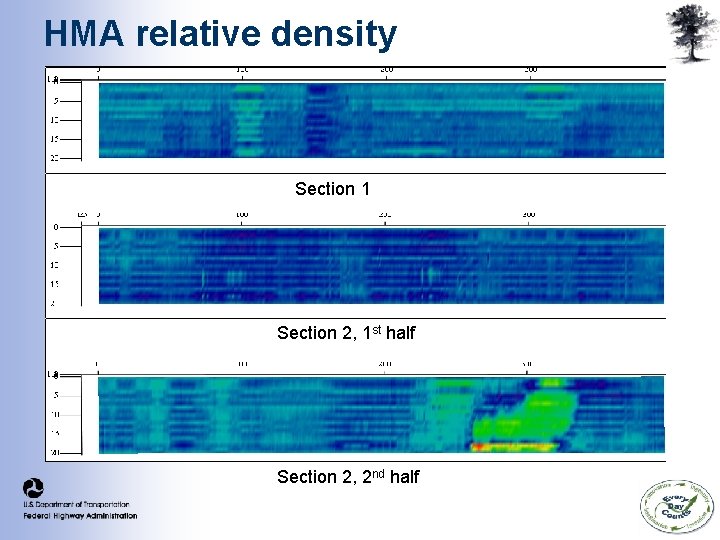
HMA relative density Section 1 Section 2, 1 st half Section 2, 2 nd half
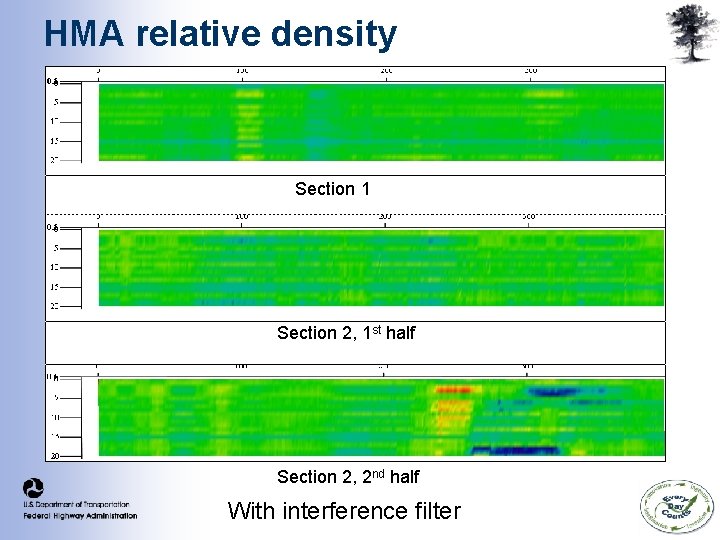
HMA relative density Section 1 Section 2, 1 st half Section 2, 2 nd half With interference filter
Summary § Several applications are well-suited for production work and are ready for pilot implementation: Ø Surface layer thickness Ø HMA density variations (SHRP 2 R 06 C) Ø Rail-road ballast inspection Ø Pavement structure Ø Feature detection § FHWA Support Ø Demonstrations and participations in pilot implementations Ø Enhancements of data analysis and visualization tools