Introduction to Bioinformatics http www rproject org http

Introduction to Bioinformatics


http: //www. r-project. org/ http: //bis. zju. edu. cn/download/R/
")
Introduction to Bioinformatics 菜单栏 快捷按钮 控制台 命令行 R登陆界面(Windows版)
 2 ? t. test 3 help. search(\"t.")
Introduction to Bioinformatics 查看帮助文件 1 help("t. test") 2 ? t. test 3 help. search("t. test") 4 apropos("t. test") 5 RGui>Help>Html help 6 查看R包pdf手册
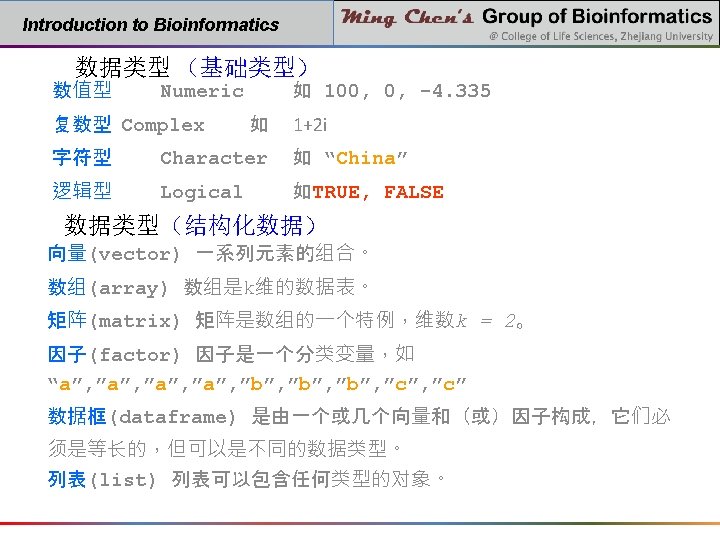
 数值型")
Introduction to Bioinformatics 向量的创建 字符型 character<-c("China", "Korea", "Japan", "UK", "USA", "France", "India", "Russia") 数值型 numeric<-c(1, 3, 6, 7, 3, 8, 6, 4) 逻辑型 logical<-c(T, F, F, T) rep(2, times=4) seq(from=3, to=21, by=3 ) 通过与向量的组合,产生更为复杂的向量。 rep(1: 2, c(10, 15)) 随机数的生成 runif(10, min = 0, max= 1) rnorm(10, mean = 0, sd = 1)
和matrix() >x <- 1: 12 >dim(x) <- c(3, 4) [,")
Introduction to Bioinformatics 矩阵的创建 dim()和matrix() >x <- 1: 12 >dim(x) <- c(3, 4) [, 1] [, 2] [, 3] [, 4] [1, ] 1 4 7 10 [2, ] 2 5 8 11 [3, ] 3 6 9 12 >matrix. x <- matrix(1: 12, nrow=3, byrow=T) >t(x) #转置 为行或列添加名称: row. names() col. names()
 # 按列组合成数据框 country. data<-cbind(character, numeric, logical) rbind() # 按行组合成数据框")
Introduction to Bioinformatics 数据框的创建 cbind() # 按列组合成数据框 country. data<-cbind(character, numeric, logical) rbind() # 按行组合成数据框 data. frame() #生成数据框 d <- data. frame(character, numeric, logical) head(d) #访问数据的前6行: 例子: st<-data. frame(Name=c("John", "James", "Ming"), Age=c(13, 12, 13), sex=c("F", "M", "F") )

Introduction to Bioinformatics

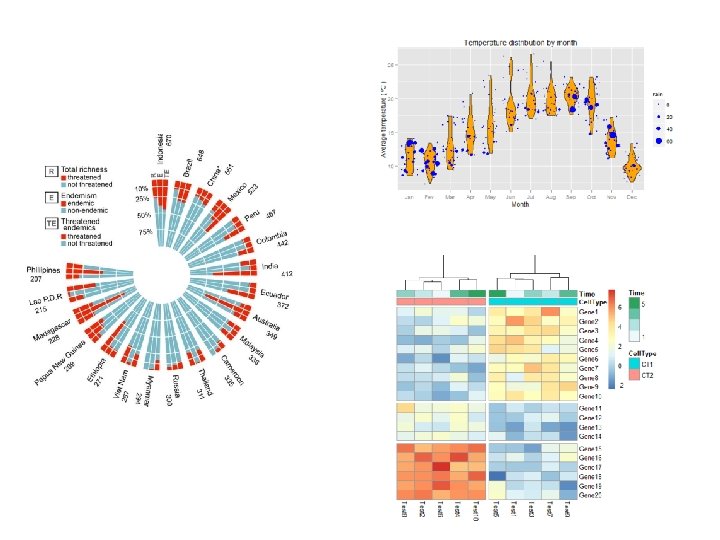
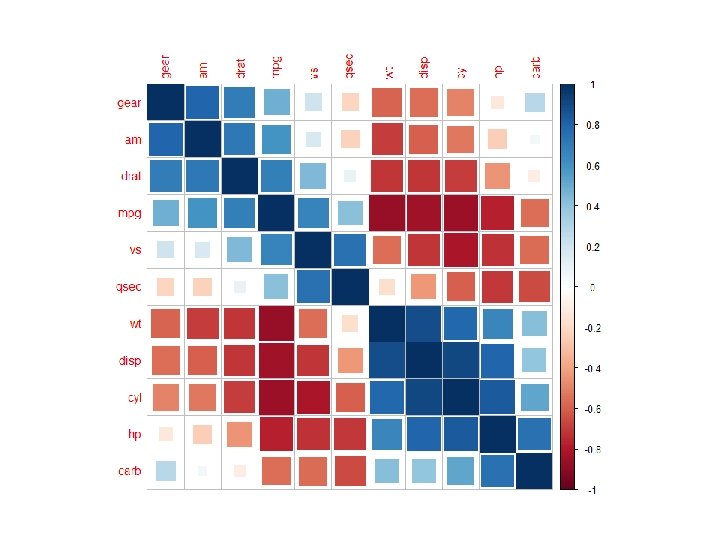
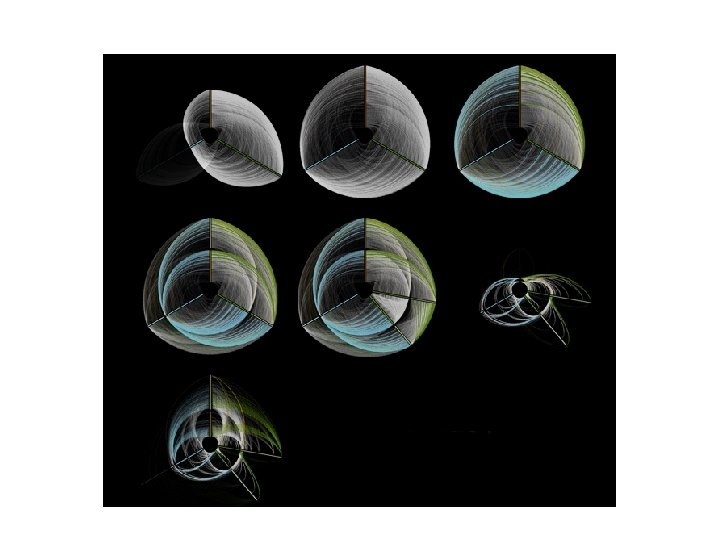
Introduction to Bioinformatics R绘图 R绘制的图形
 绘制散点图等多种图形 hist() 直方图 boxplot() 箱线图 stripchart() 点图 barplot() 条形图")
Introduction to Bioinformatics 绘图函数 plot() 绘制散点图等多种图形 hist() 直方图 boxplot() 箱线图 stripchart() 点图 barplot() 条形图 dotplot() 点图 piechart() 饼图 interaction. plot() matplot() Heatmap() ……
 函数或read. csv()函 数读取外部txt或csv格式的文件 (txt文件,制表符间隔; csv文件,逗号间 隔)。同样有write. table()和write. csv()。")
Introduction to Bioinformatics 外部数据读取 最为常用的数据读取方式是用read. table() 函数或read. csv()函 数读取外部txt或csv格式的文件 (txt文件,制表符间隔; csv文件,逗号间 隔)。同样有write. table()和write. csv()。 一些R程序包(如foreign)也提供了直接读取Excel, SAS, dbf, Matlab, spss, systat, Minitab文件的函数。 read. table(file=“…. ”, header = FALSE, sep = "", …) write. table(d, file = “d: /R/xx. txt", row. names = F, sep="t") # tab 分隔的文件
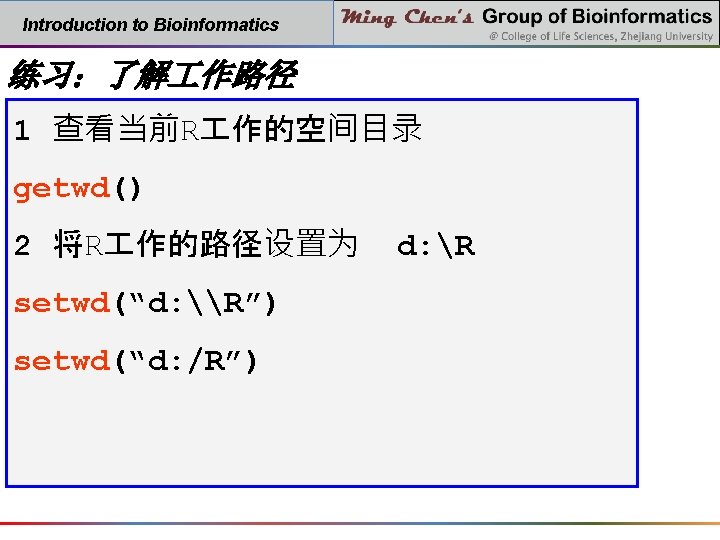
 • setwd(\"D: /\")")
实例:表达谱数据绘图 • 下载 http: //bis. zju. edu. cn/download/R/expressiondata. txt • getwd() • setwd("D: /") • exp=read. table("expressiondata. txt") • class(exp) • ? heatmap • exp 1=as. matrix(exp) • heatmap(exp 1)

- Slides: 25