Heating Cooling Curves Unit 10 Lesson 3 HeatingCooling


 & potential energy (PE) at each stage of")


 & energy for vaporization of water to")

 & potential energy (PE) at each stage of")

- Slides: 22
Heating & Cooling Curves Unit 10 Lesson 3
Heating/Cooling Curves: Show the change of state over time that occurs with the addition or removal of heat energy
What happens when you add heat to a solid? HEATING curve for water Temp Heat can be transferred even if there is no change in state 100 0 Ice at – 30. 0°C absorbs heat but stays SOLID while temperature rises to 0°C. Time
What happens as a solid melts? HEATING curve for water Temp 100 0 At 0°C ice begins to melt Time During a phase change, the temperature remains CONSTANT. This is because the heat being added is used to break IMFs holding the molecules together not to raise the temperature.
What happens when you add heat to a liquid? HEATING curve for water Temp 100 0 Water remains a LIQUID as it absorbs heat and goes from 0°C to 100°C. Time
What happens a liquid begins to change to a gas? HEATING curve for water Temp 100 0 At 100°C water begins to boil. The temperature will be constant until phase change is complete. Time
What happens you add heat to gas? HEATING curve for water Temp 100 0 After 100°C, the temperature of steam will continue to increase as heat is added. Time
HEATING curve 100 0 d i l so melting solid/liquid liquid/gas Time ga boiling s Temp Heating curves are endothermic as they absorb/gain heat.
What happens to Kinetic energy (KE) & potential energy (PE) at each stage of the curve? HEATING curve During a phase, KE is increasing (temp is increasing). During a phase change, KE is constant and PE is increasing. Temp PE 100 KE constant KE PE 0 KE constant KE Time KE
Calculating heat for each segment of the heating curve for water. Temp 100 The temperature of the ice is increasing. The specific heat for ice is 2. 05 J/g°C. LOOK in your ref. packet! 0 q 1 = mcpΔT Time
Calculate the amount of energy it takes to heat iron from 0°C to 557°C. (remains a solid the entire time) q = mcpΔT LOOK in your ref. packet for Cp for iron q = (2000 g) (0. 449 J/g°C) (557°C) q = 500, 000 J = 5. 0 x 10 5 J
Calculating heat for each segment of the heating curve for water. Temp 100 0 q 2 = m·Hf A phase change occurs at a constant temperature. Use the heat of fusion since is melting. Hf (water) = 334 J/g LOOK in your ref. packet! q 1 = mcpΔT Time
Calculating heat for each segment of the heating curve for water. Temp 100 q 3 = mcpΔT 0 q 2 = m·Hf The temperature of the water is increasing. The specific heat for water is 4. 18 J/g°C. LOOK in your ref. packet! q 1 = mcpΔT Time
Calculating heat for each segment of the heating curve for water. Temp q 4 = m·Hv 100 q 3 = mcpΔT 0 q 2 = m·Hf A phase change occurs at a constant temperature. Use the heat of vaporization. Hv (water) = 2260 J/g LOOK in your ref. packet! q 1 = mcpΔT Time
Calculating heat for each segment of the heating curve for water. Temp q 4 = m·Hv 100 q 3 = mcpΔT 0 q 2 = m·Hf q 5 = mcpΔT The temperature of the steam is increasing. The specific heat for steam is 2. 02 J/g°C. LOOK in your ref. packet! q 1 = mcpΔT Time
Calculating heat for each segment of the heating curve for water. Temp q 4 = m·Hv 100 q 3 = mcpΔT 0 q 2 = m·Hf q 5 = mcpΔT Use q = mcpΔT when the temperature is changing. Use q = m·Hf or q = m·Hv when there is a phase change. q 1 = mcpΔT Time
Calculating heat for each segment of the heating curve for water. Temp q 4 = m·Hv 100 q 3 = mcpΔT 0 q 5 = mcpΔT The total amount of heat absorbed is the sum of all five equations: qtot= q 1+q 2+q 3+q 4+q 5 q 2 = m·Hf q 1 = mcpΔT Time
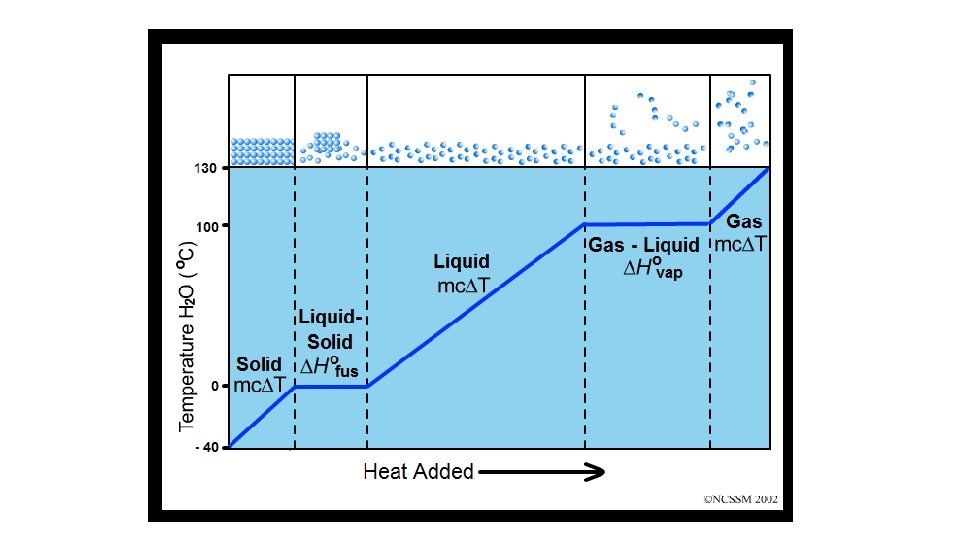
NOTICE! It takes more time (longer line) & energy for vaporization of water to occur than melting. WHY? Look at the pictures to the right. Temp q 4 = m·Hv 100 0 q 2 = m·Hf Hf (water) = 334 J/g Hv (water) = 2260 J/g Time
COOLING curve Temp 100 Cooling curves are exothermic as they release/lose heat. gas condensation liquid/gas liquid freezing solid/liquid 0 solid Hv may be used to determine amount of heat released during condensation Time Hf may be used to determine amount of heat released during freezing
What happens to Kinetic energy (KE) & potential energy (PE) at each stage of the curve? COOLING curve During a phase, KE is decreasing (temp is decreasing). During a phase change, KE is constant and PE is decreasing. Temp 100 KE PE KE constant KE PE 0 KE constant Time KE
How much heat is released when 275 grams of water freezes? q = m·Hf q = (275 g)(334 J/g) q = 91, 850 J q = 91. 9 k. J