GPM Applications Workshop GPM Data Access Training Amita


- Slides: 66
GPM Applications Workshop GPM Data Access Training Amita Mehta Joint Center for Earth Systems Technology/GSFC amita. v. mehta@nasa. gov June 11, 2015 1
GPM Data Access Training Acknowledgements: Dalia Kirschbaum and George Huffman GPM Applications, NASA-GSFC dalia. b. kirschbaum@nasa. gov, george. j. huffman@nasa. gov NASA Applied Remote Sensing Training (ARSET) http: //arset. gsfc. nasa. gov Owen Kelley (Precipitation Processing System) Owen. A. Kelley@nasa. gov GES-DISC Giovanni Team gsfc-help-disc@lists. nasa. gov June 11, 2015 2
Training Objective § To Provide an overview of the Global Precipitation Measurement (GPM) mission data products and data access tools, and provide data access and analysis experience through computer-based exercises 3
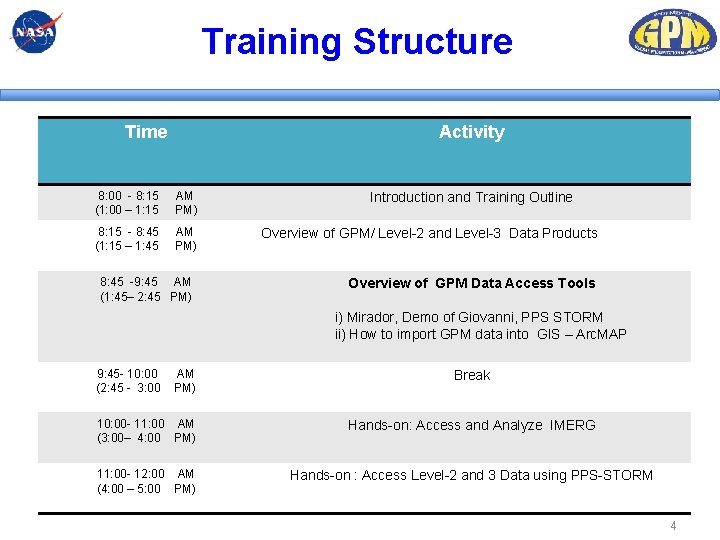
Training Structure Time Activity 8: 00 - 8: 15 (1: 00 – 1: 15 AM PM) 8: 15 - 8: 45 (1: 15 – 1: 45 AM PM) 8: 45 -9: 45 AM (1: 45– 2: 45 PM) Introduction and Training Outline Overview of GPM/ Level-2 and Level-3 Data Products Overview of GPM Data Access Tools i) Mirador, Demo of Giovanni, PPS STORM ii) How to import GPM data into GIS – Arc. MAP 9: 45 - 10: 00 (2: 45 - 3: 00 AM PM) Break 10: 00 - 11: 00 AM (3: 00– 4: 00 PM) Hands-on: Access and Analyze IMERG 11: 00 - 12: 00 AM (4: 00 – 5: 00 PM) Hands-on : Access Level-2 and 3 Data using PPS-STORM 4
Overview of GPM Level-2 and Level-3 Data Products 5
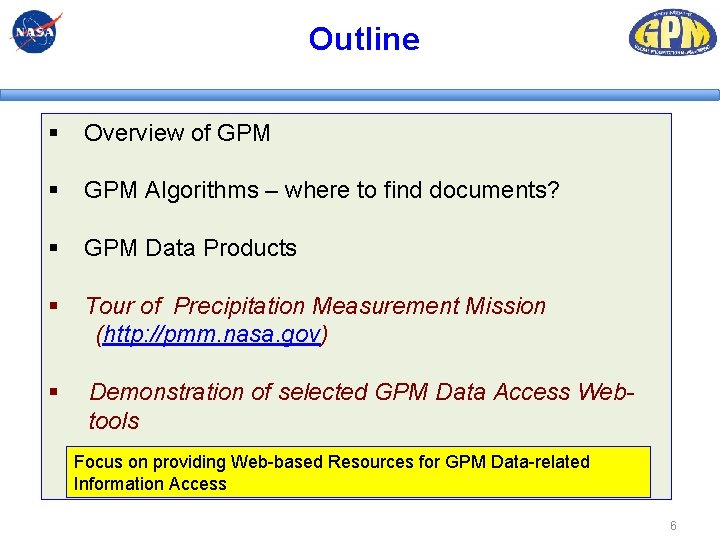
Outline § Overview of GPM § GPM Algorithms – where to find documents? § GPM Data Products § Tour of Precipitation Measurement Mission (http: //pmm. nasa. gov) § Demonstration of selected GPM Data Access Webtools Focus on providing Web-based Resources for GPM Data-related Information Access 6
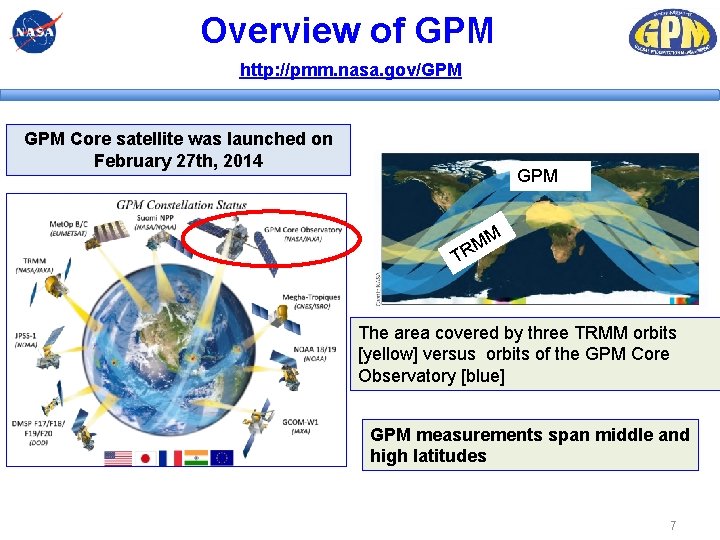
Overview of GPM http: //pmm. nasa. gov/GPM Core satellite was launched on February 27 th, 2014 GPM M M R T The area covered by three TRMM orbits [yellow] versus orbits of the GPM Core Observatory [blue] GPM measurements span middle and high latitudes 7
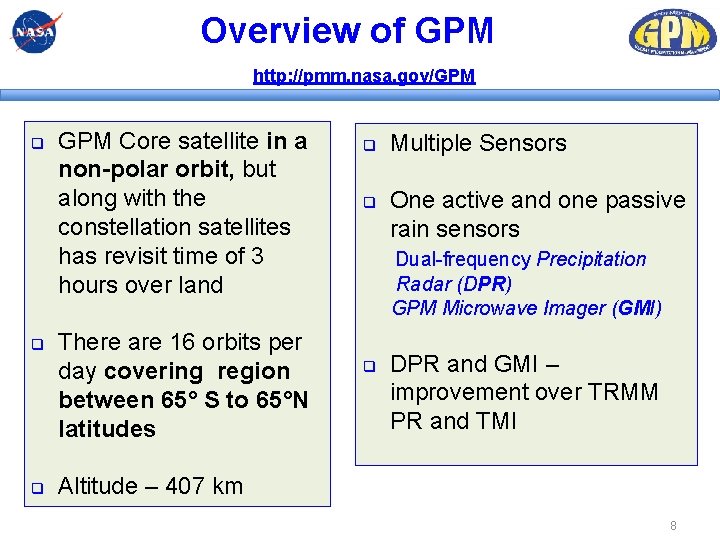
Overview of GPM http: //pmm. nasa. gov/GPM q q q GPM Core satellite in a non-polar orbit, but along with the constellation satellites has revisit time of 3 hours over land There are 16 orbits per day covering region between 65° S to 65°N latitudes q q Multiple Sensors One active and one passive rain sensors Dual-frequency Precipitation Radar (DPR) GPM Microwave Imager (GMI) q DPR and GMI – improvement over TRMM PR and TMI Altitude – 407 km 8
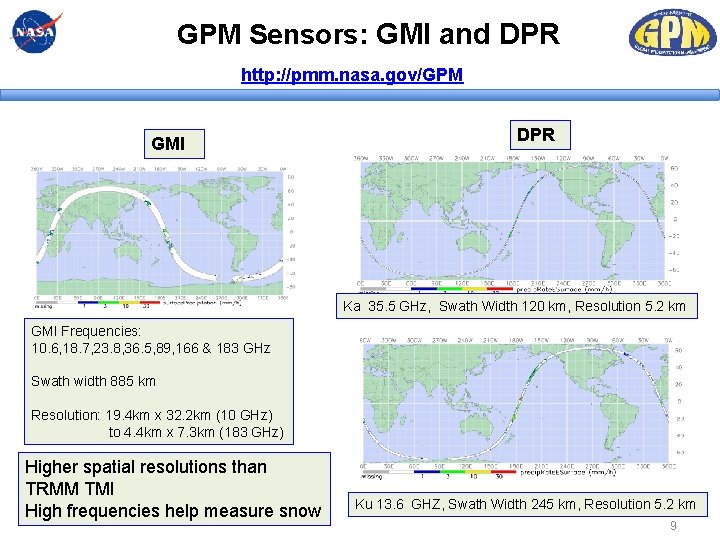
GPM Sensors: GMI and DPR http: //pmm. nasa. gov/GPM GMI DPR Ka 35. 5 GHz, Swath Width 120 km, Resolution 5. 2 km GMI Frequencies: 10. 6, 18. 7, 23. 8, 36. 5, 89, 166 & 183 GHz Swath width 885 km Resolution: 19. 4 km x 32. 2 km (10 GHz) to 4. 4 km x 7. 3 km (183 GHz) Higher spatial resolutions than TRMM TMI High frequencies help measure snow Ku 13. 6 GHZ, Swath Width 245 km, Resolution 5. 2 km 9
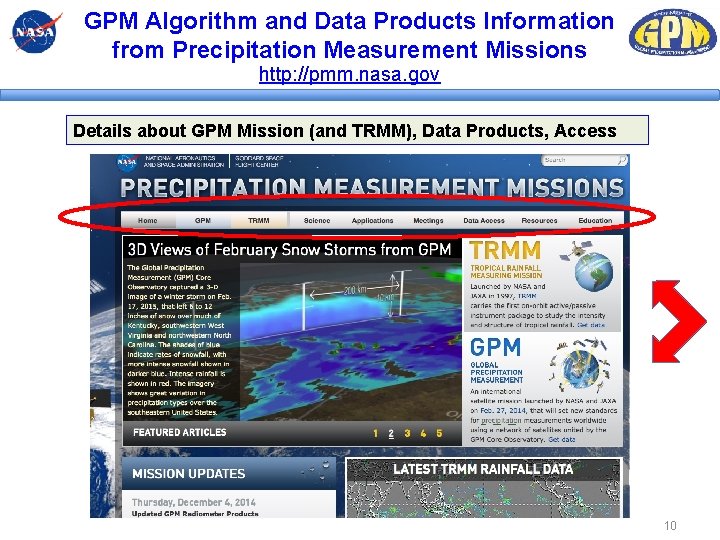
GPM Algorithm and Data Products Information from Precipitation Measurement Missions http: //pmm. nasa. gov Details about GPM Mission (and TRMM), Data Products, Access 10
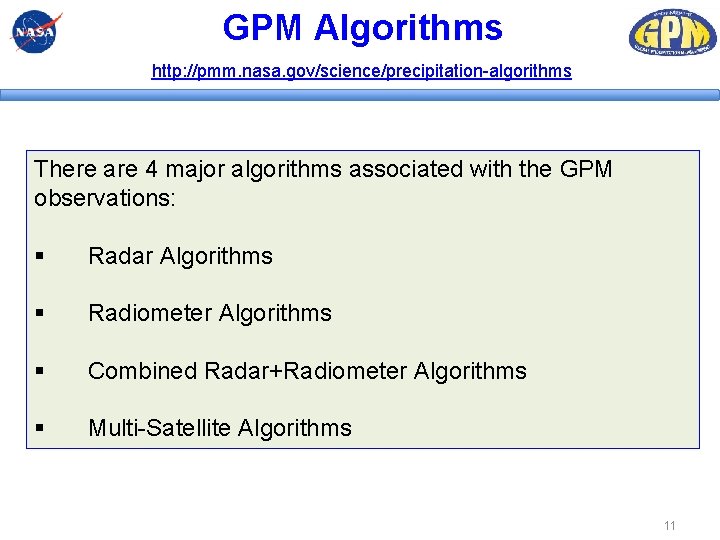
GPM Algorithms http: //pmm. nasa. gov/science/precipitation-algorithms There are 4 major algorithms associated with the GPM observations: § Radar Algorithms § Radiometer Algorithms § Combined Radar+Radiometer Algorithms § Multi-Satellite Algorithms 11
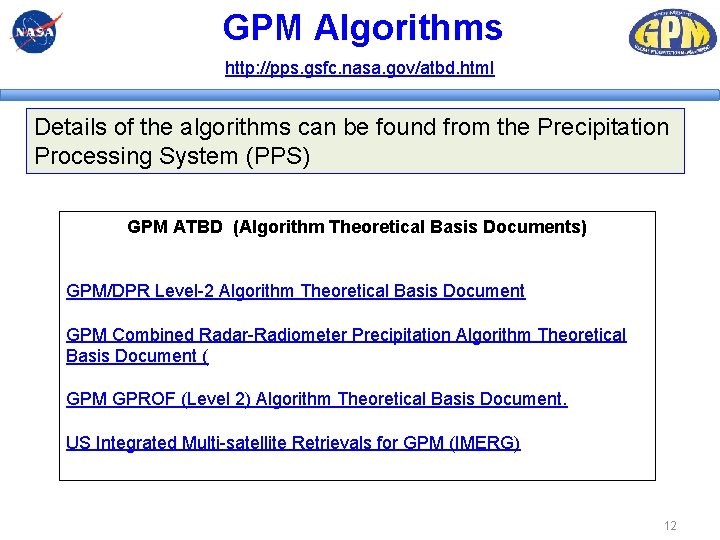
GPM Algorithms http: //pps. gsfc. nasa. gov/atbd. html Details of the algorithms can be found from the Precipitation Processing System (PPS) GPM ATBD (Algorithm Theoretical Basis Documents) GPM/DPR Level-2 Algorithm Theoretical Basis Document GPM Combined Radar-Radiometer Precipitation Algorithm Theoretical Basis Document ( GPM GPROF (Level 2) Algorithm Theoretical Basis Document. US Integrated Multi-satellite Retrievals for GPM (IMERG) 12
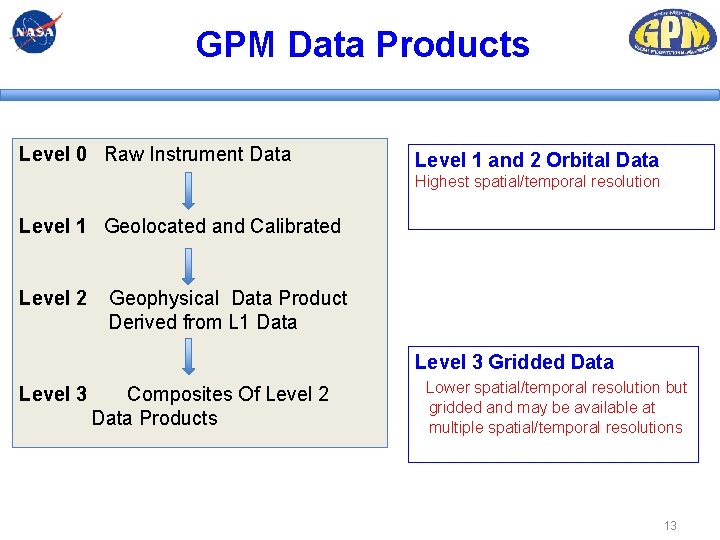
GPM Data Products Level 0 Raw Instrument Data Level 1 and 2 Orbital Data Highest spatial/temporal resolution Level 1 Geolocated and Calibrated Level 2 Geophysical Data Product Derived from L 1 Data Level 3 Gridded Data Level 3 Composites Of Level 2 Data Products Lower spatial/temporal resolution but gridded and may be available at multiple spatial/temporal resolutions 13
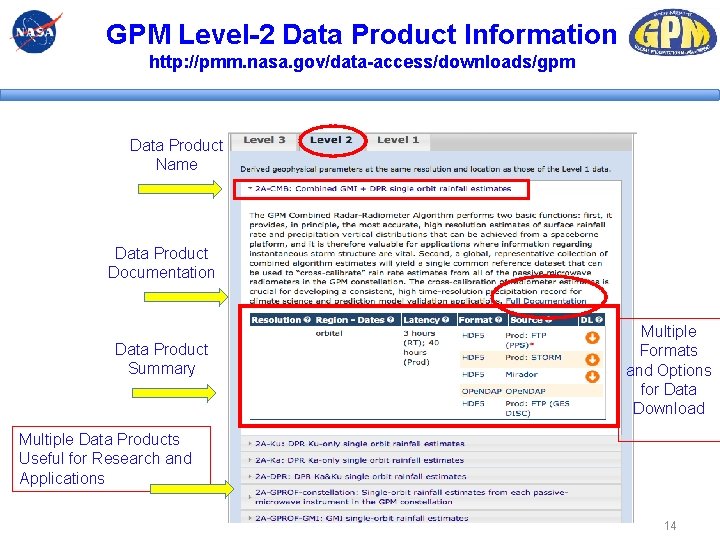
GPM Level-2 Data Product Information http: //pmm. nasa. gov/data-access/downloads/gpm Data Product Name Data Product Documentation Data Product Summary Multiple Formats and Options for Data Download Multiple Data Products Useful for Research and Applications 14
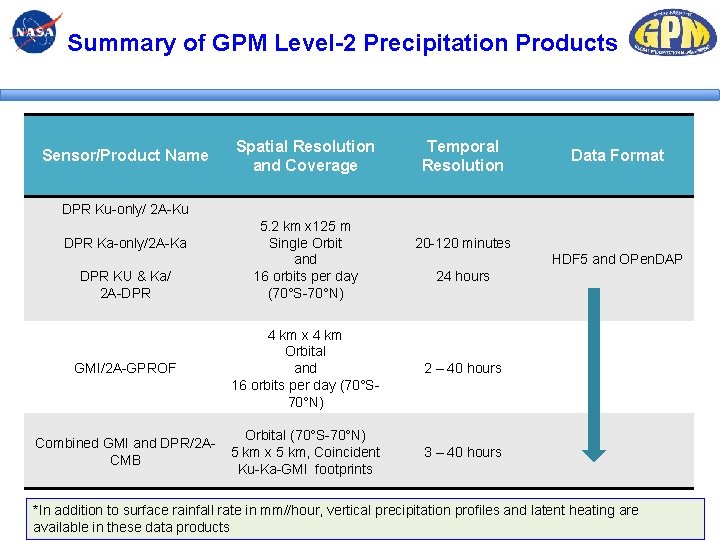
Summary of GPM Level-2 Precipitation Products Sensor/Product Name Spatial Resolution and Coverage Temporal Resolution Data Format DPR Ku-only/ 2 A-Ku DPR Ka-only/2 A-Ka DPR KU & Ka/ 2 A-DPR 5. 2 km x 125 m Single Orbit and 16 orbits per day (70°S-70°N) 20 -120 minutes HDF 5 and OPen. DAP 24 hours GMI/2 A-GPROF 4 km x 4 km Orbital and 16 orbits per day (70°S 70°N) 2 – 40 hours Combined GMI and DPR/2 ACMB Orbital (70°S-70°N) 5 km x 5 km, Coincident Ku-Ka-GMI footprints 3 – 40 hours *In addition to surface rainfall rate in mm//hour, vertical precipitation profiles and latent heating are available in these data products 15
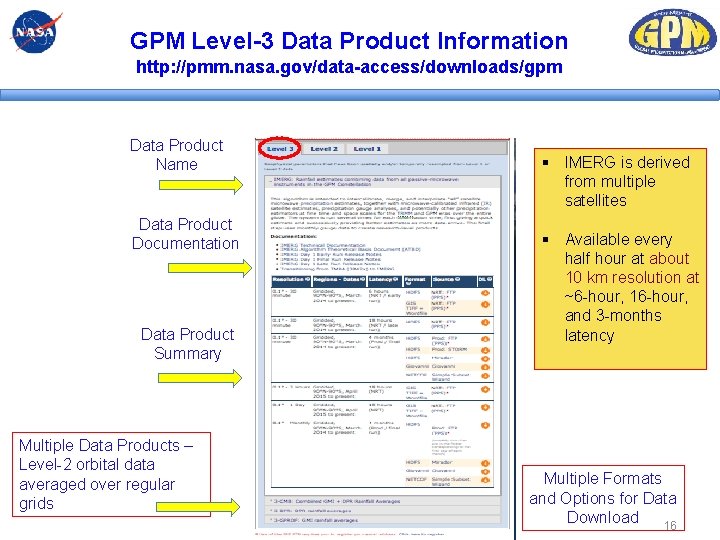
GPM Level-3 Data Product Information http: //pmm. nasa. gov/data-access/downloads/gpm Data Product Name Data Product Documentation Data Product Summary Multiple Data Products – Level-2 orbital data averaged over regular grids § IMERG is derived from multiple satellites § Available every half hour at about 10 km resolution at ~6 -hour, 16 -hour, and 3 -months latency Multiple Formats and Options for Data Download 16
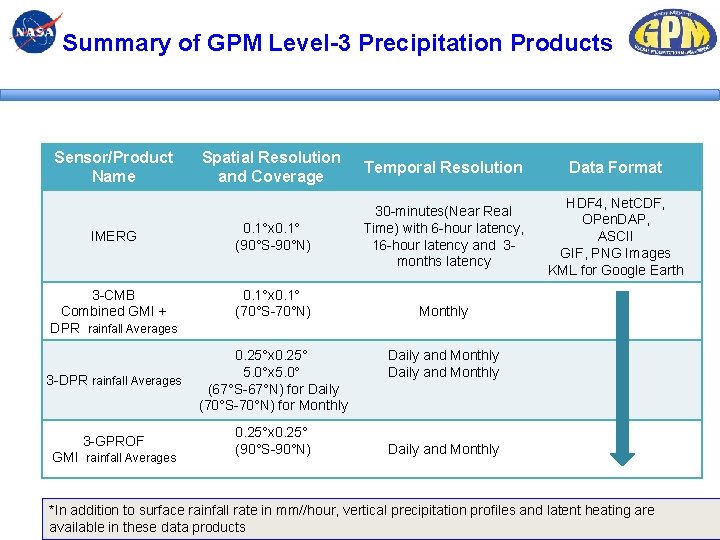
Summary of GPM Level-3 Precipitation Products Sensor/Product Name IMERG 3 -CMB Combined GMI + DPR rainfall Averages Spatial Resolution and Coverage Temporal Resolution Data Format 0. 1°x 0. 1° (90°S-90°N) 30 -minutes(Near Real Time) with 6 -hour latency, 16 -hour latency and 3 months latency HDF 4, Net. CDF, OPen. DAP, ASCII GIF, PNG Images KML for Google Earth 0. 1°x 0. 1° (70°S-70°N) 3 -DPR rainfall Averages 0. 25°x 0. 25° 5. 0°x 5. 0° (67°S-67°N) for Daily (70°S-70°N) for Monthly 3 -GPROF 0. 25°x 0. 25° (90°S-90°N) GMI rainfall Averages Monthly Daily and Monthly *In addition to surface rainfall rate in mm//hour, vertical precipitation profiles and latent heating are 17 available in these data products
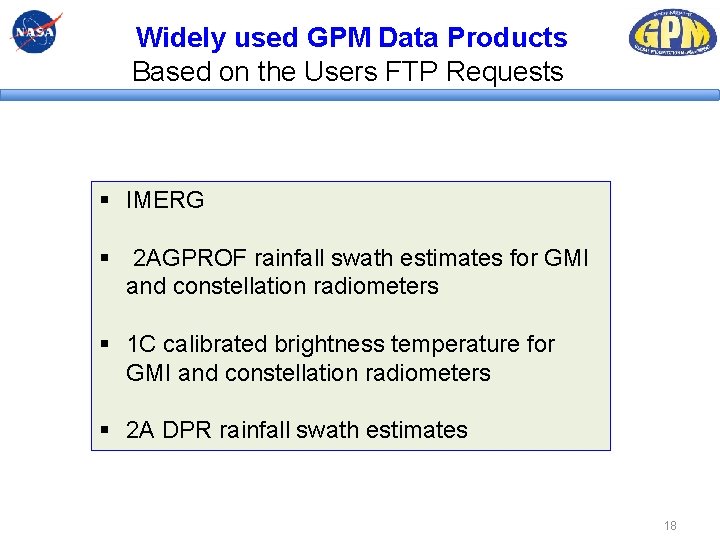
Widely used GPM Data Products Based on the Users FTP Requests § IMERG § 2 AGPROF rainfall swath estimates for GMI and constellation radiometers § 1 C calibrated brightness temperature for GMI and constellation radiometers § 2 A DPR rainfall swath estimates 18
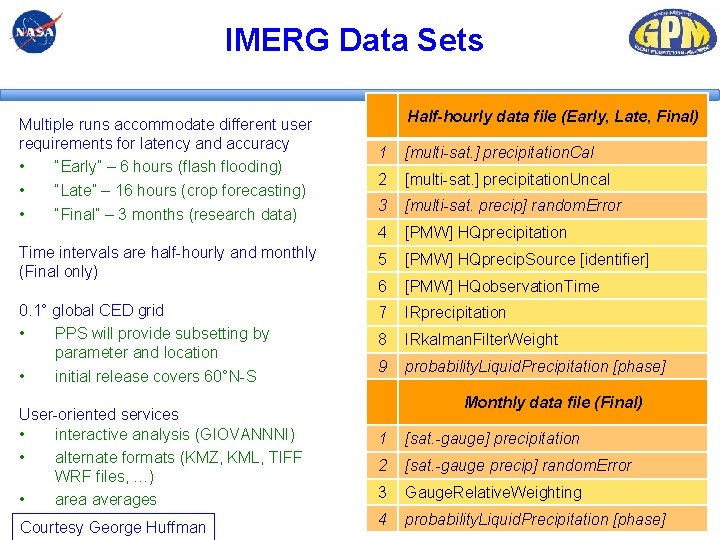
IMERG Data Sets Multiple runs accommodate different user requirements for latency and accuracy • “Early” – 6 hours (flash flooding) • “Late” – 16 hours (crop forecasting) • “Final” – 3 months (research data) Half-hourly data file (Early, Late, Final) 1 [multi-sat. ] precipitation. Cal 2 [multi-sat. ] precipitation. Uncal 3 [multi-sat. precip] random. Error 4 [PMW] HQprecipitation Time intervals are half-hourly and monthly (Final only) 5 [PMW] HQprecip. Source [identifier] 6 [PMW] HQobservation. Time 0. 1° global CED grid • PPS will provide subsetting by parameter and location • initial release covers 60°N-S 7 IRprecipitation 8 IRkalman. Filter. Weight 9 probability. Liquid. Precipitation [phase] User-oriented services • interactive analysis (GIOVANNNI) • alternate formats (KMZ, KML, TIFF WRF files, …) • area averages Courtesy George Huffman Monthly data file (Final) 1 [sat. -gauge] precipitation 2 [sat. -gauge precip] random. Error 3 Gauge. Relative. Weighting 4 probability. Liquid. Precipitation [phase]
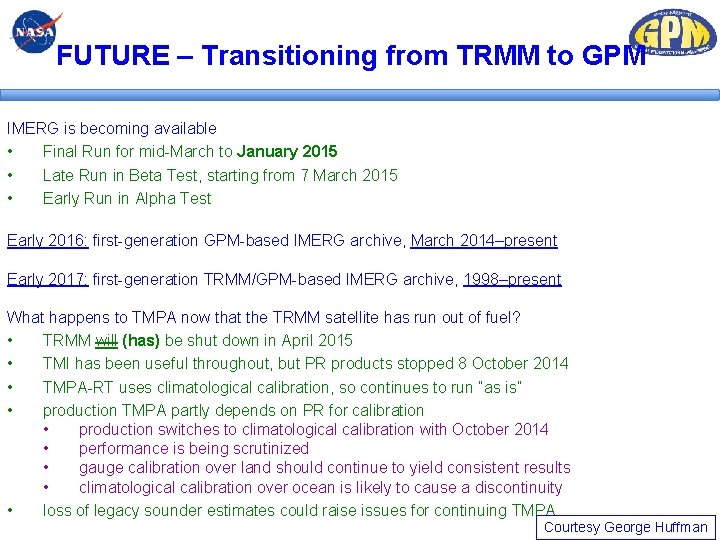
FUTURE – Transitioning from TRMM to GPM IMERG is becoming available • Final Run for mid-March to January 2015 • Late Run in Beta Test, starting from 7 March 2015 • Early Run in Alpha Test Early 2016: first-generation GPM-based IMERG archive, March 2014–present Early 2017: first-generation TRMM/GPM-based IMERG archive, 1998–present What happens to TMPA now that the TRMM satellite has run out of fuel? • TRMM will (has) be shut down in April 2015 • TMI has been useful throughout, but PR products stopped 8 October 2014 • TMPA-RT uses climatological calibration, so continues to run “as is” • production TMPA partly depends on PR for calibration • production switches to climatological calibration with October 2014 • performance is being scrutinized • gauge calibration over land should continue to yield consistent results • climatological calibration over ocean is likely to cause a discontinuity • loss of legacy sounder estimates could raise issues for continuing TMPA Courtesy George Huffman
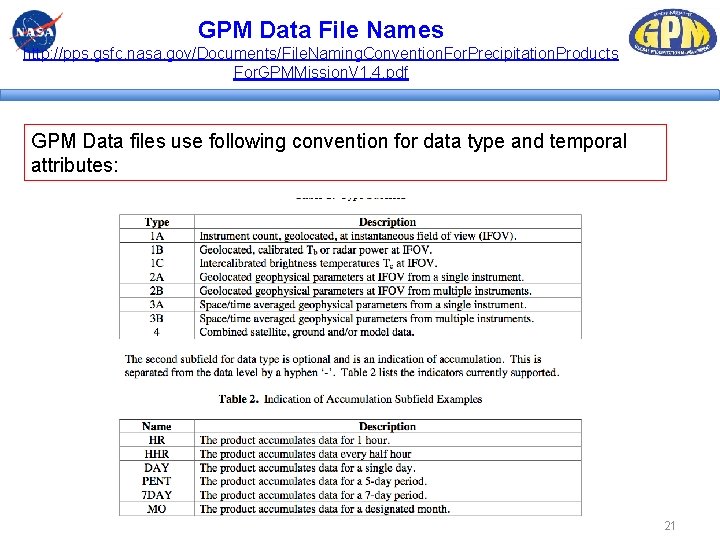
GPM Data File Names http: //pps. gsfc. nasa. gov/Documents/File. Naming. Convention. For. Precipitation. Products For. GPMMission. V 1. 4. pdf GPM Data files use following convention for data type and temporal attributes: 21
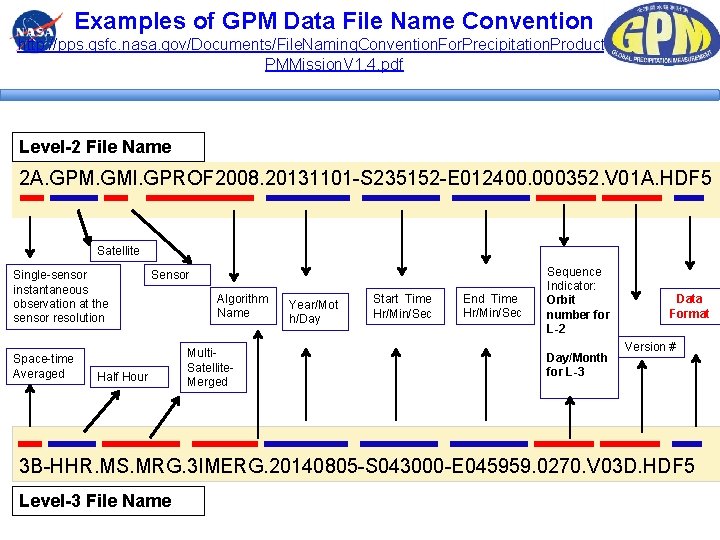
Examples of GPM Data File Name Convention http: //pps. gsfc. nasa. gov/Documents/File. Naming. Convention. For. Precipitation. Products. For. G PMMission. V 1. 4. pdf Level-2 File Name 2 A. GPM. GMI. GPROF 2008. 20131101 -S 235152 -E 012400. 000352. V 01 A. HDF 5 Satellite Single-sensor instantaneous observation at the sensor resolution Space-time Averaged Sensor Half Hour Algorithm Name Multi. Satellite. Merged Year/Mot h/Day Start Time Hr/Min/Sec End Time Hr/Min/Sec Sequence Indicator: Orbit number for L-2 Day/Month for L-3 Data Format Version # 3 B-HHR. MS. MRG. 3 IMERG. 20140805 -S 043000 -E 045959. 0270. V 03 D. HDF 5 Level-3 File Name
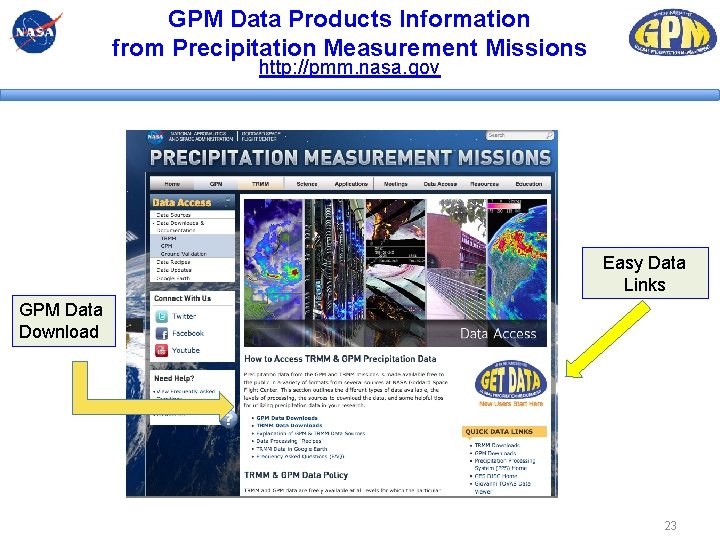
GPM Data Products Information from Precipitation Measurement Missions http: //pmm. nasa. gov Easy Data Links GPM Data Download 23
Tour of Precipitation Measurement Missions (http: //pmm. nasa. gov) 24
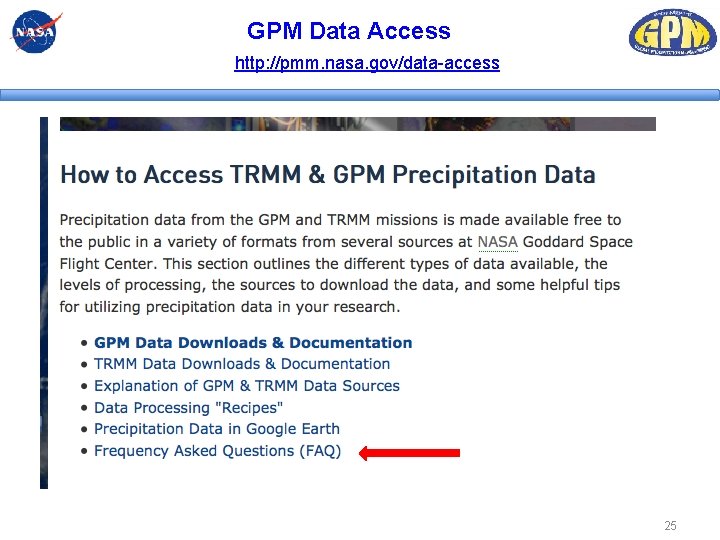
GPM Data Access http: //pmm. nasa. gov/data-access 25
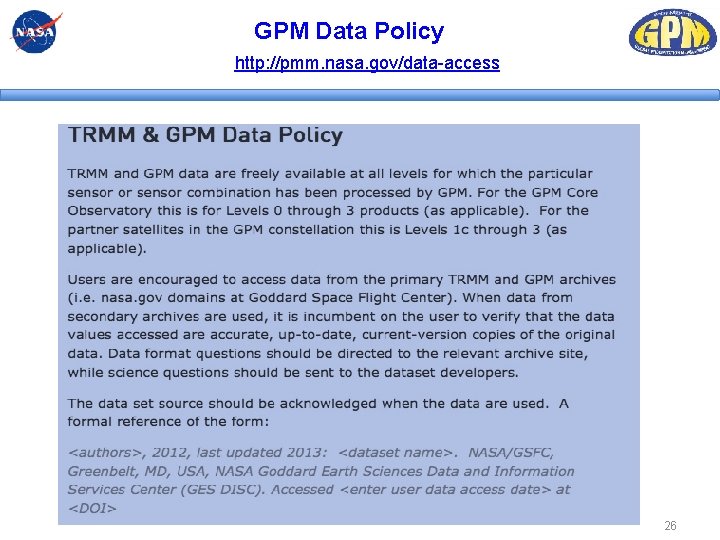
GPM Data Policy http: //pmm. nasa. gov/data-access 26
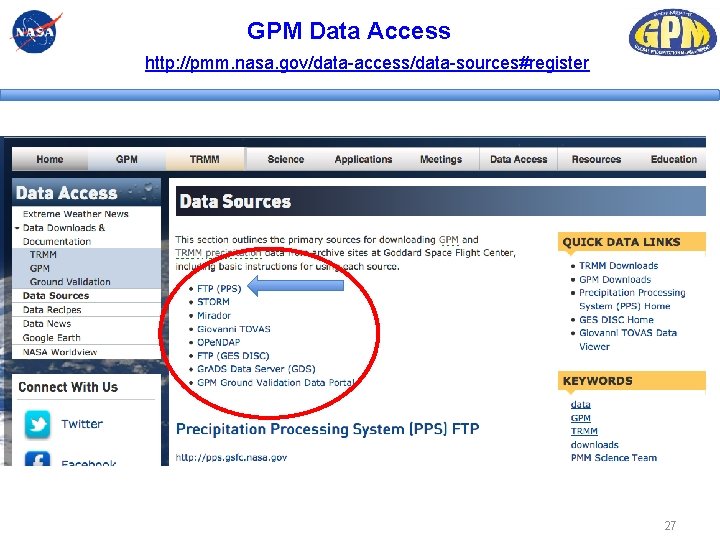
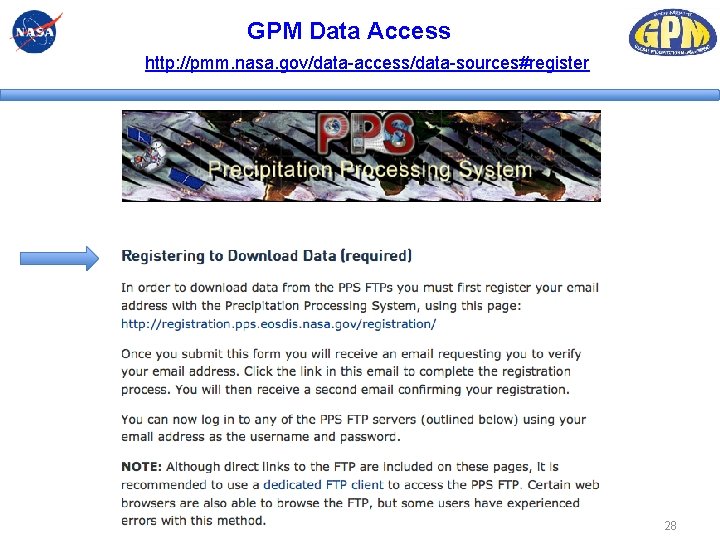
GPM Data Access http: //pmm. nasa. gov/data-access/data-sources#register 27
GPM Data Access http: //pmm. nasa. gov/data-access/data-sources#register 28
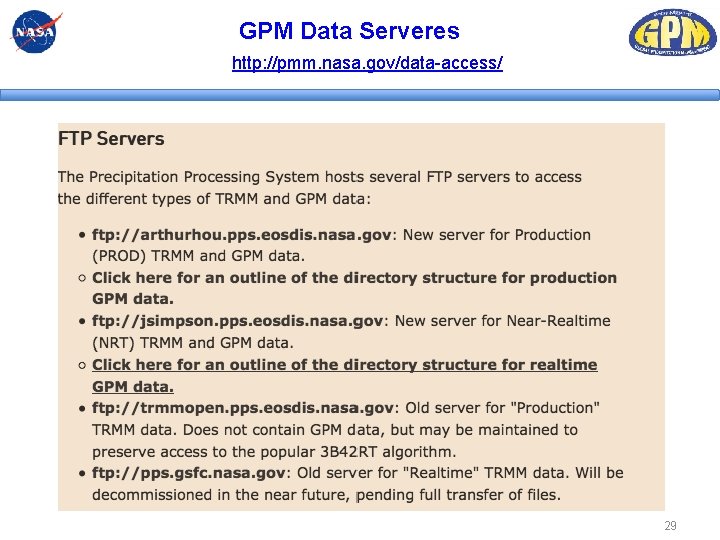
GPM Data Serveres http: //pmm. nasa. gov/data-access/ 29
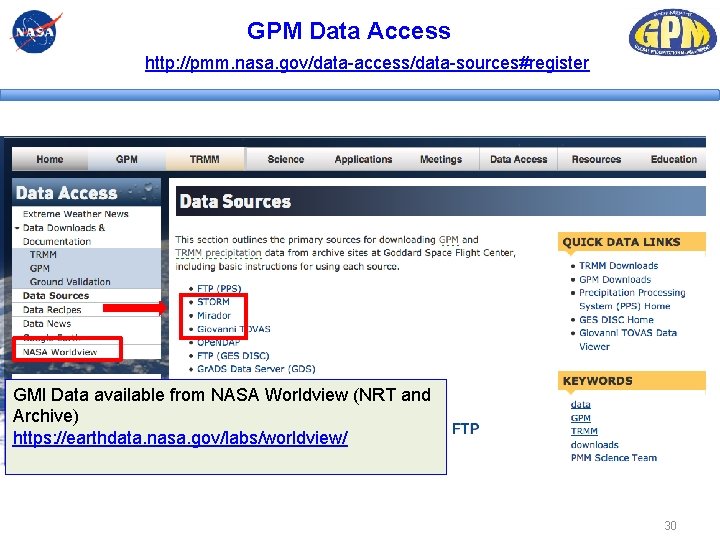
GPM Data Access http: //pmm. nasa. gov/data-access/data-sources#register GMI Data available from NASA Worldview (NRT and Archive) https: //earthdata. nasa. gov/labs/worldview/ 30
Overview of Selected GPM Data Access Tools i) Mirador, Demo of Giovanni and PPS STORM ii) How to import GPM data into GIS – Arc. MAP 31
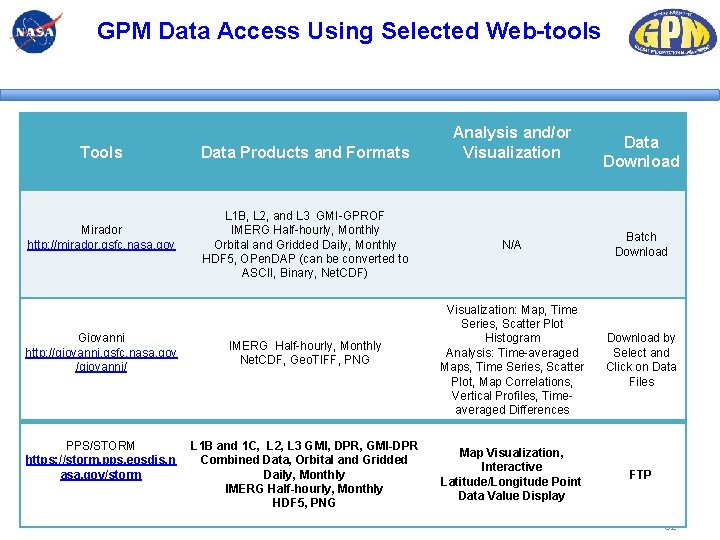
GPM Data Access Using Selected Web-tools Tools Mirador http: //mirador. gsfc. nasa. gov Giovanni http: //giovanni. gsfc. nasa. gov /giovanni/ PPS/STORM https: //storm. pps. eosdis. n asa. gov/storm Data Products and Formats L 1 B, L 2, and L 3 GMI-GPROF IMERG Half-hourly, Monthly Orbital and Gridded Daily, Monthly HDF 5, OPen. DAP (can be converted to ASCII, Binary, Net. CDF) IMERG Half-hourly, Monthly Net. CDF, Geo. TIFF, PNG L 1 B and 1 C, L 2, L 3 GMI, DPR, GMI-DPR Combined Data, Orbital and Gridded Daily, Monthly IMERG Half-hourly, Monthly HDF 5, PNG Analysis and/or Visualization Data Download N/A Batch Download Visualization: Map, Time Series, Scatter Plot Histogram Analysis: Time-averaged Maps, Time Series, Scatter Plot, Map Correlations, Vertical Profiles, Timeaveraged Differences Download by Select and Click on Data Files Map Visualization, Interactive Latitude/Longitude Point Data Value Display FTP 32
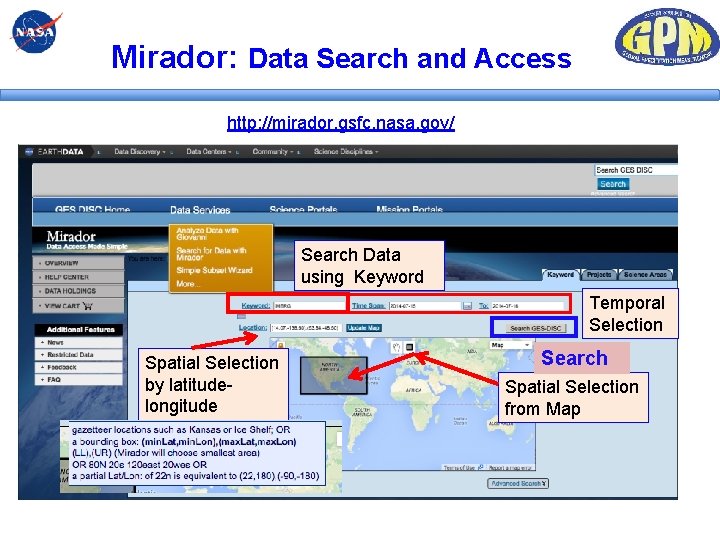
Mirador: Data Search and Access http: //mirador. gsfc. nasa. gov/ Search Data using Keyword Temporal Selection Spatial Selection by latitudelongitude Search Spatial Selection from Map
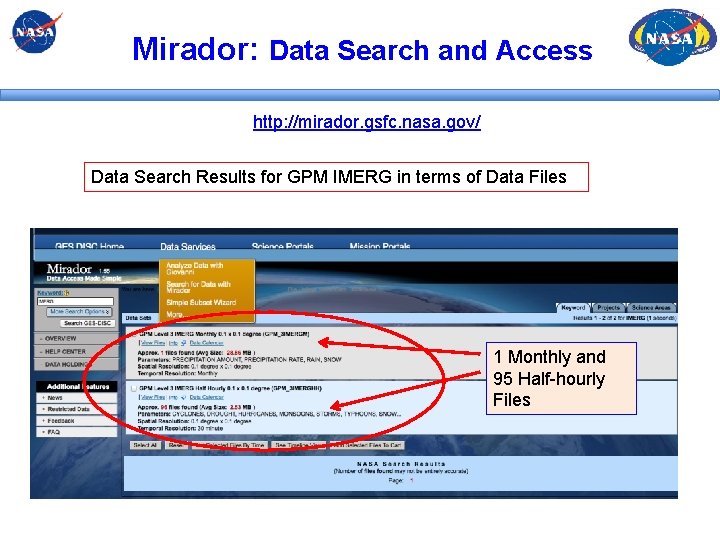
Mirador: Data Search and Access http: //mirador. gsfc. nasa. gov/ Data Search Results for GPM IMERG in terms of Data Files 1 Monthly and 95 Half-hourly Files
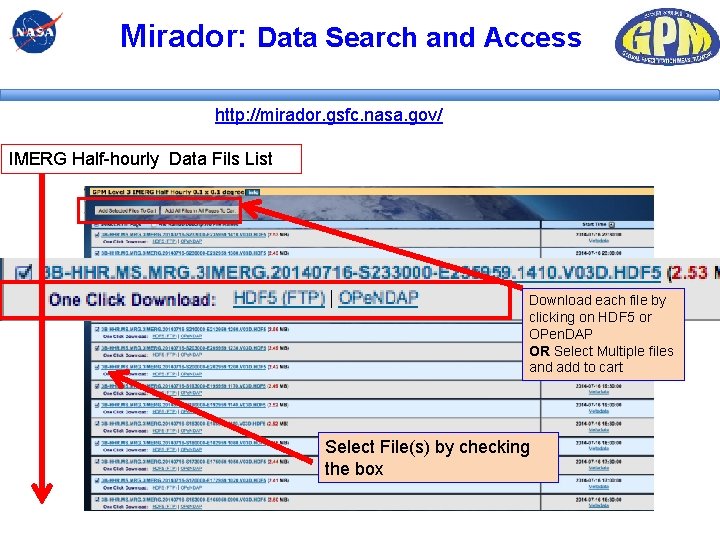
Mirador: Data Search and Access http: //mirador. gsfc. nasa. gov/ IMERG Half-hourly Data Fils List Download each file by clicking on HDF 5 or OPen. DAP OR Select Multiple files and add to cart Select File(s) by checking the box
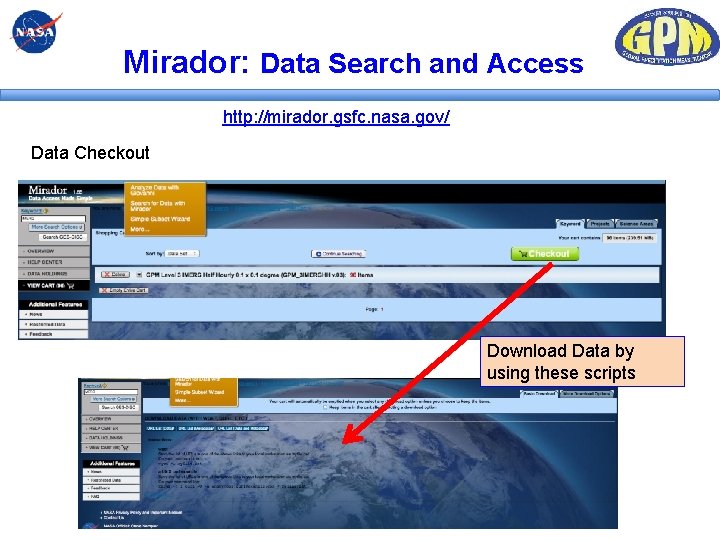
Mirador: Data Search and Access http: //mirador. gsfc. nasa. gov/ Data Checkout Download Data by using these scripts
Mirador: Data Search and Access Mirador is useful for searching data and downloading multiple data files GPM L 1, L 2, and L 3 Data are available from Mirador
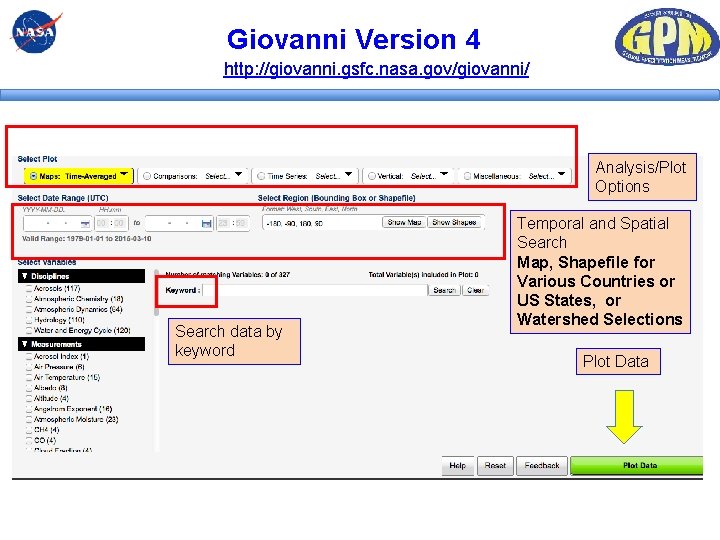
Giovanni Version 4 http: //giovanni. gsfc. nasa. gov/giovanni/ Analysis/Plot Options Search data by keyword Temporal and Spatial Search Map, Shapefile for Various Countries or US States, or Watershed Selections Plot Data
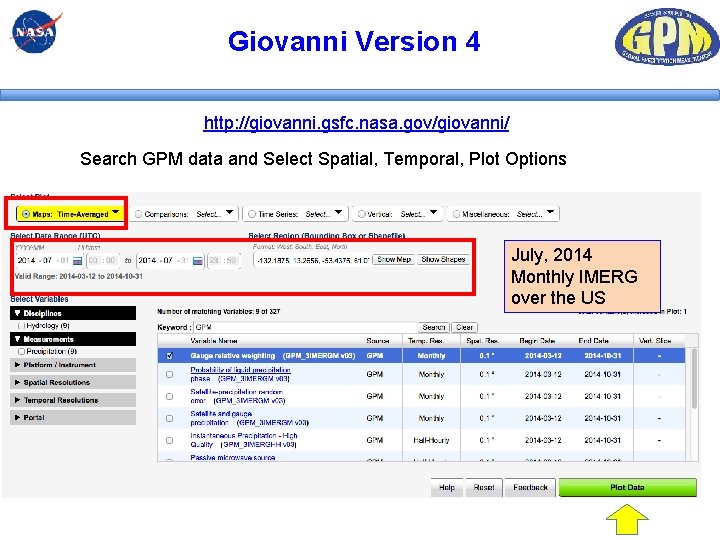
Giovanni Version 4 http: //giovanni. gsfc. nasa. gov/giovanni/ Search GPM data and Select Spatial, Temporal, Plot Options July, 2014 Monthly IMERG over the US
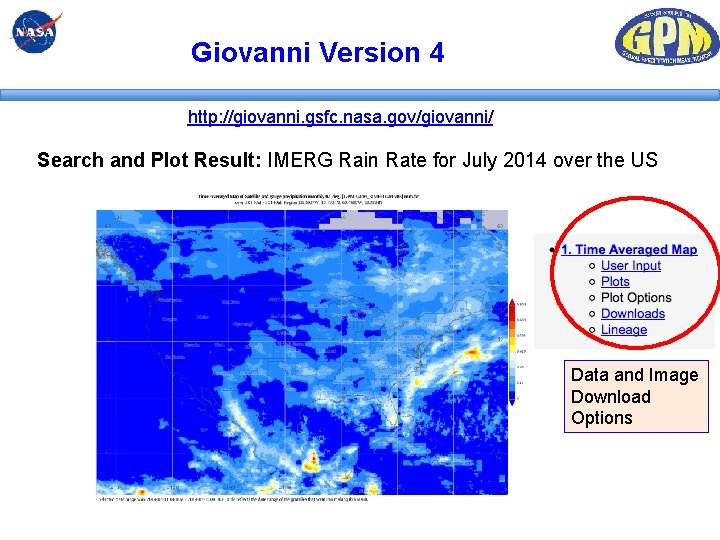
Giovanni Version 4 http: //giovanni. gsfc. nasa. gov/giovanni/ Search and Plot Result: IMERG Rain Rate for July 2014 over the US Data and Image Download Options
Giovanni Version 4 http: //giovanni. gsfc. nasa. gov/giovanni/ Giovanni is: 1) useful for searching and downloading data files in multiple formats 2) very convenient for data analysis and visualization Live Overview of Giovanni
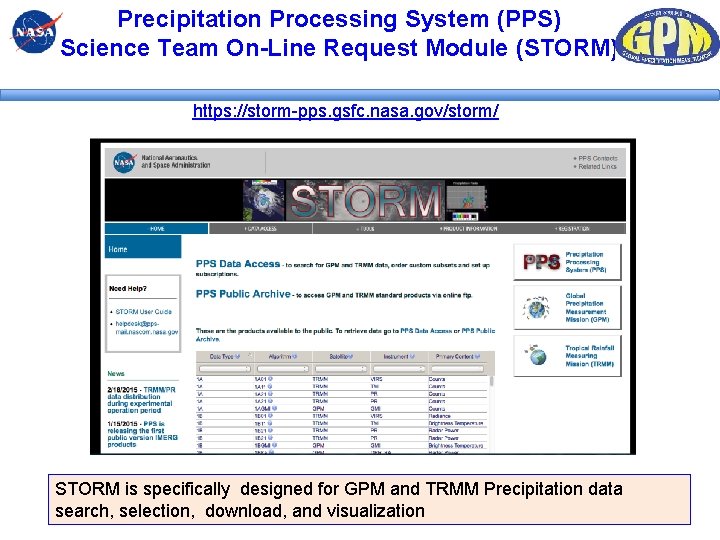
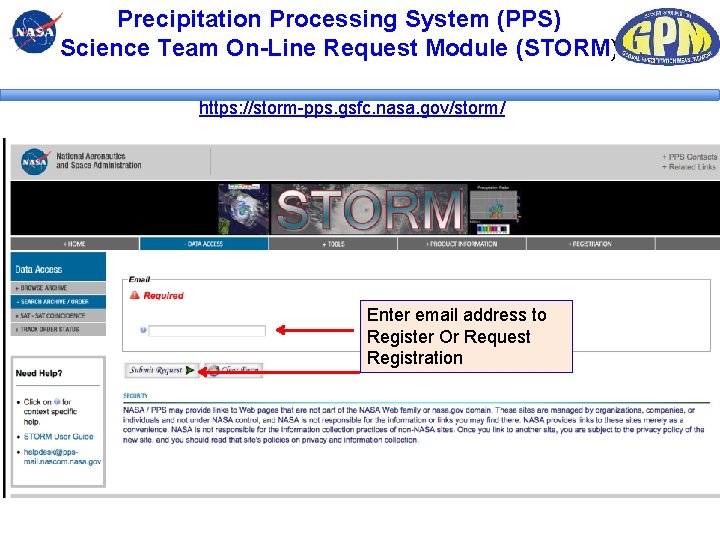
Precipitation Processing System (PPS) Science Team On-Line Request Module (STORM) https: //storm-pps. gsfc. nasa. gov/storm/ STORM is specifically designed for GPM and TRMM Precipitation data search, selection, download, and visualization
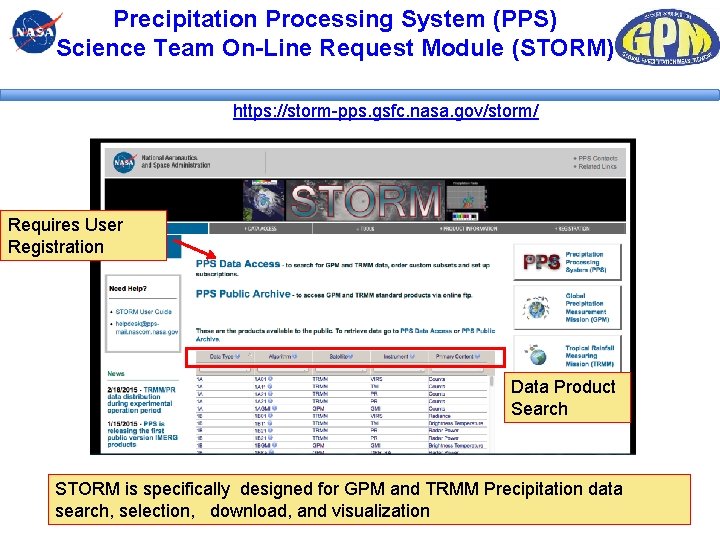
Precipitation Processing System (PPS) Science Team On-Line Request Module (STORM) https: //storm-pps. gsfc. nasa. gov/storm/ Requires User Registration Data Product Search STORM is specifically designed for GPM and TRMM Precipitation data search, selection, download, and visualization
Precipitation Processing System (PPS) Science Team On-Line Request Module (STORM) https: //storm-pps. gsfc. nasa. gov/storm/ Enter email address to Register Or Request Registration
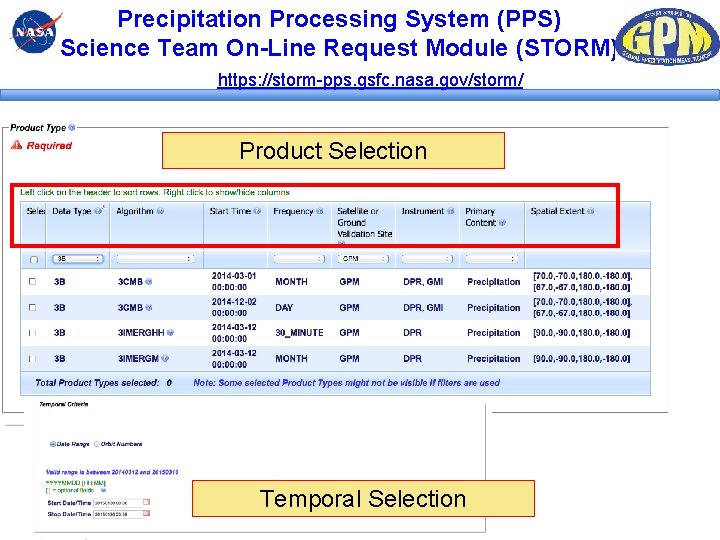
Precipitation Processing System (PPS) Science Team On-Line Request Module (STORM) https: //storm-pps. gsfc. nasa. gov/storm/ Product Selection Temporal Selection
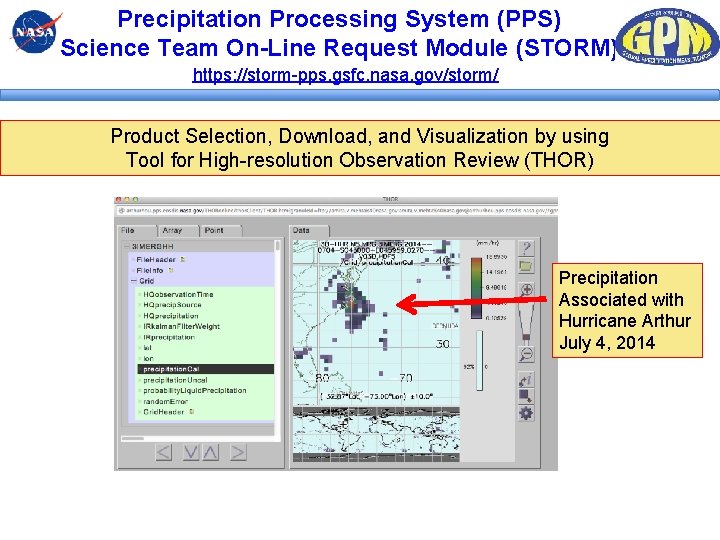
Precipitation Processing System (PPS) Science Team On-Line Request Module (STORM) https: //storm-pps. gsfc. nasa. gov/storm/ Product Selection, Download, and Visualization by using Tool for High-resolution Observation Review (THOR) Precipitation Associated with Hurricane Arthur July 4, 2014
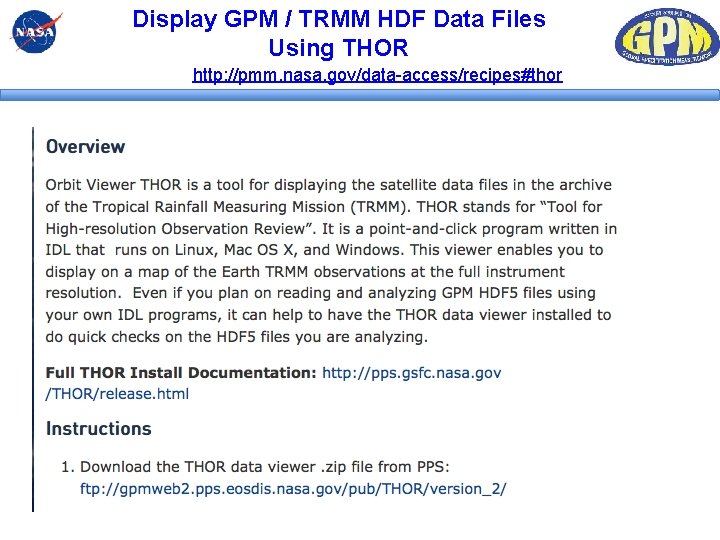
Display GPM / TRMM HDF Data Files Using THOR http: //pmm. nasa. gov/data-access/recipes#thor
STORM Live Demo!
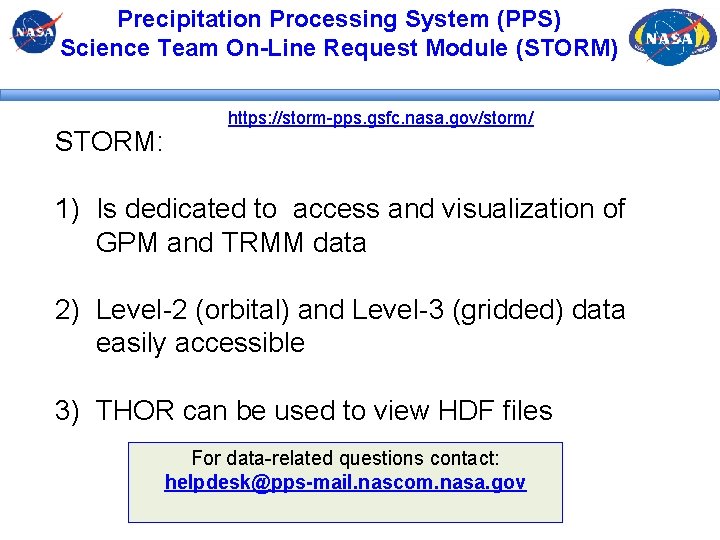
Precipitation Processing System (PPS) Science Team On-Line Request Module (STORM) STORM: https: //storm-pps. gsfc. nasa. gov/storm/ 1) Is dedicated to access and visualization of GPM and TRMM data 2) Level-2 (orbital) and Level-3 (gridded) data easily accessible 3) THOR can be used to view HDF files For data-related questions contact: helpdesk@pps-mail. nascom. nasa. gov
Import GPM Data into GIS – Arc. MAP § § For GPM L 3 (IMERG) Geo. TIFF Images are available from ftp: //jsimpson. pps. eosdis. nasa. gov/data/imerg/gis/ that can be imported into Arc. MAP* For L 2 and L 3 Data in general: § Use PPS, Mirador, or Giovanni to download data file as Net. CDF or HDF 5 § Procedures to import data into Arc. MAP are given on: http: //disc. sci. gsfc. nasa. gov/recipes/? q=recipes/How-to-Import-HDF 5 -formatted. IMERG-GPM-Precipitation-Data-into-Arc. GIS http: //disc. sci. gsfc. nasa. gov/recipes/? q=recipes/How-to-Import-Gridded-Data-in. Net. CDF-Format-into-Arc. GIS *ftp: //jsimpson. pps. eosdis. nasa. gov/NRTPUB/imerg/gis/README. GIS. pdf (for IMERG data) 50
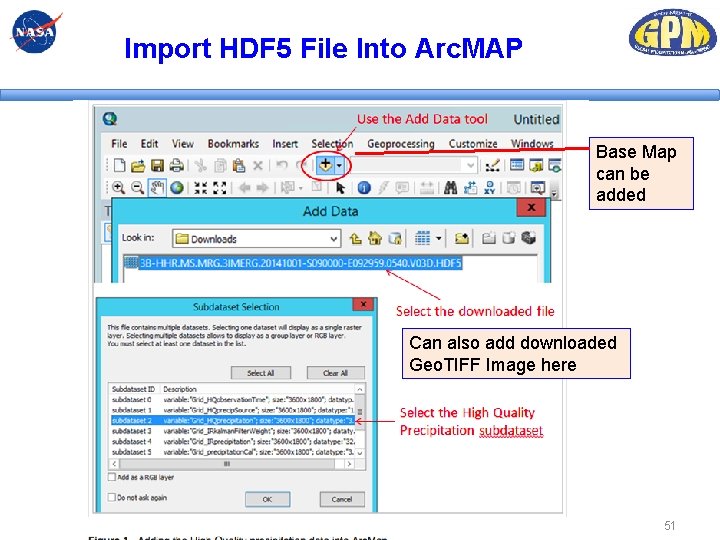
Import HDF 5 File Into Arc. MAP Base Map can be added Can also add downloaded Geo. TIFF Image here 51
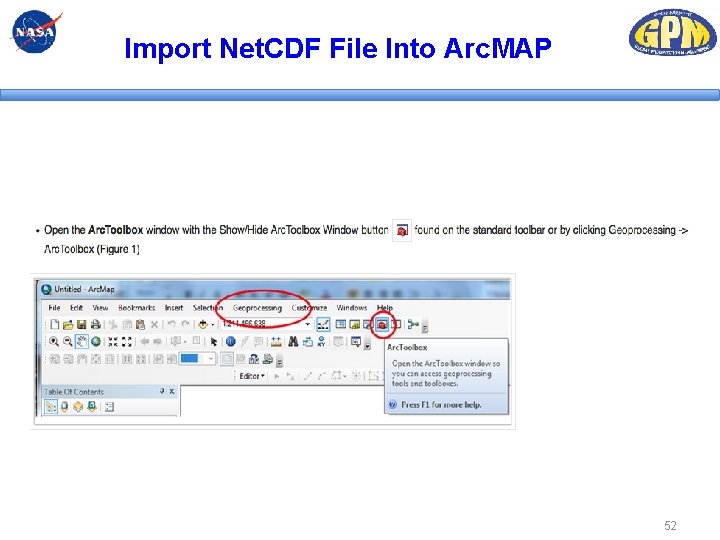
Import Net. CDF File Into Arc. MAP 52
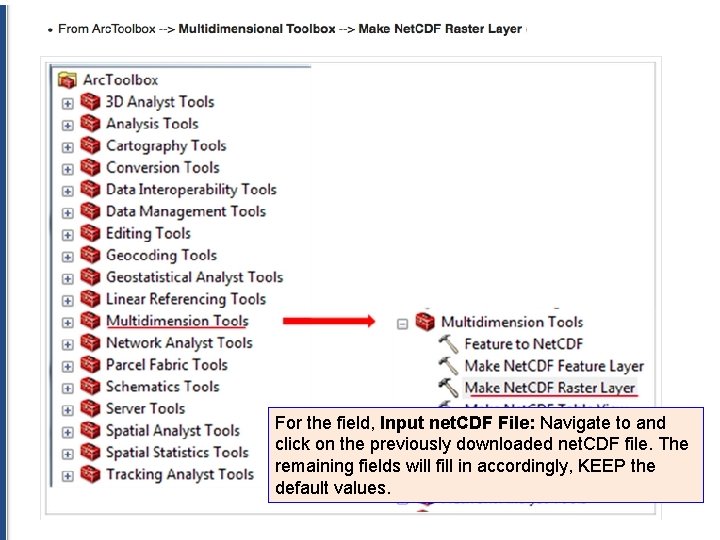
Import Net. CDF File Into Arc. MAP For the field, Input net. CDF File: Navigate to and click on the previously downloaded net. CDF file. The remaining fields will fill in accordingly, KEEP the default values. 53
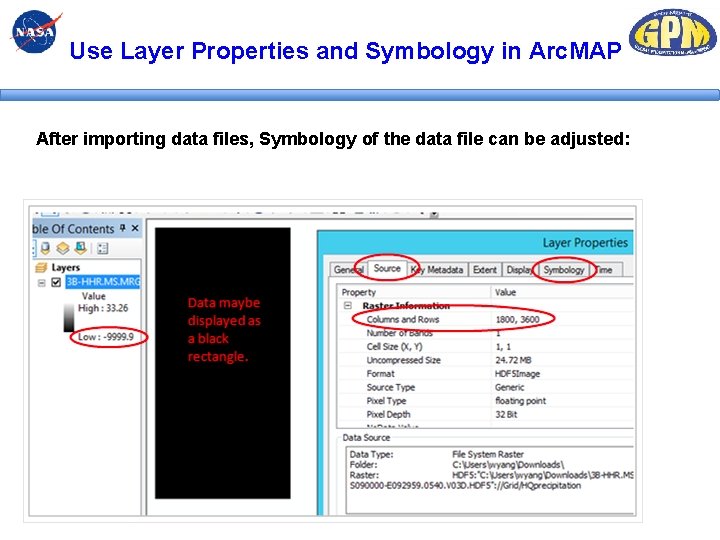
Use Layer Properties and Symbology in Arc. MAP After importing data files, Symbology of the data file can be adjusted: 54
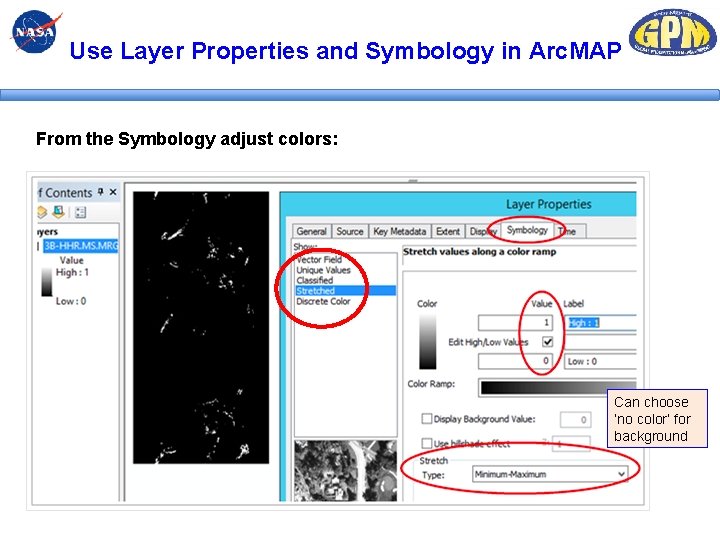
Use Layer Properties and Symbology in Arc. MAP From the Symbology adjust colors: Can choose ‘no color’ for background 55
Thank You! Amita Mehta ( email: amita. v. mehta@nasa. gov) 56
Extra Slides 57
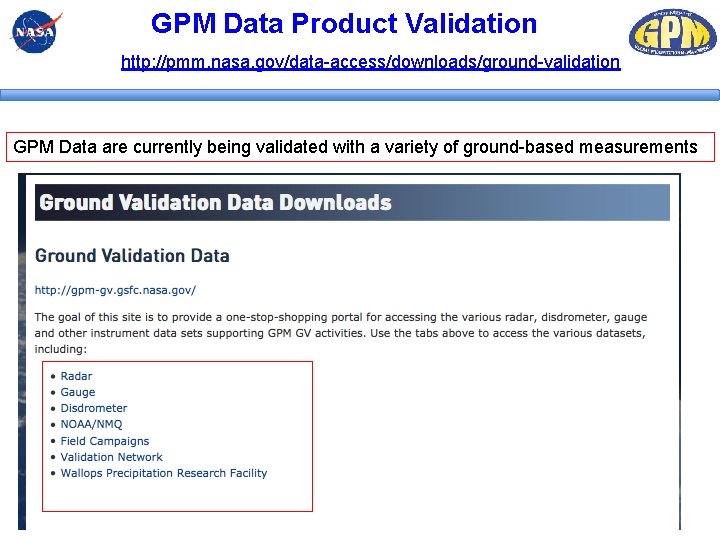
GPM Data Product Validation http: //pmm. nasa. gov/data-access/downloads/ground-validation GPM Data are currently being validated with a variety of ground-based measurements 58
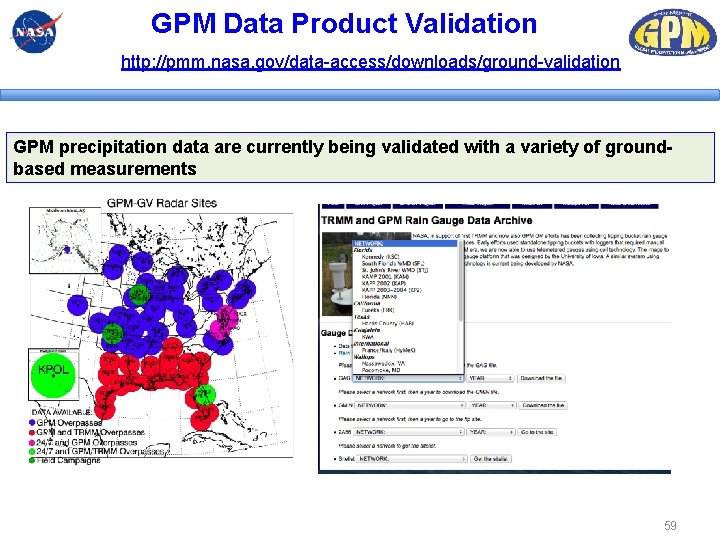
GPM Data Product Validation http: //pmm. nasa. gov/data-access/downloads/ground-validation GPM precipitation data are currently being validated with a variety of groundbased measurements 59
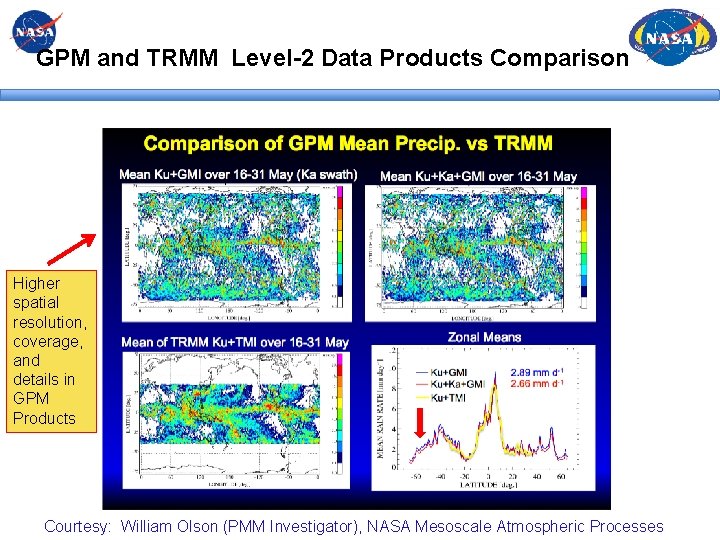
GPM and TRMM Level-2 Data Products Comparison Higher spatial resolution, coverage, and details in GPM Products Courtesy: William Olson (PMM Investigator), NASA Mesoscale Atmospheric Processes
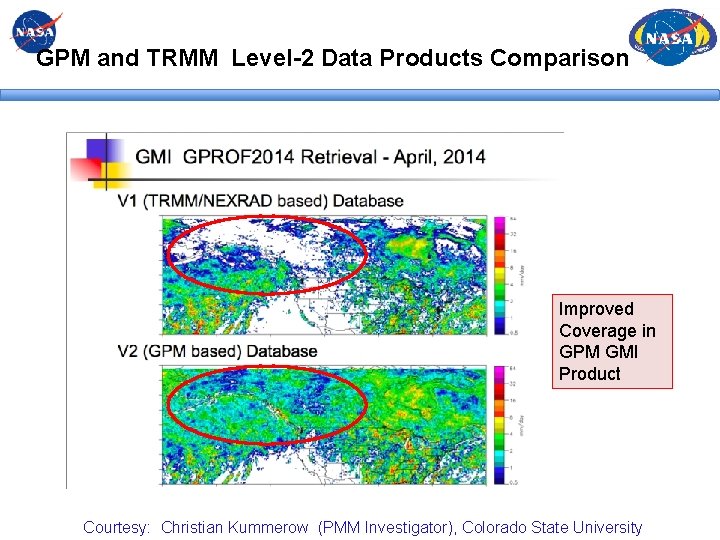
GPM and TRMM Level-2 Data Products Comparison Improved Coverage in GPM GMI Product Courtesy: Christian Kummerow (PMM Investigator), Colorado State University
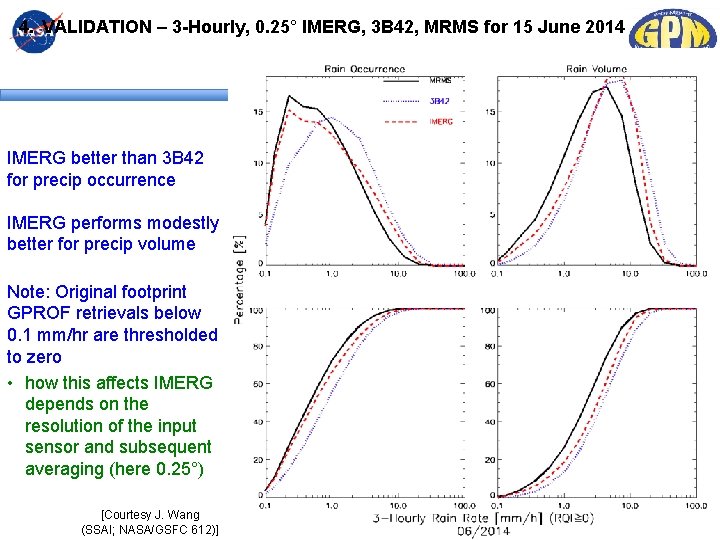
4. VALIDATION – 3 -Hourly, 0. 25° IMERG, 3 B 42, MRMS for 15 June 2014 IMERG better than 3 B 42 for precip occurrence IMERG performs modestly better for precip volume Note: Original footprint GPROF retrievals below 0. 1 mm/hr are thresholded to zero • how this affects IMERG depends on the resolution of the input sensor and subsequent averaging (here 0. 25°) [Courtesy J. Wang (SSAI; NASA/GSFC 612)]
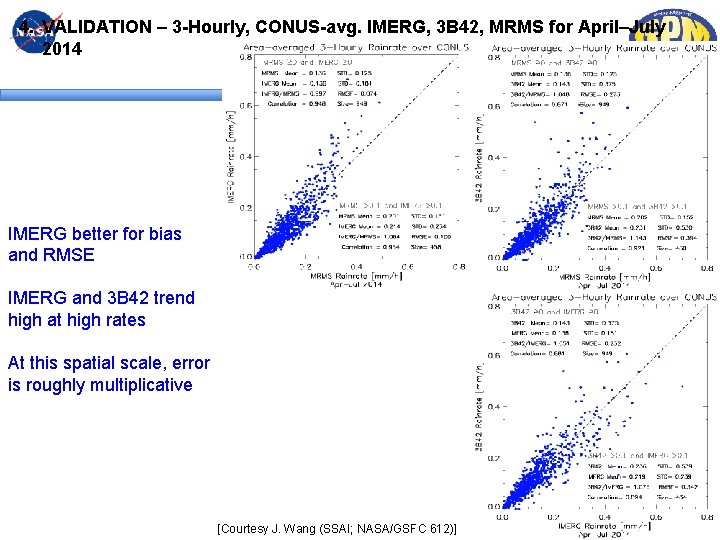
4. VALIDATION – 3 -Hourly, CONUS-avg. IMERG, 3 B 42, MRMS for April–July 2014 IMERG better for bias and RMSE IMERG and 3 B 42 trend high at high rates At this spatial scale, error is roughly multiplicative [Courtesy J. Wang (SSAI; NASA/GSFC 612)]
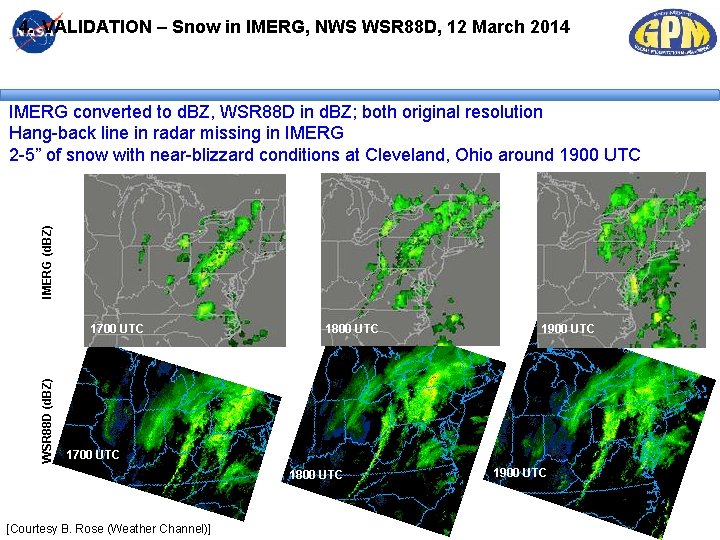
4. VALIDATION – Snow in IMERG, NWS WSR 88 D, 12 March 2014 IMERG (d. BZ) IMERG converted to d. BZ, WSR 88 D in d. BZ; both original resolution Hang-back line in radar missing in IMERG 2 -5” of snow with near-blizzard conditions at Cleveland, Ohio around 1900 UTC WSR 88 D (d. BZ) 1700 UTC 1800 UTC 1900 UTC 1700 UTC 1800 UTC [Courtesy B. Rose (Weather Channel)] 1900 UTC
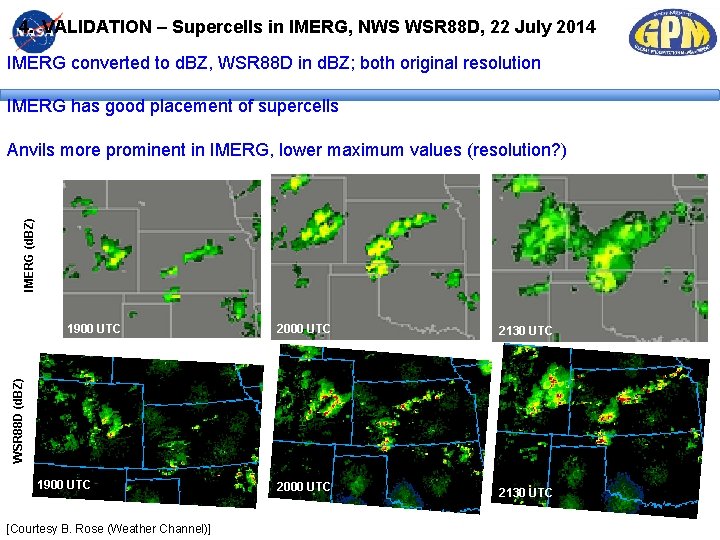
4. VALIDATION – Supercells in IMERG, NWS WSR 88 D, 22 July 2014 IMERG converted to d. BZ, WSR 88 D in d. BZ; both original resolution IMERG has good placement of supercells IMERG (d. BZ) Anvils more prominent in IMERG, lower maximum values (resolution? ) 2000 UTC 2130 UTC WSR 88 D (d. BZ) 1900 UTC [Courtesy B. Rose (Weather Channel)]
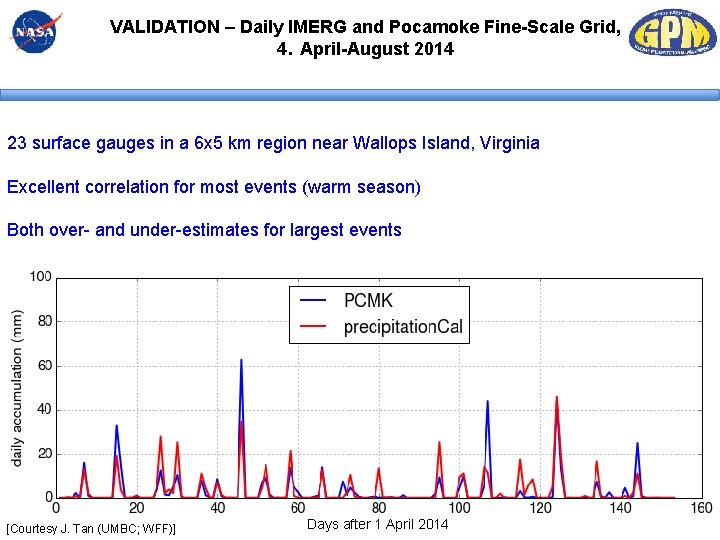
VALIDATION – Daily IMERG and Pocamoke Fine-Scale Grid, 4. April-August 2014 23 surface gauges in a 6 x 5 km region near Wallops Island, Virginia Excellent correlation for most events (warm season) Both over- and under-estimates for largest events [Courtesy J. Tan (UMBC; WFF)] Days after 1 April 2014