f PPARs Cloning and functional analysis of fish


 Sea bream (Sparus aurata) Atlantic salmon (Salmo salar) Sea bass")


 DNA-binding, Dimerisation, Co-activatorbinding A/B C 20%")


 Ligate constitutive gene promoter")


- Slides: 25
f. PPARs Cloning and functional analysis of fish Peroxisome Proliferator-Activated Receptors The transcriptional control of lipid metabolism in farmed fish species
f. PPAR group Grigorios Krey, Efthimia Antonopoulou, Evridiki Boukouvala National Agricultural Research Foundation, Fisheries Research Institute, Kavala, Greece Michael J. Leaver, Douglas R. Tocher, Tariq Ezaz Institute of Aquaculture, University of Stirling, UK Jose M. Bautista, Amalia Diez Martin Mol Biol and Biochem IV, Veterinary Faculty, Universidad Complutense de Madrid, Spain Alex Obach Nutreco Aquaculture Research Centre, Stavanger, Norway. Guillermo Bores Cripesa, Port Pesquer, Tarragona, Spain
FISH OIL USE Annual production stable at 1. 1 to 1. 4 million tons Actual Projected ? !
Fish Oil Replacement • Fat Deposition? • Nutritional Quality? • Disease Resistance? • Need a better understanding of underlying physiology
Peroxisome proliferator -activated receptors • PPARs – Transcription factors – Control genes involved in lipid homeostasis – Activated by PUFA and their eicosanoid derivatives
PPARs Coactivator proteins • PPARs are members of nuclear hormone receptor family • PPARs bind as heterodimer with RXR to PPRE • PPARs are activated by fatty acid (PUFA) ligands • Three forms in mammals, a, b/d and g
INNATE IMMUNE PPARg HEART ADIPOSE PPARa PPARg FA FA FA LDL OTHER TISSUES PPARb BLOOD PPARa FA HDL LIVER FA FXR FA GUT Bile acids
PPARs and Lipid Homeostasis • Transport – Apolipoprotien AI, AII, CIII, Liver fatty acid binding protein; Fatty acid transport protein; CD 36 • Biosynthesis – Acetyl-Co. A synthase; Malic enzyme; Stearoyl-Co. A desaturase I • Storage – Adipocyte lipid binding protein; Phosphoenolpyruvate carboxylase • Metabolism – Acyl-Co. A oxidase; Bifunctional enzyme; Carnitine palmitoyltransferase; CYP 4 A 1, 4 A 6; Lipoprotein lipase; Medium chain Acyl-Co. A dehydrogenase, 3 -hydroxy, 3 methylglutaryl-Co. A synthase; Uncoupling protein I
Strategy • Do fish have PPARs? – Construct and screen genomic libraries • What are their ligand activation profiles? – Express fish PPAR genes in cell culture • Diet formulation – Use results to produce a rational framework for fish oil replacement
Species Plaice (Pleuronectes platessa) Sea bream (Sparus aurata) Atlantic salmon (Salmo salar) Sea bass (Dicentrarchus labrax)
Stategies for PPAR Gene and c. DNA Isolation Partial digest Genomic DNA ligate + l bacteriophage arms PCR of conserved regions RT-PCR Isolate and sequence c. DNAs Package, plate on lawn of E. coli and screen with hybridisation probe Isolate and sequence gene Plaice and Salmon Sea bass and Sea bream
Plaice PPAR Gene Structures Human PPAR genes are >80 kb
Phylogenetic plot of PPAR sequences. xl. Xenopus laevis; hs, Homo sapiens; gg, Gallus gallus; ss, Salmo salar; pp, Pleuronectes platessa; dl, Dicentrarchus labrax; sa, Sparus aurata.
Southern Blot. Sst. I restricted plaice DNA was hybridised to the probes generated from the first coding exons of the three plaice PPAR genes, or the DNA-binding region. Sizes of fragments correspond to those predicted from the gene sequences.
PPAR structure and function Ligand-independent transactivation (phosphorylation? ) DNA-binding, Dimerisation, Co-activatorbinding A/B C 20% 90% Ligand-binding, Co-activator-binding D E/F 70% PPAR RXR E/F A/B C C A/B DNA PROMOTER
EMSA Species PPAR PP C SA SS DL a b g b g g PP C SA SS DL a b g DNA-binding domains PPAR RXR PPRE Probe ACO-A GSTA. 2
CARLA: Sea Bream PPARa LBD A 0 1 2 3 4 5 6 7 8 9 10 11 12 13 Association values (no ligand=1) PAGE Autorad 35 S SRC 1 Complex Formation Ligand 1 2 3 4 5 6 7 8 9 10 11 12 13 35 S Ligands SRC 1 PPAR-LBD 1. No ligand, 2. Phytanic acid, 3. DHA, 4. Arachidonic acid, 5. EPA 6. ETYA, 7. Linolenic acid, 8. Linoleic acid, 9. CLA (10 E, 12 Z), 10. CLA (9 Z, 11 E), 11. CLA (9 E, 11 E), 12. CLA mix, 13. 8(S)-HETE, A. SRC 1, 0. GST-CLA mix Co-activator protein
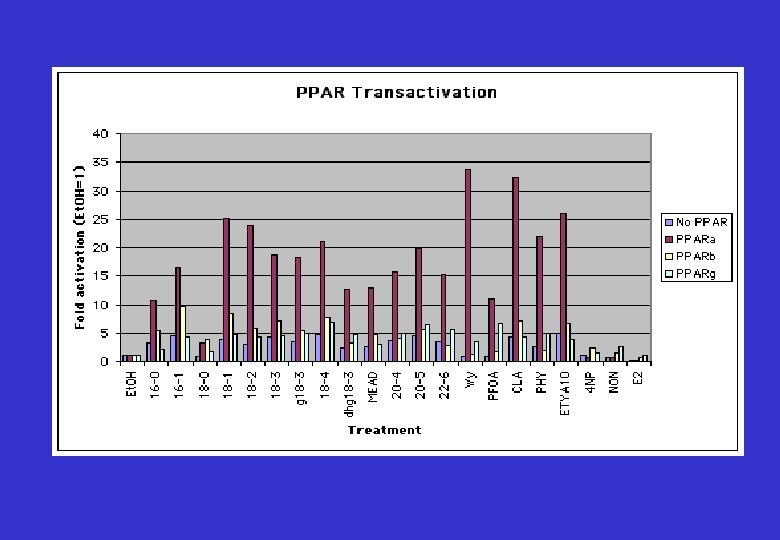
PPAR Transactivation Assays Co-transfect to cells in culture (Multiwell plates) Ligate constitutive gene promoter to PPARgene CMV PPRE PPAR c. DNA CMV CAT gene PPAR Ligate a PPAR response element (PPRE) to CAT reporter gene PPAR c. DNA PPRE RXR CAT gene PPRE CAT Measure CAT (Muliwell ELISA) CAT gene Treat cells with potential PPAR activators
Plaice PPAR Tissue Expression Profile Lane 1, liver; 2, kidney; 3, small intestine; 4, gill; 5, heart; 6, spleen; 7, white muscle; 8, red muscle; 9, brain; 10, visceral adipose
Sea Bream PPAR Tissue Expression Profile RNase protection 1 2 3 4 5 6 7 8 9 10 PPARg PPARb PPARa 1. Liver, 2. Kidney, 3. Intestine, 4. Gill, 5. Heart, 6. Spleen, 7. White muscle, 8. Red muscle, 9. Brain, 10. Adipose
Tissue expression profile of PPARs in sea bream Immunochemical analysis Anti PPAR a Anti PPAR g
Next Steps • PPAR activators in primary hepatocytes and adipocytes – Determine fatty acid profiles and metabolic indices – Gene expression profiling • Dietary trial with salmon and sea bream – Measure growth, gene expression, fatty acid profiles
Dietary Trial • PPARa - Liver and Heart- Fatty acid oxidation– Conjugated linolenic acid (CLA), 16: 1, 18: 1 ? ? ? • PPARb - All tissues- Function? – 16: 1 • PPARg - Adipose - Fat Sorage – ? ? ? • Diet- 16: 1 (+ 18: 3+18 -2) + CLA