EOS Aura Results Jim Gleason for Ernest Hilsenrath
- Slides: 21
EOS Aura Results Jim Gleason for Ernest Hilsenrath NASA/Univ. of Maryland M. Schoeberl, A. Douglass, R. Beer, J. Gille P. Levelt, J. Waters Atmospheric Science Conference ESRIN/Frascati May 2006
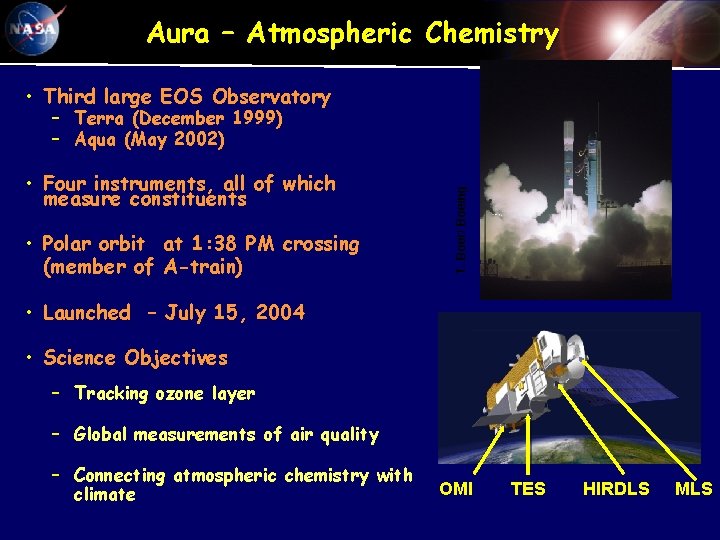
Aura – Atmospheric Chemistry • Third large EOS Observatory • Four instruments, all of which measure constituents • Polar orbit at 1: 38 PM crossing (member of A-train) T. Boer/ Boeing – Terra (December 1999) – Aqua (May 2002) • Launched – July 15, 2004 • Science Objectives – Tracking ozone layer – Global measurements of air quality – Connecting atmospheric chemistry with climate OMI TES HIRDLS MLS
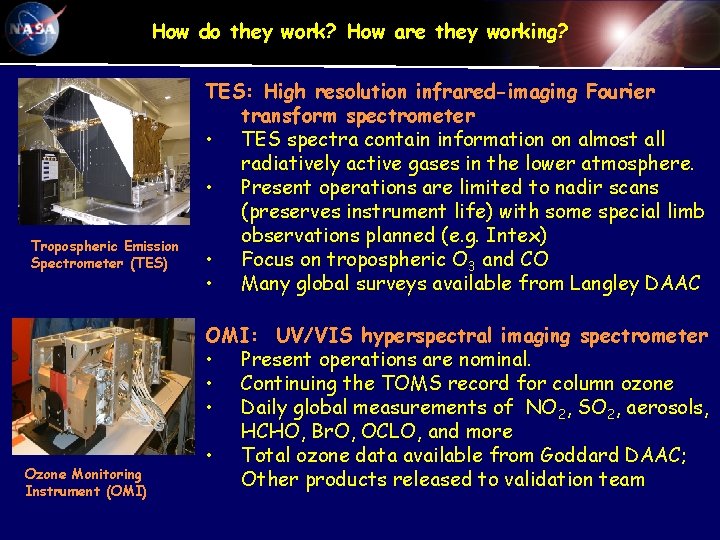
How do they work? How are they working? Tropospheric Emission Spectrometer (TES) Ozone Monitoring Instrument (OMI) TES: High resolution infrared-imaging Fourier transform spectrometer • TES spectra contain information on almost all radiatively active gases in the lower atmosphere. • Present operations are limited to nadir scans (preserves instrument life) with some special limb observations planned (e. g. Intex) • Focus on tropospheric O 3 and CO • Many global surveys available from Langley DAAC OMI: UV/VIS hyperspectral imaging spectrometer • Present operations are nominal. • Continuing the TOMS record for column ozone • Daily global measurements of NO 2, SO 2, aerosols, HCHO, Br. O, OCLO, and more • Total ozone data available from Goddard DAAC; Other products released to validation team
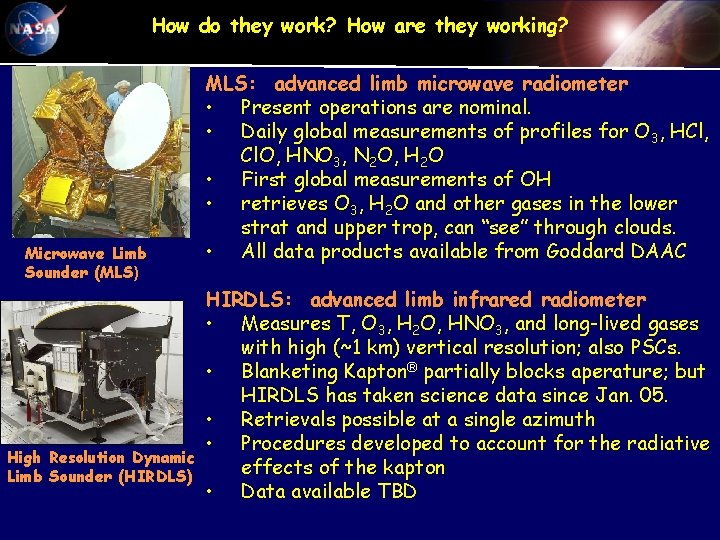
How do they work? How are they working? Microwave Limb Sounder (MLS) High Resolution Dynamic Limb Sounder (HIRDLS) MLS: advanced limb microwave radiometer • Present operations are nominal. • Daily global measurements of profiles for O 3, HCl, Cl. O, HNO 3, N 2 O, H 2 O • First global measurements of OH • retrieves O 3, H 2 O and other gases in the lower strat and upper trop, can “see” through clouds. • All data products available from Goddard DAAC HIRDLS: advanced limb infrared radiometer • Measures T, O 3, H 2 O, HNO 3, and long-lived gases with high (~1 km) vertical resolution; also PSCs. • Blanketing Kapton® partially blocks aperature; but HIRDLS has taken science data since Jan. 05. • Retrievals possible at a single azimuth • Procedures developed to account for the radiative effects of the kapton • Data available TBD
Aura Top 10 Discoveries
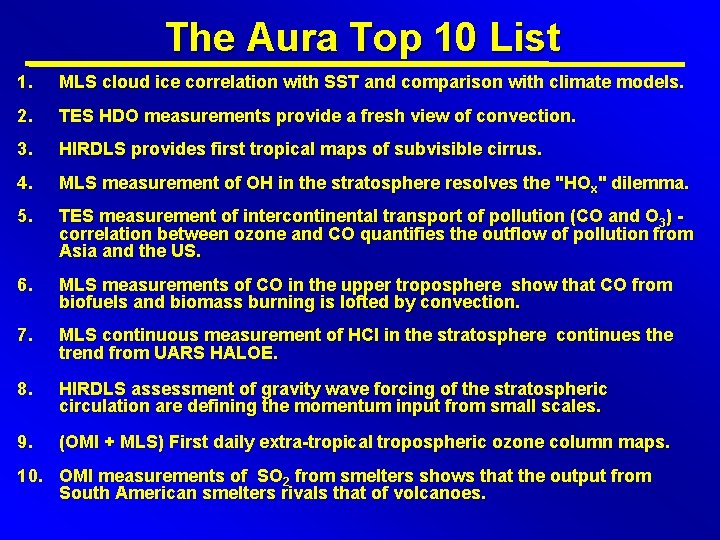
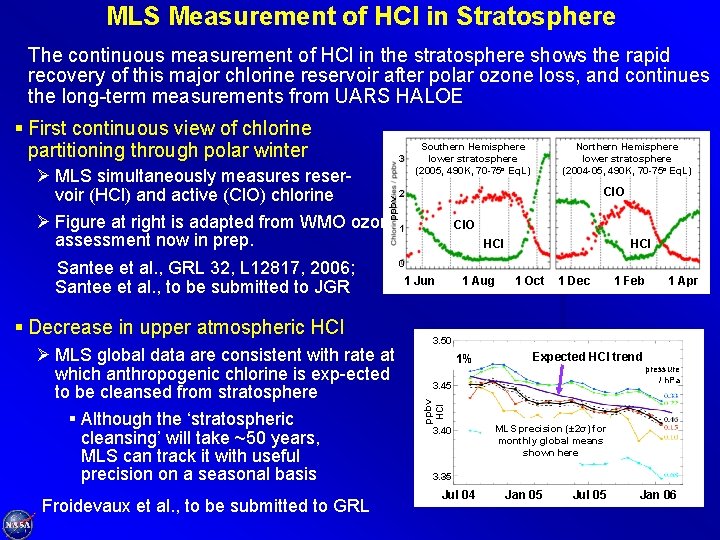
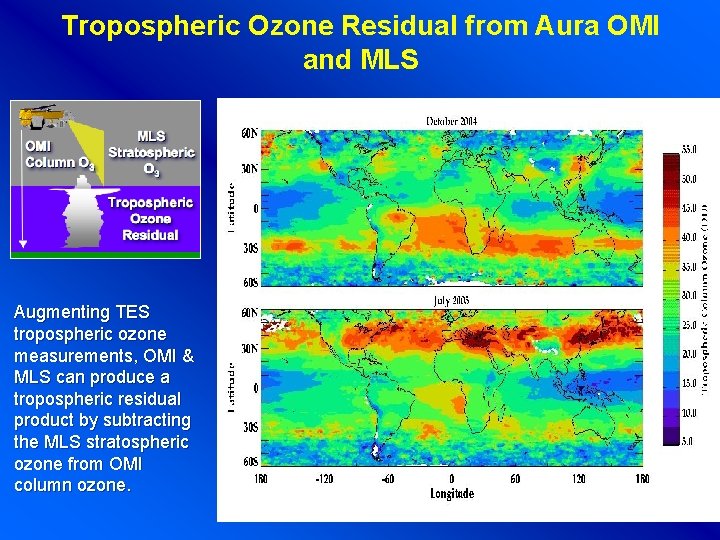
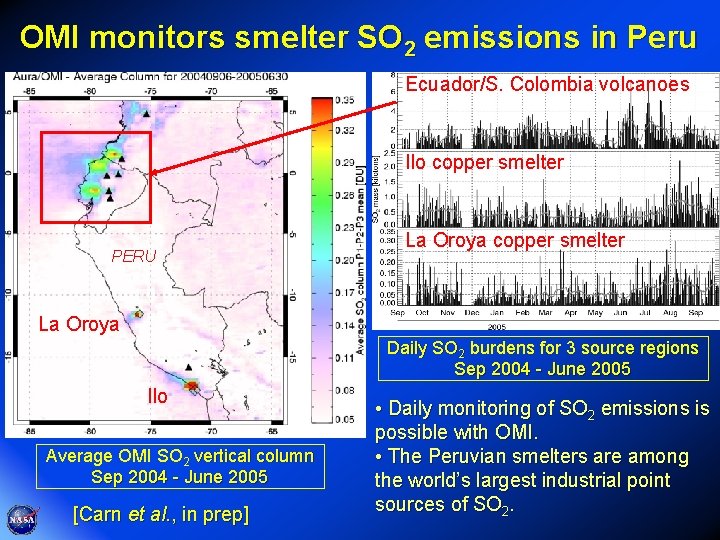
The Aura Top 10 List 1. MLS cloud ice correlation with SST and comparison with climate models. 2. TES HDO measurements provide a fresh view of convection. 3. HIRDLS provides first tropical maps of subvisible cirrus. 4. MLS measurement of OH in the stratosphere resolves the "HOx" dilemma. 5. TES measurement of intercontinental transport of pollution (CO and O 3) correlation between ozone and CO quantifies the outflow of pollution from Asia and the US. 6. MLS measurements of CO in the upper troposphere show that CO from biofuels and biomass burning is lofted by convection. 7. MLS continuous measurement of HCl in the stratosphere continues the trend from UARS HALOE. 8. HIRDLS assessment of gravity wave forcing of the stratospheric circulation are defining the momentum input from small scales. 9. (OMI + MLS) First daily extra-tropical tropospheric ozone column maps. 10. OMI measurements of SO 2 from smelters shows that the output from South American smelters rivals that of volcanoes.
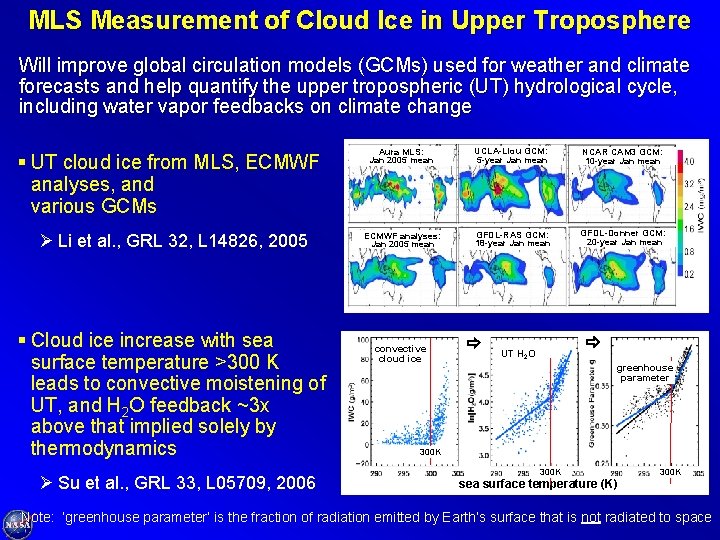
MLS Measurement of Cloud Ice in Upper Troposphere Will improve global circulation models (GCMs) used for weather and climate forecasts and help quantify the upper tropospheric (UT) hydrological cycle, including water vapor feedbacks on climate change § UT cloud ice from MLS, ECMWF analyses, and various GCMs Ø Li et al. , GRL 32, L 14826, 2005 § Cloud ice increase with sea surface temperature >300 K leads to convective moistening of UT, and H 2 O feedback ~3 x above that implied solely by thermodynamics Ø Su et al. , GRL 33, L 05709, 2006 Aura MLS: Jan 2005 mean UCLA-Liou GCM: 5 -year Jan mean NCAR CAM 3 GCM: 10 -year Jan mean ECMWF analyses: Jan 2005 mean GFDL-RAS GCM: 18 -year Jan mean GFDL-Donner GCM: 20 -year Jan mean convective cloud ice UT H 2 O greenhouse parameter 300 K sea surface temperature (K) Note: ‘greenhouse parameter’ is the fraction of radiation emitted by Earth’s surface that is not radiated to space
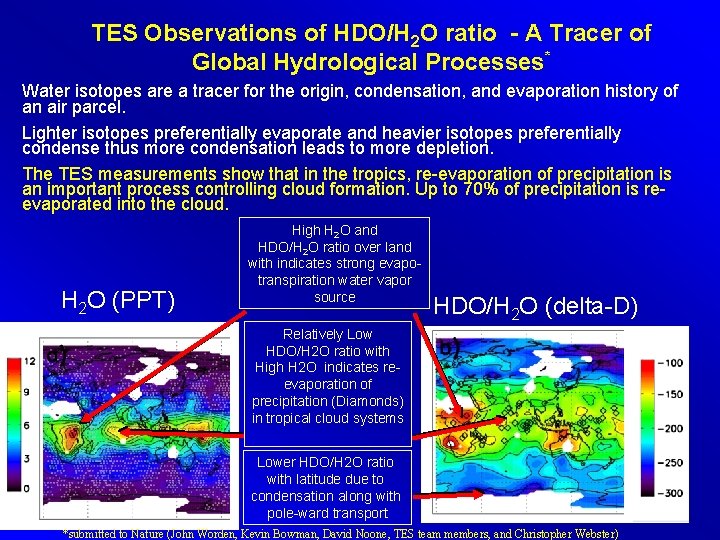
TES Observations of HDO/H 2 O ratio - A Tracer of Global Hydrological Processes* Water isotopes are a tracer for the origin, condensation, and evaporation history of an air parcel. Lighter isotopes preferentially evaporate and heavier isotopes preferentially condense thus more condensation leads to more depletion. The TES measurements show that in the tropics, re-evaporation of precipitation is an important process controlling cloud formation. Up to 70% of precipitation is reevaporated into the cloud. H 2 O (PPT) High H 2 O and HDO/H 2 O ratio over land with indicates strong evapotranspiration water vapor source HDO/H 2 O (delta-D) Relatively Low HDO/H 2 O ratio with High H 2 O indicates reevaporation of precipitation (Diamonds) in tropical cloud systems Lower HDO/H 2 O ratio with latitude due to condensation along with pole-ward transport *submitted to Nature (John Worden, Kevin Bowman, David Noone, TES team members, and Christopher Webster)
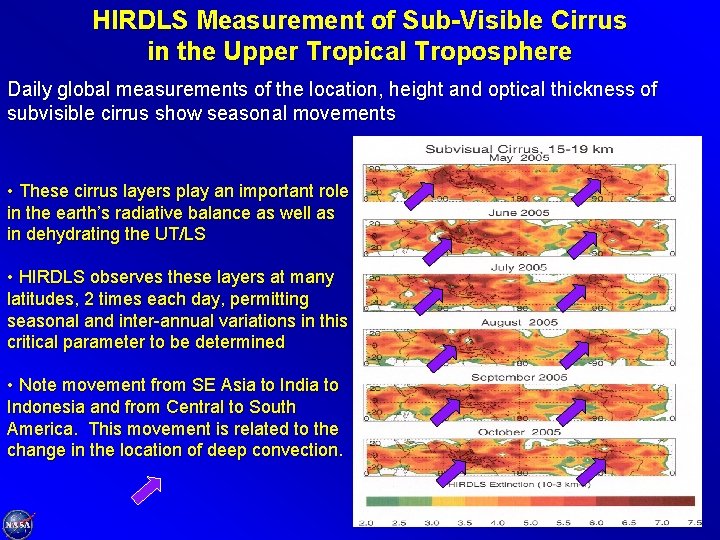
HIRDLS Measurement of Sub-Visible Cirrus in the Upper Tropical Troposphere Daily global measurements of the location, height and optical thickness of subvisible cirrus show seasonal movements • These cirrus layers play an important role in the earth’s radiative balance as well as in dehydrating the UT/LS • HIRDLS observes these layers at many latitudes, 2 times each day, permitting seasonal and inter-annual variations in this critical parameter to be determined • Note movement from SE Asia to Indonesia and from Central to South America. This movement is related to the change in the location of deep convection.
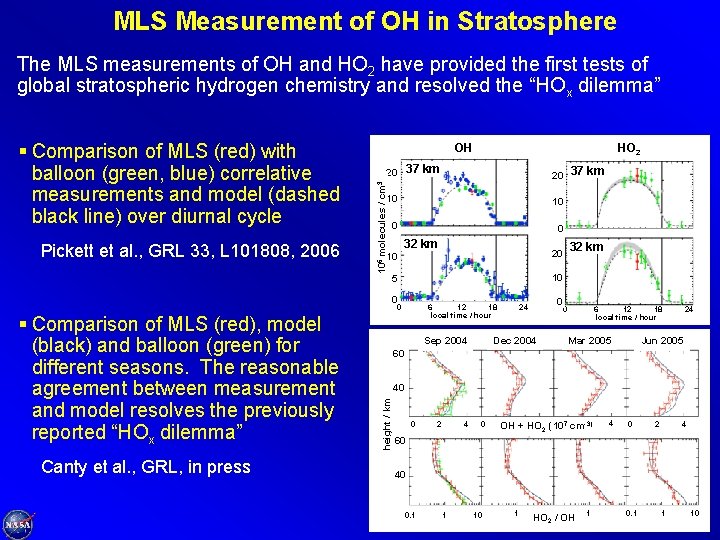
MLS Measurement of OH in Stratosphere The MLS measurements of OH and HO 2 have provided the first tests of global stratospheric hydrogen chemistry and resolved the “HOx dilemma” Pickett et al. , GRL 33, L 101808, 2006 OH Canty et al. , GRL, in press 20 10 10 0 0 32 km 10 20 5 10 0 0 6 12 18 local time / hour 0 24 Dec 2004 Sep 2004 37 km 32 km 0 6 12 18 local time / hour Mar 2005 24 Jun 2005 60 40 height / km § Comparison of MLS (red), model (black) and balloon (green) for different seasons. The reasonable agreement between measurement and model resolves the previously reported “HOx dilemma” HO 2 37 km 20 106 molecules / cm 3 § Comparison of MLS (red) with balloon (green, blue) correlative measurements and model (dashed black line) over diurnal cycle 0 2 4 0 2 + HO (107 cm 2 -3) OH 2 4 0 2 4 60 40 0. 1 1 10 1 HO 2 / OH 1 0. 1 1 10
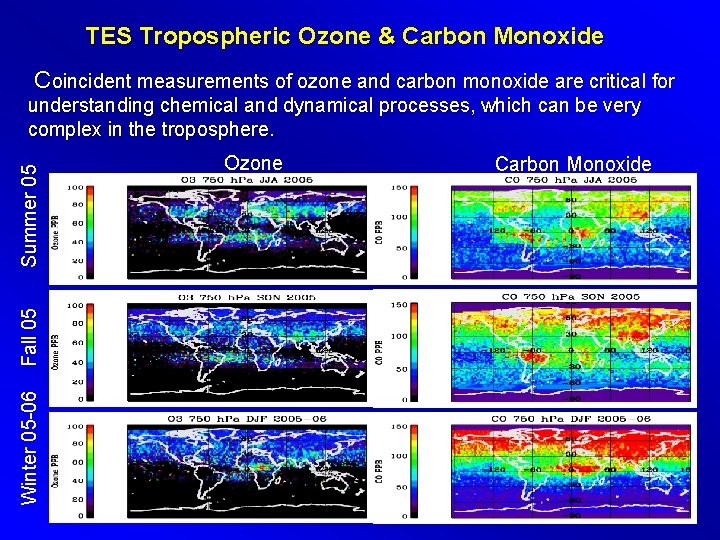
TES Tropospheric Ozone & Carbon Monoxide Coincident measurements of ozone and carbon monoxide are critical for Winter 05 -06 Fall 05 Summer 05 understanding chemical and dynamical processes, which can be very complex in the troposphere. Ozone Carbon Monoxide
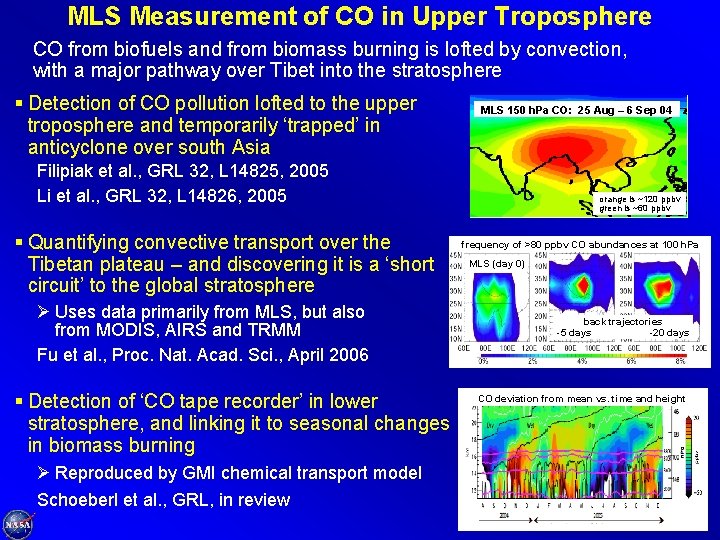
MLS Measurement of CO in Upper Troposphere CO from biofuels and from biomass burning is lofted by convection, with a major pathway over Tibet into the stratosphere § Detection of CO pollution lofted to the upper troposphere and temporarily ‘trapped’ in anticyclone over south Asia MLS 150 h. Pa CO: 25 Aug – 6 Sep 04 Filipiak et al. , GRL 32, L 14825, 2005 Li et al. , GRL 32, L 14826, 2005 § Quantifying convective transport over the Tibetan plateau – and discovering it is a ‘short circuit’ to the global stratosphere Ø Uses data primarily from MLS, but also from MODIS, AIRS and TRMM Fu et al. , Proc. Nat. Acad. Sci. , April 2006 § Detection of ‘CO tape recorder’ in lower stratosphere, and linking it to seasonal changes in biomass burning Ø Reproduced by GMI chemical transport model Schoeberl et al. , GRL, in review orange is ~120 ppbv green is ~60 ppbv frequency of >80 ppbv CO abundances at 100 h. Pa MLS (day 0) back trajectories -5 days -20 days CO deviation from mean vs. time and height
MLS Measurement of HCl in Stratosphere The continuous measurement of HCl in the stratosphere shows the rapid recovery of this major chlorine reservoir after polar ozone loss, and continues the long-term measurements from UARS HALOE § First continuous view of chlorine partitioning through polar winter 3 Cl. O ppbv Ø MLS simultaneously measures reser 2 voir (HCl) and active (Cl. O) chlorine Ø Figure at right is adapted from WMO ozone 1 assessment now in prep. § Decrease in upper atmospheric HCl Ø MLS global data are consistent with rate at which anthropogenic chlorine is exp-ected to be cleansed from stratosphere § Although the ‘stratospheric cleansing’ will take ~50 years, MLS can track it with useful precision on a seasonal basis Froidevaux et al. , to be submitted to GRL Cl. O HCl 0 1 Jun 1 Aug 1 Oct 1 Dec 1 Feb 1 Apr 3. 50 1% Expected HCl trend pressure / h. Pa 3. 45 ppbv HCl Santee et al. , GRL 32, L 12817, 2006; Santee et al. , to be submitted to JGR Northern Hemisphere lower stratosphere (2004 -05, 490 K, 70 -75 o Eq. L) Southern Hemisphere lower stratosphere (2005, 490 K, 70 -75 o Eq. L) 3. 40 MLS precision (± 2σ) for monthly global means shown here 3. 35 Jul 04 Jan 05 Jul 05 Jan 06
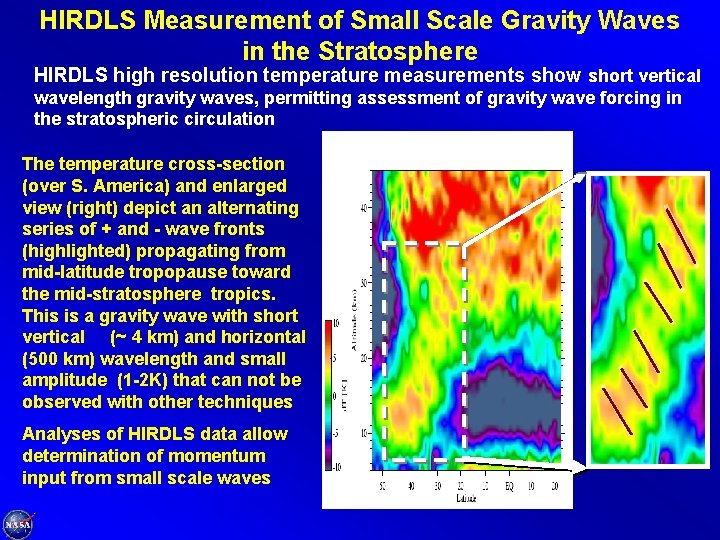
HIRDLS Measurement of Small Scale Gravity Waves in the Stratosphere HIRDLS high resolution temperature measurements show short vertical wavelength gravity waves, permitting assessment of gravity wave forcing in the stratospheric circulation The temperature cross-section (over S. America) and enlarged view (right) depict an alternating series of + and - wave fronts (highlighted) propagating from mid-latitude tropopause toward the mid-stratosphere tropics. This is a gravity wave with short vertical (~ 4 km) and horizontal (500 km) wavelength and small amplitude (1 -2 K) that can not be observed with other techniques Analyses of HIRDLS data allow determination of momentum input from small scale waves
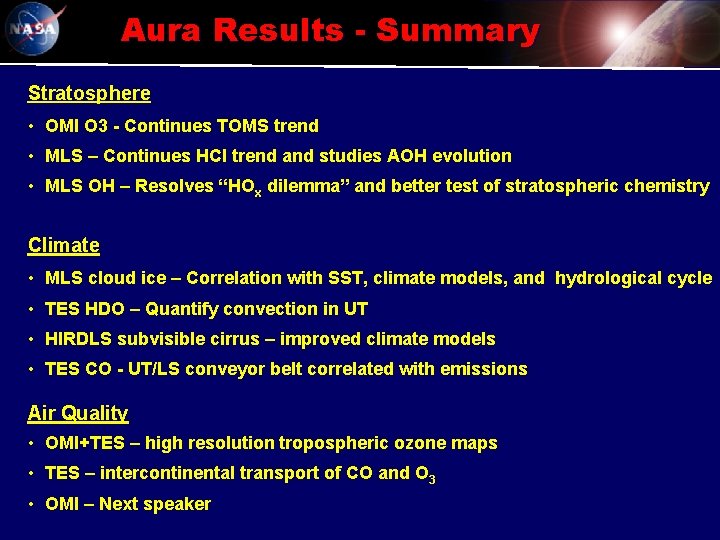
Aura Results - Summary Stratosphere • OMI O 3 - Continues TOMS trend • MLS – Continues HCl trend and studies AOH evolution • MLS OH – Resolves “HOx dilemma” and better test of stratospheric chemistry Climate • MLS cloud ice – Correlation with SST, climate models, and hydrological cycle • TES HDO – Quantify convection in UT • HIRDLS subvisible cirrus – improved climate models • TES CO - UT/LS conveyor belt correlated with emissions Air Quality • OMI+TES – high resolution tropospheric ozone maps • TES – intercontinental transport of CO and O 3 • OMI – Next speaker
Aura Results Backup
Tropospheric Ozone Residual from Aura OMI and MLS Augmenting TES tropospheric ozone measurements, OMI & MLS can produce a tropospheric residual product by subtracting the MLS stratospheric ozone from OMI column ozone.
OMI monitors smelter SO 2 emissions in Peru Ecuador/S. Colombia volcanoes Ilo copper smelter PERU La Oroya copper smelter La Oroya Daily SO 2 burdens for 3 source regions Sep 2004 - June 2005 Ilo Average OMI SO 2 vertical column Sep 2004 - June 2005 [Carn et al. , in prep] • Daily monitoring of SO 2 emissions is possible with OMI. • The Peruvian smelters are among the world’s largest industrial point sources of SO 2.
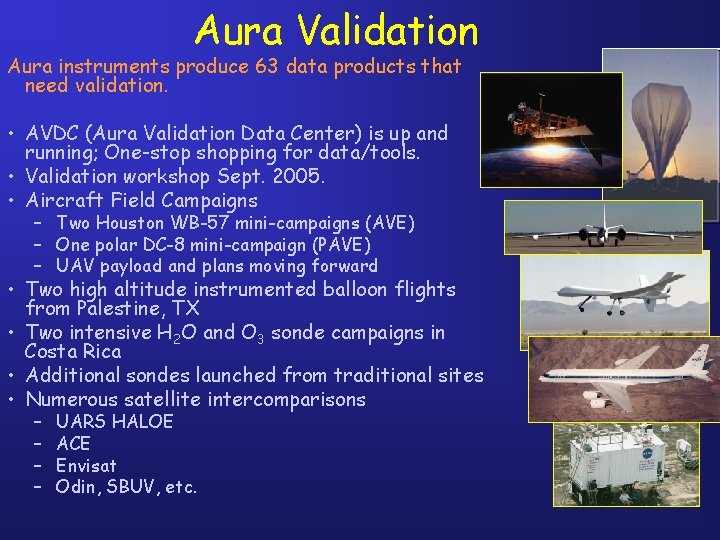
Aura Validation Aura instruments produce 63 data products that need validation. • AVDC (Aura Validation Data Center) is up and running; One-stop shopping for data/tools. • Validation workshop Sept. 2005. • Aircraft Field Campaigns – Two Houston WB-57 mini-campaigns (AVE) – One polar DC-8 mini-campaign (PAVE) – UAV payload and plans moving forward • Two high altitude instrumented balloon flights from Palestine, TX • Two intensive H 2 O and O 3 sonde campaigns in Costa Rica • Additional sondes launched from traditional sites • Numerous satellite intercomparisons – – UARS HALOE ACE Envisat Odin, SBUV, etc.
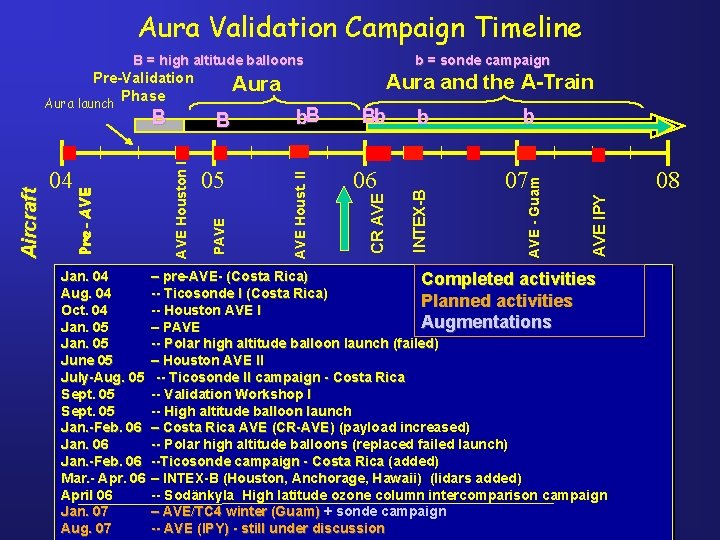
Aura Validation Campaign Timeline B = high altitude balloons Jan. 04 Aug. 04 Oct. 04 Jan. 05 June 05 July-Aug. 05 Sept. 05 Jan. -Feb. 06 Mar. - Apr. 06 April 06 Jan. 07 Aug. 07 b 07 08 AVE IPY 06 b AVE - Guam Bb INTEX-B 05 b. B CR AVE B AVE Houst. II AVE Houston I 04 Pre-AVE Aircraft B Aura and the A-Train Aura PAVE Pre-Validation Phase Aura launch b = sonde campaign – pre-AVE- (Costa Rica) Completed activities -- Ticosonde I (Costa Rica) Planned activities -- Houston AVE I Augmentations – PAVE -- Polar high altitude balloon launch (failed) – Houston AVE II -- Ticosonde II campaign - Costa Rica -- Validation Workshop I -- High altitude balloon launch – Costa Rica AVE (CR-AVE) (payload increased) -- Polar high altitude balloons (replaced failed launch) --Ticosonde campaign - Costa Rica (added) – INTEX-B (Houston, Anchorage, Hawaii) (lidars added) -- Sodänkyla High latitude ozone column intercomparison campaign – AVE/TC 4 winter (Guam) + sonde campaign -- AVE (IPY) - still under discussion
The Aura Top 10 List 1. 2. 3. 4. 5. 6. 7. 8. 9. 10. MLS cloud ice correlation with SST and comparison with climate models provides a powerful new constraint on model systems. TES HDO measurements provide a fresh view of convection. HIRDLS maps of subvisible cirrus are the first tropical maps that show the wide extent and altitude of these not-well-understood clouds. MLS measurement of OH in the stratosphere resolves the "HOx" dilemma and provides a new test of stratospheric chemistry. TES measurement of intercontinental transport of pollution (CO and O 3) -correlation between ozone and CO quantifies the outflow of pollution from Asia and the US. (OMI + MLS) First daily extra-tropical tropospheric ozone column maps using the residual technique OMI measurements of SO 2 from smelters shows that the output from South American smelters rivals that of volcanoes. MLS measurements of CO in the upper troposphere show that CO from biofuels and biomass burning is lofted by convection and can periodically penetrate the stratosphere MLS continuous measurement of HCl in the stratosphere shows the rapid recovery of this chlorine reservoir after polar ozone loss, and MLS HCl continues the trend from UARS HALOE. HIRDLS assessment of gravity wave forcing of the stratospheric circulation are defining the momentum input from small scale waves.