Kate Gleason College of Engineering Multidisciplinary Senior Design


- Slides: 50

Kate Gleason College of Engineering Multidisciplinary Senior Design Detailed Design Review P 12408 1

DDR Agenda 2

Meeting Timeline 3

Project Summary 4

Customer Needs 5

Engineering Specifications 6

System Block Diagram 7

Solar Panel MPPT and Battery Charger Load Battery

Specifications Solar Panel MPPT and Battery Charger Battery Pmax (W) Vmp (V) 24 Rated Panel Power (W) 16. 7 Float Voltage (V) 65 12. 5 Peak Voltage (V) Imp (A) Voc (V) 1. 45 Rated Output Current (A) 24. 6 Rated Panel Voc(V) 5 Charging Current (A) 0 - 27 Isc (A) 1. 68 Disconnect Load Voltage (V) Reconnect Load Voltage (V) Solar Panel 9. 3 Max Discharge Current (A) 10. 5 Capacity (Ah) Nominal Voltage (V) MPPT and Battery Charger Part Number WSLE-0240 -024 GV-5 -Li-12. 5 V 12. 6 2 10. 4 11. 1 Battery AT: Tenergy Li-Ion 18650 11. 1 V 10400 m. Ah Rechargeable Battery Pack w/ PCB Protection (DGR-A)

Units Used watt (W) is a unit of power in the International System of Units. Joule (J) is a unit of energy or work in the International System of Units. watt hour () represents energy scaled to one hour. Providing a convenient way to quantify energy supply and demand throughout a 24 hour day. Ampere (A) is the SI unit of electric current. Coulomb (C) is the SI unit of electric charge. electrons Ampere hour (A*hr) represents charge scaled to one hour.

Power Requirements LOAD POWER REQUIREMENTS (EXTERNAL) Required Power(W) 2 5 Voltage Supplied (V) 12 12 Current Supplied (A) 0. 167 0. 417 External Power Needs (W) Light hours Dark Hours Total Hours W-hr A-hr 10 14 24 47. 8 3. 98 10 14 24 0. 5 0. 0417 Light Dark Minutes Total W-hr. Total A-hr 600 840 1440 48. 3 4. 025 Total W Total m. A-hr 2. 0125 4025 Total Power Needs Internal Power Needs (W) without Efficiencies (W) with Efficiencies (W) 2. 0125 Requirements 0. 564 Power (W) Energy (W-hr) 2. 58 Charge (A-hrs) 3. 391 Avg Current (A) Battery 3. 39 81. 38 6. 78 0. 28 Solar panels 8. 66 86. 57 N/A 0. 72

Power Capture Equation Label Solar Constant (w/ ) Panel Area ( ) Value 1, 360 0. 32835 Description Solar Constant at top of atmosphere at perpendicular incidence Area of WSLE-0240 -024 Summer 0. 9 90% compared to perpendicular (Earth tilt of 23 degree towards sun) Equinox 0. 7 70% compared to perpendicular. Rochester Latitude: 43°N Winter 0. 4 40% compared to perpendicular (Earth tilt of 23 degree away from sun) Amorphous Silicon (a-si) 0. 06 6% efficient Power Captured = Solar Constant x Panel Area x (% from perpendicular solar incidence) x Solar Panel Efficiency Incidence at Solar Noon (12: 00) Summer Power (W) Equinox Power (W) Winter Power (W) 90 ° 24. 11 18. 76 10. 72

Hourly Power and Daily Energy Capture Solar Time Degree Radian Sin(Radian) Summer (W) Equinox (W) Winter (W) 6: 00 0 0. 00 7: 00 15 0. 261799388 0. 258819045 6. 24 4. 86 2. 77 8: 00 30 0. 523598775 0. 49999 12. 05 9. 38 5. 36 9: 00 45 0. 785398163 0. 707106781 17. 05 13. 27 7. 58 10: 00 60 1. 04719755 0. 866025403 20. 88 16. 25 9. 28 11: 00 75 1. 308996938 0. 965925826 23. 29 18. 12 10. 35 12: 00 90 1. 570796325 1 24. 11 18. 76 10. 72 13: 00 75 1. 308996938 0. 965925826 23. 29 18. 12 10. 35 14: 00 60 1. 04719755 0. 866025403 20. 88 16. 25 9. 28 15: 00 45 0. 785398163 0. 707106781 17. 05 13. 27 7. 58 16: 00 30 0. 523598775 0. 49999 12. 05 9. 38 5. 36 17: 00 15 0. 261799388 0. 258819045 6. 24 4. 86 2. 77 18: 00 0 0. 00 183. 13 142. 50 81. 43 Daily Energy Collected (W*hr):

Graphical Representation of Hourly Power 30. 00 Power vs. Time of Day 25. 00 Power (W) 20. 00 15. 00 Summer Equinox 10. 00 Winter 5. 00 0. 00 6: 00 7: 00 8: 00 9: 00 10: 00 11: 00 12: 00 13: 00 14: 00 15: 00 16: 00 17: 00 18: 00 Time (Hours) Lindsey, R. (2009, January 14). Climate and earth’s energy budget. Retrieved from http: //earthobservatory. nasa. gov/Feature s/Energy. Balance/printall. php

DC-DC Converters TDK-LAMBDA Part NO. CC 3 -1203 SF RECOM Part NO. RPP 20 -2412 SW Both are through-hole devices Converter CC 3 -1203 SF-E RPP 20 -2412 SW Input Voltage (VDC) 9 -18 9 -36 Max Output Power Converter (W) CC 3 -1203 SF-E 2. 64 RPP 20 -2412 SW 20 Output Voltage (VDC) 3. 3 ± 0. 09 12 ± 0. 18 Max Output Current (A) 0. 8 1. 67 Efficiency(%) 74 86 Output Noise (m. V p-p) 120 100 Case Material Aluminum Potted No Yes (Silicone) *Will use the internal switch of the 12 VDC converter to shut off the output *Will need to test 15

Output Fuse to be placed at the output of the 12 V DC-DC Converter Bourns Part NO. MF-MSMF 050 -2 , SMT Device Trip Current = 1 A , Hold Current = 0. 5 A , Resistance =0. 15Ω • Polymeric Positive Temperature Coefficient (PPTC)/ resettable fuse • A non-linear thermistor acting as a circuit breaker at trip current • The device enters a high-resistance mode while passing a small value of current • When the current is decreased below the trip current value, the device resumes normal operation • The “hold current” value is the nominal operating current value of the PPTC *Will need to test 16

Energy Collection and Storage 17

Voltage Converting 18

Control and Communication 19

Microcontroller and Firmware 20

MSP 430 F 2234 • • 3. 3 V Supply Max Clock: 16 MHz 16 -Bit RISC Architecture 8 KB Flash Memory 512 B RAM 12 Channel 10 -bit ADC UART Interface 38 pin TSSOP 21

Operation Modes 22

23

Timers • Sensor Evaluation Loop is controlled by a 1 second timer interrupt. This timer uses an external 32 k. Hz crystal. • Communication timeouts are handled by a 208 -µS timer interrupt. This timer uses the internal DCO. 24

Sensor Operation • The internal and external temperature sensors uses two ADC channels each. • Solar panel sensing uses one ADC channel for current and one channel for voltage and one channel for an external negative reference. • Battery sensing uses two ADC channels for current and one for voltage. • Output sensing uses one ADC channel for current and one channel for voltage. 25

Fault Handling 26

Fault Handling 27

Communication • The NSSPCM uses a modified MODBUS protocol. Start Address Function Data CRC END 3. 5 c 8 bits n * 8 bits 3. 5 c 28

Functions Code 0 x 01 0 x 02 0 x 03 0 x 04 0 x 05 0 x 06 0 x 07 0 x 08 0 x 09 0 x 0 A 0 x 0 B Name GET_SOLAR GET_BATT GET_OUTPUT GET_INT_TEMP GET_EXT_TEMP GET_STATUS RESET_OUTPUT INT_TEMP_WARN INT_TEMP_CRITICAL BATT_LOW PING Description Get Solar Panel Voltage and Current Get Battery Voltage and Current Get Output Voltage and Current Get Internal Temperature Get External Temperature Returns Status of Module Toggles the Power Output Internal Temperature Warning Internal Temperature Critical Battery Level is Low Sends a ping 29

Exceptions Code Name Description 0 x 01 ILLEGAL_FUNCTION The function code received in the request is not an allowable action. 0 x 02 ILLEGAL_DATA_ADDRESS The data received in the address field is out of range. 0 x 03 ILLEGAL_DATA_VALUE A value in the data field is not allowable. 0 x 04 SLAVE_DEVICE_FAILURE An unrecoverable error occurred while the slave was attempting to process the request. 0 x 05 ACKNOWLEDGE The slave has accepted the request and is processing it but it will take longer than the timeout to process. 0 x 06 SLAVE_DEVICE_BUSY The slave node is busy processing a long duration request. 0 x 07 NEGATIVE_ACKNOWLEDGE That slave node cannot perform the request. 0 x 08 MEMORY_PARITY_ERROR The slave attempted to read extended memory but detected a parity error. 30

Timing 8 N 2 at 19200 baud 3. 5 char marker is 1. 458 m. S 1. 5 char marker is 0. 625 m. S 31

MAX 3483 • • • 3. 3 V Supply 250 kbps RS-485 1. 1 m. A Supply Current Half duplex 32

Mechanical Overview

Structural Design Overall Dimensions Length: 1 meter Width: 0. 383 meters Height: 0. 252 meters Weight: 0. 6027 kg

Front View: Top View:

Material Selection – Aluminum 6061 -T 6 *Selected for low density, high strength and availability 6061 -T 6 Material Properties: Density: Modulus of Elasticity: Poisson’s Ratio: Shear Strength: 2700 kg/m 3 68. 9 Gpa 0. 33 207 MPa Material Needed (T x W x L, qty): 1/16” x 3/4” x 12’ 1/16” x 3/4” x 10’ 1/16” x 1/2” x 10’ Source: www. matweb. com

Structural Analysis Anticipated Loading on Ascent: Average Speed of Rise: Peak Speeds: 6. 71 m/s (15 mph) 22 m/s (50 mph) Force due to Rise: 4. 55 N Solar Panel Area: 0. 0825 m 2

Structural Analysis - Deflection Maximum Deflection: 7. 7 mm Modeled using Average rise speed (6. 71 m/s)

Structural Analysis – Shear Stress Allowable Shear Stress: 207 MPa Maximum Shear Stress Experienced: 30. 5 MPa

Thermal Analysis – Enclosure Expanded Polystyrene: Thickness: 0. 035 m Density: 15 kg/m 3 Thermal Conductivity: 0. 027 W/m-K

Thermal Analysis - Enclosure

Thermal Analysis - Enclosure

Thermal Analysis - Conduction Heat Conditions: Maximum = 2. 996 Watts Minimum = 0. 3036 Watts Average = 1. 02 Watts

Weight Estimation Aluminum Enclosure Solar Panel Battery MPPT PCB Frame Hardware = = = = 0. 6027 kg 0. 195 kg 0. 65 kg 0. 589 kg 0. 04 kg 0. 09 kg 0. 25 kg Total = 2. 42 kg Specification = 2. 5 kg

PCB Layout Board Dimensions 203. 20 mm x 152. 40 mm 8. 0”(L) x 6. 0”(W) 45

Electronic Component PCB Area 2 -Layer Board: Through-hole and surface-mount components Component Dimensions (L x W x H): Board Section Dimensions 2. 5(L) x 6. 0 (W) A=1. 59 x 1. 0 x 0. 46 B=0. 90 x 0. 65 x 0. 33 C= 0. 19 x 0. 24 x 0. 06 D=0. 49 x 0. 31 x 0. 04 E=0. 59 x ? F=0. 39 x ? G=0. 23 x 0. 078 x ? H=1. 03 x 0. 37 x 0. 50 I=0. 21 x 0. 37 x 0. 50 J=0. 54 x 0. 37 x 0. 49 *See DDR Document Package for Component Descriptions *Dimensions in Inches *Not an exact layout of PCB 46

Connections To Payload 47

Preliminary Test Plan • Will present from Edge 48

Preliminary MSDII Plan • Beginning of MSDII (weeks 1 -3) • Will view on external document 49

Risk Management • Will present from EDGE 50
 Kate gleason college of engineering
 Kate del castillo kate trillo del castillo
 Kate kate 540
 Multidisciplinary engineering definition
 Gleason 7 tratamento
 Gleason skoru
 Mga katangian ng sosyalismo
 Adenocarcinome prostate
 Tumore prostata gleason 3+3
 Kristi gleason
 Uksn almora
 Multidisciplinary team pros and cons
 Temasek laboratories
 Multidisciplinary vs interdisciplinary
 Examples of transdisciplinary approach
 Multidisciplinary nature of environmental studies ppt
 Conflict in multidisciplinary teams
 Multisectoral and multidisciplinary
 Interdisciplinary multidisciplinary transdisciplinary
 Multidisciplinary studies epcc
 Senior design ucf
 Ece senior design gatech
 Ncsu csc senior design
 Ee senior design project ideas
 Wake tech admissions
 Early college high school at midland college
 Zeal dnyanganga college of engineering and research
 Thakur college of engineering and technology
 Ucf college of engineering and computer science
 Tagore engineering college rathinamangalam
 St anns college chirala
 Sree krishna college of engineering vellore
 Gec khagaria
 College of engineering science and technology
 College of engineering, king abdulaziz university
 G h patel college of engineering and technology
 Uc ceas
 Engineering staff college of india
 Swedish college of engineering and technology
 Saharsa college of engineering
 Computer based system engineering
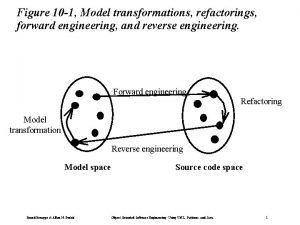
 Forward engineering and reverse engineering
 Engineering elegant systems: theory of systems engineering
 Engineering elegant systems: theory of systems engineering
 Reverse engineering vs forward engineering
 Kate musgrave
 Kate moles cardiff
 Grraacceess
 Barfbag holes
 Kate scholberg duke
 She stoops to conquer character


