ENERGY CONVERSION ES 832 a Eric Savory www


 • A closed thermodynamic system is completely surrounded by movable boundaries")
 • Heat – the mode of energy transfer to or from")

 Increased per capita energy demand directly proportional to increase in")
 Why use low-cost, non-renewable resources (pollution, depletion of resources)? -")


 • MOTIVATION: Survival of any energy conservation / production scheme")
 Cost of Operation: Costs consist of Fixed and Variable costs:")


")


 • LESSON FROM LAST EXAMPLE: Allowing the project to run")
 ARR method: Accounting Rate of Return ARR = [average net")
 DCF method: Discounted Cash Flow Method Both ARR and Payback")
 For example: compare the fixed rate of return in a")
 Two methods are commonly used • NPV method: Net Present")
 IRR method: Internal Rate of Return Method This is the")
 The Net Present Value (NPV) is usually determined as an")


 ARR = [average net annual saving (after")
![Assessment using Payback method Payback = time required for net savings (less depreciation [$500])](https://slidetodoc.com/presentation_image_h2/553b4444724511cec388b6cb4d05c627/image-31.jpg "Assessment using Payback method Payback = time required for net savings (less depreciation [$500])")
 method Target discount rate must match competitor’s rate")


 method This is the discount rate (r or")


- Slides: 44
ENERGY CONVERSION ES 832 a Eric Savory www. eng. uwo. ca/people/esavory/es 832. htm Lecture 2 – The definition of energy, the costs of energy and economic considerations Department of Mechanical and Material Engineering University of Western Ontario
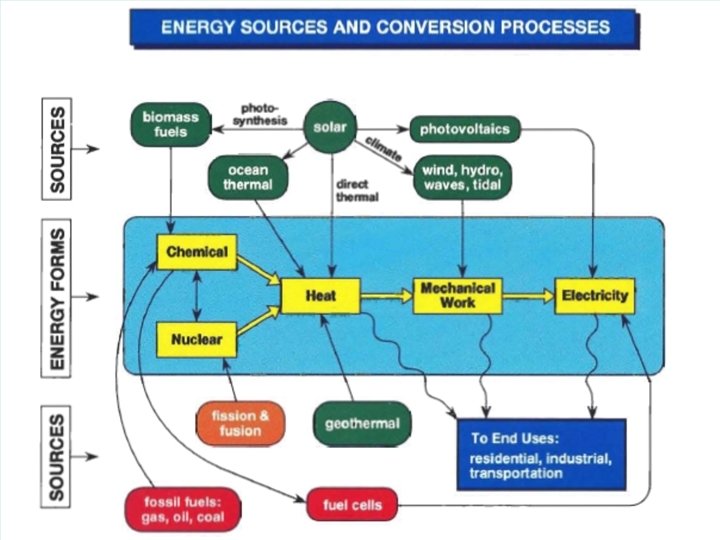
Engineering definition of energy conversion • Thermodynamic relationships between systems and the surroundings. • Our interest - the change in the energy content of a given system and its interaction with the surroundings during the course of change. • Energy analysis – The total amount of energy a system can give / take from its surrounding. – What fraction of the exchanged energy can be converted to useful purposes (motion, electricity, etc)
Thermodynamic considerations (1) • A closed thermodynamic system is completely surrounded by movable boundaries permeable to heat but not to matter (e. g. a piston) • By adding weight to the piston, we can compress the gas and store energy; work performed by the surroundings • The resulting downward movement of the piston is work obtained by the system from its surroundings. • The amount of work taken up by the system is always less than the work done on the system by its surrounding by an amount of energy equal to the heat gained by the system.
Thermodynamic considerations (2) • Heat – the mode of energy transfer to or from the system by virtue of contact with another system at different temperature • Work – the mode of energy transfer, other than heat, that changes the energy of the system (e. g. chemical reaction, electrical generator) • Power – the rate of energy exchange between two systems
Changes in system properties that produce or consume work Category of work Physical process Energy-related example Pressure-volume Volume change caused by force per unit area Movement of piston in IC engine Surface deformation Surface area change caused by surface tension Small stationary droplet of liquid fuel suspended in a quiescent fluid assumes spherical shape Transport of ionized (electrically charged) material Movement of charged matter caused by an electrical field Electrostatic precipitation of particulate pollutants in stack gas Frictional Movement of solids in surface contact Generation of waste heat by unlubricated moving parts in machinery Stress-strain Deformation (strain) of a material caused by a force per unit area (stress) Pumping of a viscous (highly frictional) liquid through a pipe
Economics of Globalization (1) Increased per capita energy demand directly proportional to increase in standard of living (e. g. : 0. 5 k. W/person in 3 rd world vs. 10 k. W/person USA)
Economics of Globalization (1) Why use low-cost, non-renewable resources (pollution, depletion of resources)? - Rich countries (high production costs) must compete with products from poorer countries (low production cost) in the same market. A loss of market a decrease of living standards Public awareness and consumer habits: Why do we always choose the cheapest product? - Poor understanding of long-term cost associated with the effect of different energy and manufacturing methods on the environment and population health
Technical limitations, efficiency of scales and cost effectiveness • The most suitable energy source depends greatly on the final use since efficiency and environmental friendliness change with scale and application • Energy use: Transportation ~15%; Industry (manufacturing and extraction) ~ 50%; Commercial (mainly buildings) ~ 15%; Domestic (home heating etc) ~ 20% – Wind turbines: can only be used in small areas to be efficient – Hydro power: only justifiable at very large scale – Efficiency of Natural gas: 95% for direct use (heating); 30% to generate electricity • CONCLUSION: Selection criteria for energy conversion designs require that we understand the end use and the economic (and sometimes social) factors which will ensure its feasibility. Thus, a system must be: – Selected based on the scale of use – Be cost effective (globally) compared to other solutions (i. e. efficient thermodynamically and socially)
Economic considerations: The Cost of Operation
Cost of operation (1) • MOTIVATION: Survival of any energy conservation / production scheme depends on the ability to generate a rate-of-return (i. e. profit) within a reasonable period (payback time). This elementary calculation is an important first step in selecting a design. • OBJECTIVES: 1) Assessing the Cost of Operations 2) Assessing Rate of return: Value of Investment 3) External considerations
Cost of operation (2) Cost of Operation: Costs consist of Fixed and Variable costs: - Fixed Costs: do not change with production ● Capital Investment: Initial Investment to permit production ● Interest: Cost of borrowing capital ● Depreciation: Remaining value on equipment after given period (also known as salvage value) ● Site / plant Costs: e. g. rent, insurance - Variable Costs: depend on production ● Fuel, Maintenance, Labour, Delivery, Storage
Example: A company requires 1, 000 k. W of electrical power. You are to determine whether it is more economical to buy electricity from Hydro One (the cost of power is 8 c / k. Wh) or to buy a new Diesel Generator delivering 1, 000 k. W at a fuel cost of 5 c / k. Wh. The generator’s initial cost is $250, 000, for which money was borrowed at a rate of 7. 5% over five years and its depreciation rate is given as 20%. The criterion for selection is that the payback period must be less than one year. The generator operates 12 hrs / day, 6 days / week. Can this be done? If yes, how long will it take (in days)?
Solution procedure 1. Clearly identify the answer sought: Is the minimum time required for payback, n, less than the operating time in a year? 2. Determine the information available: Cost of Hydro One: CHO= $0. 08 / k. Wh Cost of operating diesel: COD= $0. 05 / k. Wh Depreciation rate: r. D=0. 20 / yr Interest charge: ri = 0. 075 / yr Reimbursement to bank of Capital Invested $250, 000
3. Determine the equations needed to solve the problem: Primary equations: Cost of Hydro >= Cost of Diesel operation CH >= CD Filling in the equations for CH and CD: CH = $0. 08 / k. Wh * 1, 000 k. W * n =$ 80*n CD = CF + CDi + CB CF : fuel cost CDi: depreciated cost CB: reimbursement to bank n : time in hours
Secondary equations: Fuel: CF = $0. 05 / k. Wh * 1, 000 k. W * n = $50*n Bank: CB = 250, 000 * ri + 50, 000 Depreciation: CDi = 250, 000 * r. D CB is the cost of interest (250, 000 * ri ) and the portion of capital to be paid back in that year ($50, 000) CDi is the depreciation expense that year at the given rate. If no rate is given, assume a straight line depreciation (i. e. the generator is worth nothing at the end of 5 years, therefore the depreciation expense is $50, 000 / yr)
4. Combine the equations and solve for n: 80*n >= 50*n + 250, 000(ri) +50, 000 + 250, 000 r. D 30*n >= 250, 000(ri + r. D) + 50, 000 30*n >= 250, 000(0. 075 + 0. 2) + 50, 000 [=118, 750] n >= 3, 958. 33 hrs or ~330 days Given that the plant works 6 days/week for 52 weeks = 312 days, the cost of operation of the diesel option is too prohibitive. As a good manager you need to be pro-active, by thinking “outside the box” and examining what happens if you have flexibility in the constraints by posing “what if ? ” scenarios.
So, if we carry this calculation into the second year, thereby allowing payback over 2 years: Fuel: CF = $ 50*n (variable) Bank: CB = 200, 000 * ri + 50, 000 = 65, 000 (fixed) Depr: CDi = [(250, 000) – 250, 000(0. 2)]*0. 2 = 40, 000 (because the depreciation is less) 30*n >= 118, 750 + 105, 000 = 223, 750 (year 1 + 2) n >= 7, 458 hrs (621. 5 days < 624 days) Therefore, it would be acceptable if the payback period were 2 years. The return would then increase every year!
Conclusion: Cost of operation is a cost per unit time. The cost is a combined quantity of fixed and variable costs. In our example, the diesel had a fixed purchase cost, with financing and depreciation, and the fuel was a variable, whereas the Hydro One option was a variable rate of electricity.
Economic considerations: The Value of Investment
Value of Investment (1) • LESSON FROM LAST EXAMPLE: Allowing the project to run longer provided a different selection choice • MOTIVATION: Hence, in order to assess the economic viability of a project it is important to clearly identify the influence of time • OBJECTIVE: To introduce different criteria for evaluating viability. Each method has advantages and disadvantages: the proper criteria for selecting a method still depends on the end goal !!
Value of Investment (2) ARR method: Accounting Rate of Return ARR = [average net annual saving (after depreciation)] / capital cost Payback method: Length of time required for running total of net savings (before depreciation) to equal the cost of the project.
Value of Investment (3) DCF method: Discounted Cash Flow Method Both ARR and Payback methods fail to allow for the timing of the saving (they are OK for shortterm solutions or small projects). However, when the time scale is longer, the value of the money changes over time. This is important, since often the value of a company is assessed on the value of its returns (e. g. stocks or bonds). The idea is to compare the growth of capital to unexpected or desired rate of return.
Value of Investment (4) For example: compare the fixed rate of return in a bank at 10% interest Today (Year 0) = 100 Year 5 = 100*(1+0. 10)5 = 161 Thus, the company must generate a net saving or return of 61% over 5 years to match this 10% rate.
Value of Investment (5) Two methods are commonly used • NPV method: Net Present Value Method The strategy involves bringing all net savings (after depreciation) to “Year 0” (today’s) value. It is calculated over the entire life of the project. – The project is acceptable if NPV > 0 – The discount rate is essentially the target rate (based on internal cost of money or target rate of return) To rank several projects, the profitability index is used: – p. i. = sum of discounted savings / capital cost = (capital cost + NPV) / capital cost
Value of Investment (6) IRR method: Internal Rate of Return Method This is the discount rate needed to make NPV=0 It is essentially the maximum rate of return on the invested capital. It is based on the entire life of the project It is clear that the Accounting Rate of Return (ARR) and Payback methods are straightforward, whilst Net Present Value (NPV) and Internal Rate of Return (IRR) methods are a little trickier.
Value of Investment (7) The Net Present Value (NPV) is usually determined as an equivalent to money placed at a constant rate of return This approach is good if the financing is done through fixed return sources (e. g. bonds or dividend yielding stock) The Internal Rate of Return (IRR) is used to determine the target ratio of return This approach is riskier and is more suited to financing through common shares
Example: A company is considering investing $12, 000 to $16, 000 in energy saving strategies. The energy manager has three different schemes (Projects) to choose from and their accounting details are given below. The savings are calculated as the monetary value less interest charges and operating costs. The manager also knows that the competitor’s stocks have been increasing at a rate of 8. 5% a year. All the Projects have a depreciation of $500 / year. Evaluate three projects using the ARR, Payback, NPV and IRR methods.
Project 1 Project 2 Project 3 $12, 000 $16, 000 Year 1 $3, 000 $3, 600 $3, 500 Year 2 $3, 000 $3, 400 $3, 750 Year 3 $3, 000 $3, 200 $4, 000 Year 4 $3, 000 $2, 800 $4, 250 Year 5 $3, 000 $2, 600 $4, 500 Year 6 $3, 000 $2, 400 $4, 750 Capital invested: Annual saving (after depreciation):
Assessment using Accounting Rate of Return (ARR) ARR = [average net annual saving (after depreciation)] / capital cost Project 1 Project 2 Project 3 Total saving $18, 000 $24, 750 Average annual saving (in 6 yrs) $3, 000 $4, 125 ARR 25. 0% 25. 8%
Assessment using Payback method Payback = time required for net savings (less depreciation [$500]) to equal capital cost Project 1 Project 2 Project 3 Saving / Total Year 1 3000+500=3500 3600+500=4100 3500+500=4000 Year 2 3000+500=7000 3400+500=8000 3750+500=8250 Year 3 3000+500=10500 3200+500=11700 4000+500=12750 Year 4 3000+500=14000 2800+500=15000 4250+500=17000 Interpolate to capital cost 3. 4 years 3. 1 years 3. 9 years
Assessment using Net Present Value (NPV) method Target discount rate must match competitor’s rate of 8. 5% r = 0. 085 Discounted value = Saving / (1 + r)n [n = year count = 1, 2, 3 etc] Profitability index, p. i. = (NPV + Capital) / Capital NOTE: The reason why both the NPV and Profitability Index are used simultaneously in this method is to take into account the differing initial capital amounts
So for Project 1 we have to obtain the sum for NPV as: … and the Profitability Index, p. i. as:
Project 1 Year Saving 0 1 2 3 4 5 6 NPV p. i. -12000 Discounted -12000 Project 2 Project 3 Saving Disco- Saving Discounted -12000 -16000 3000 2764. 98 3600 3317. 97 3500 3225. 81 3000 2548. 37 3400 2888. 15 3750 3185. 46 3000 2348. 72 3200 2505. 31 4000 3131. 63 3000 2164. 72 2800 2020. 41 4250 3066. 69 3000 1995. 14 2600 1729. 12 4500 2992. 70 3000 1838. 84 2400 1471. 07 4750 2911. 49 $1660. 76 $1932. 02 $2513. 78 1. 138 1. 161 1. 157
Using Internal Rate of Return (IRR) method This is the discount rate (r or IRR) needed to make NPV = 0 So, for Project 1 how do we set up the appropriate equation? …. which may either be solved explicitly or graphically.
I’ll leave you to work this out but the answers are: Project 1 r = 13. 0 % Project 2 r = 14. 1 % Project 3 r = 13. 3 %
Summary of results from the different methods Method Best project ARR 3 Payback 2 NPV 2 IRR 2
Summary of Value of Investment Methods Advantages Disadvantages Quick Ignores timing issues (cost of money) Payback Quick. Good for short term project Poor indicator for long term Does not account for net saving NPV – Net Present Gives “true” saving Provides for cost of money Requires correct rate estimation Discount rate assumed constant (usually) Allows to account for targets, such as minimum rate of return Success depends on r selection Discount rate assumed constant Inflation is ignored ARR – Accounting Rate of Return Value IRR – Internal Rate of Return
Details of the Individual Term Project Report: 50% of course grade Presentation: 20% of course grade
Objective To improve your knowledge of a specific area of energy conversion analysis by providing an individual project report concerning an energy conversion process (or series of linked processes) in which you will examine current practice including example calculations, the process efficiencies and alternative strategies for achieving the same practical outcome, against a background of the need to reduce local and global carbon emissions. To present the project to the class, including answering questions from the audience. To provide a final report.
Topic Selection Firstly, you should select your topic from one of the following sectors: 1. Energy production, storage and transmission 2. Transportation (e. g. road vehicles, rail vehicles, aircraft, ships) 3. Manufacturing industry (e. g. raw materials processing, finished product manufacturing) 4. The built environment (e. g. houses, roads, tall buildings, bridges)
Researching the literature Then, within that sector choose a specific energy conversion process or linked processes. You will then need to identify and obtain the key papers relating to your chosen topic as these will form the basis of your discussion. A minimum of 10 papers must be included in your discussion, at least 5 of which should be journal papers. It is useful if you can identify a recent review paper as this will help you find the key publications. Next weeks class: Engineering librarian will give a talk on research strategies for this course
Deadlines Before Thursday 11 th October – Choose a topic and e-mail me a title and brief outline of proposed area of research Before the next class - I will e-mail you with comments concerning your proposal so you can start detailed work Wednesday 28 th November - Paper copy of your final report due (9 weeks from today!) 5 pm on Tuesday 20 th November – Powerpoint presentation file to be e-mailed or given to me 21 st and 28 th November – Presentations (15 minutes) in class time slot to be attended by all students registered on the course