EIS THE FUEL FOR CONTINUOUS IMPROVEMENT Art Schneiderman
- Slides: 38
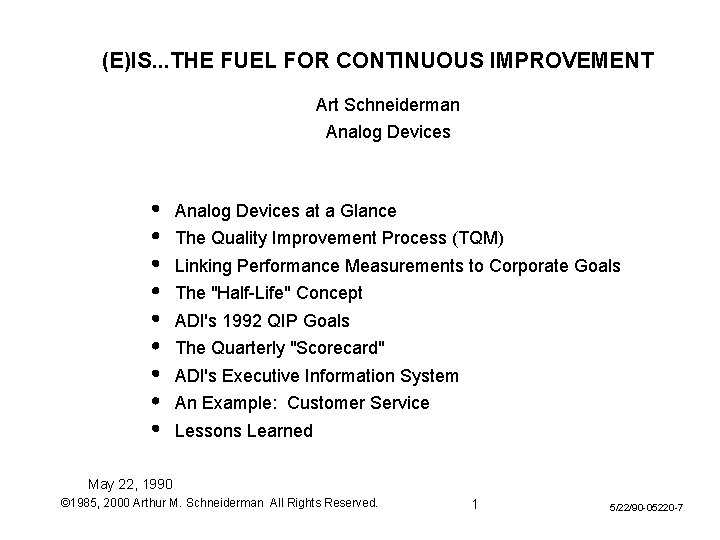
(E)IS. . . THE FUEL FOR CONTINUOUS IMPROVEMENT Art Schneiderman Analog Devices at a Glance The Quality Improvement Process (TQM) Linking Performance Measurements to Corporate Goals The "Half-Life" Concept ADI's 1992 QIP Goals The Quarterly "Scorecard" ADI's Executive Information System An Example: Customer Service Lessons Learned May 22, 1990 © 1985, 2000 Arthur M. Schneiderman All Rights Reserved. 1 5/22/90 -05220 -7
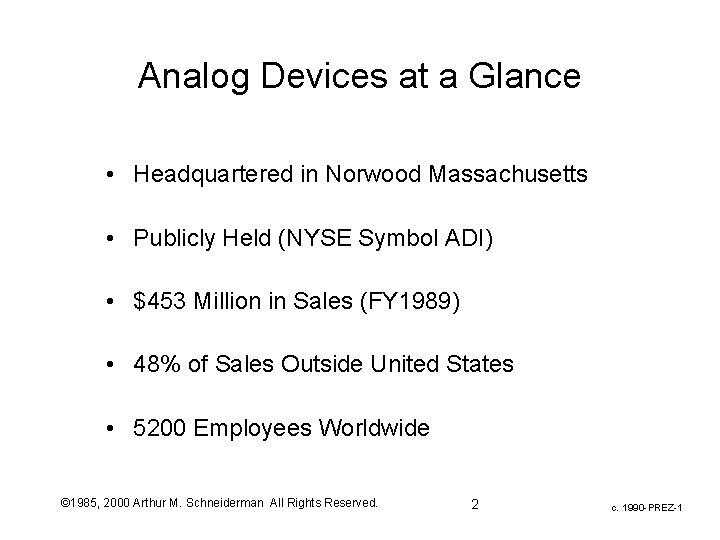
Analog Devices at a Glance • Headquartered in Norwood Massachusetts • Publicly Held (NYSE Symbol ADI) • $453 Million in Sales (FY 1989) • 48% of Sales Outside United States • 5200 Employees Worldwide © 1985, 2000 Arthur M. Schneiderman All Rights Reserved. 2 c. 1990 -PREZ-1
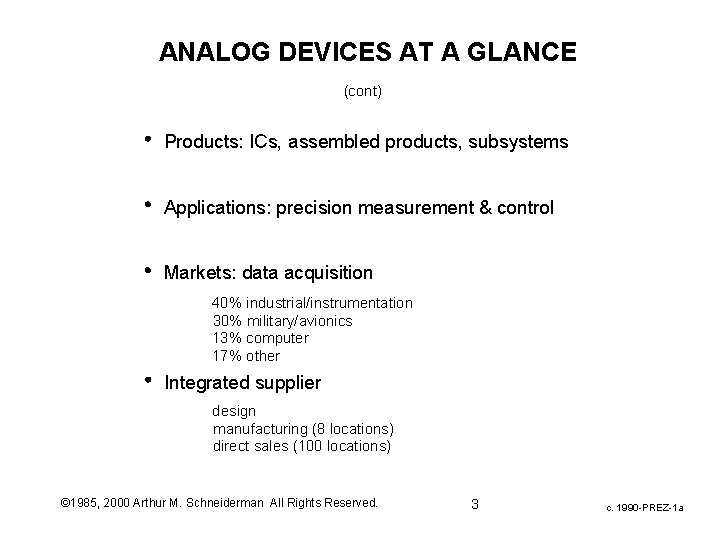
ANALOG DEVICES AT A GLANCE (cont) Products: ICs, assembled products, subsystems Applications: precision measurement & control Markets: data acquisition 40% industrial/instrumentation 30% military/avionics 13% computer 17% other Integrated supplier design manufacturing (8 locations) direct sales (100 locations) © 1985, 2000 Arthur M. Schneiderman All Rights Reserved. 3 c. 1990 -PREZ-1 a
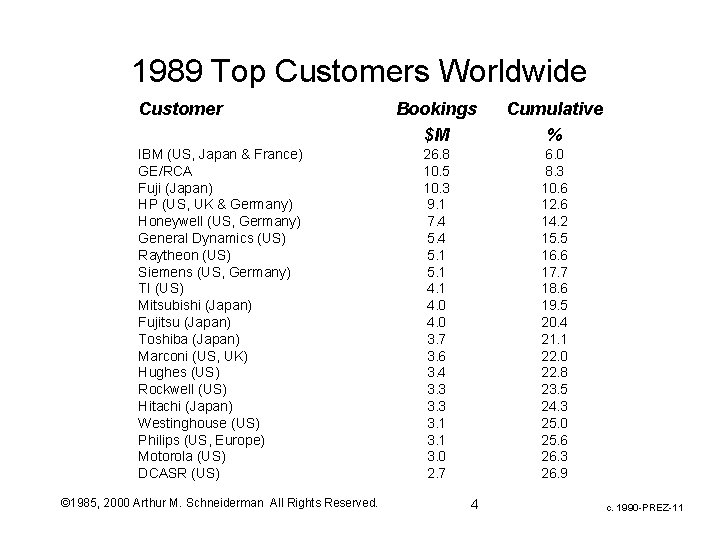
1989 Top Customers Worldwide Customer IBM (US, Japan & France) GE/RCA Fuji (Japan) HP (US, UK & Germany) Honeywell (US, Germany) General Dynamics (US) Raytheon (US) Siemens (US, Germany) TI (US) Mitsubishi (Japan) Fujitsu (Japan) Toshiba (Japan) Marconi (US, UK) Hughes (US) Rockwell (US) Hitachi (Japan) Westinghouse (US) Philips (US, Europe) Motorola (US) DCASR (US) © 1985, 2000 Arthur M. Schneiderman All Rights Reserved. Bookings $M Cumulative % 26. 8 10. 5 10. 3 9. 1 7. 4 5. 1 4. 0 3. 7 3. 6 3. 4 3. 3 3. 1 3. 0 2. 7 6. 0 8. 3 10. 6 12. 6 14. 2 15. 5 16. 6 17. 7 18. 6 19. 5 20. 4 21. 1 22. 0 22. 8 23. 5 24. 3 25. 0 25. 6 26. 3 26. 9 4 c. 1990 -PREZ-11
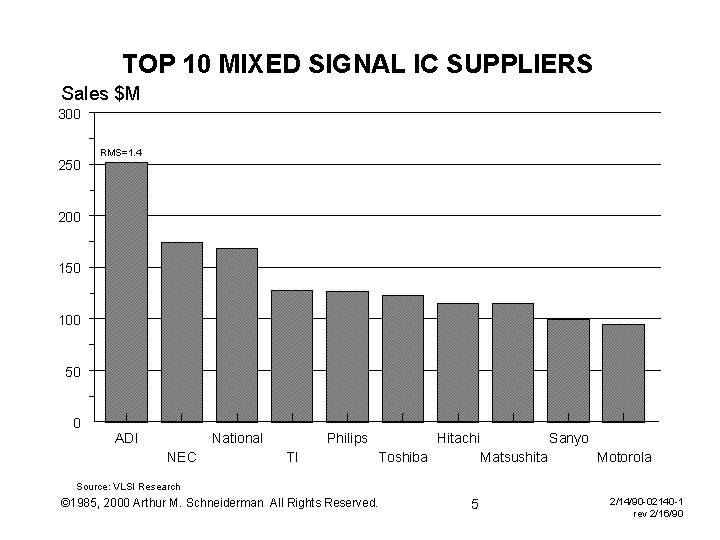
TOP 10 MIXED SIGNAL IC SUPPLIERS Sales $M 300 250 RMS=1. 4 200 150 100 50 0 ADI National NEC Philips TI Hitachi Toshiba Sanyo Matsushita Motorola Source: VLSI Research © 1985, 2000 Arthur M. Schneiderman All Rights Reserved. 5 2/14/90 -02140 -1 rev 2/16/90
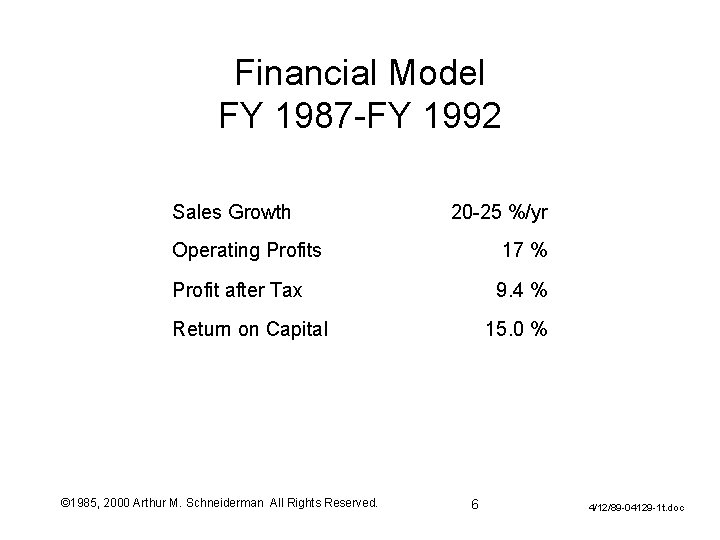
Financial Model FY 1987 -FY 1992 Sales Growth 20 -25 %/yr Operating Profits 17 % Profit after Tax 9. 4 % Return on Capital © 1985, 2000 Arthur M. Schneiderman All Rights Reserved. 15. 0 % 6 4/12/89 -04129 -1 t. doc
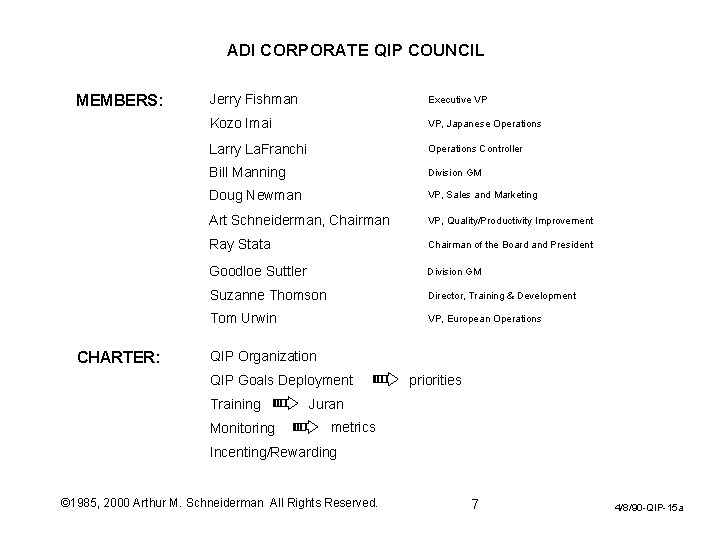
ADI CORPORATE QIP COUNCIL MEMBERS: CHARTER: Jerry Fishman Executive VP Kozo Imai VP, Japanese Operations Larry La. Franchi Operations Controller Bill Manning Division GM Doug Newman VP, Sales and Marketing Art Schneiderman, Chairman VP, Quality/Productivity Improvement Ray Stata Chairman of the Board and President Goodloe Suttler Division GM Suzanne Thomson Director, Training & Development Tom Urwin VP, European Operations QIP Organization QIP Goals Deployment Training Monitoring priorities Juran metrics Incenting/Rewarding © 1985, 2000 Arthur M. Schneiderman All Rights Reserved. 7 4/8/90 -QIP-15 a
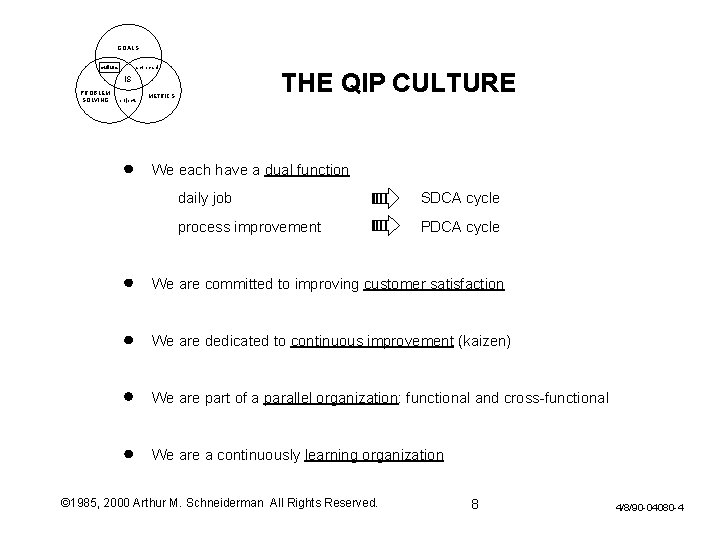
GOALS culture scorecard THE QIP CULTURE IS PROBLEM SOLVING projects METRICS We each have a dual function daily job SDCA cycle process improvement PDCA cycle We are committed to improving customer satisfaction We are dedicated to continuous improvement (kaizen) We are part of a parallel organization: functional and cross-functional We are a continuously learning organization © 1985, 2000 Arthur M. Schneiderman All Rights Reserved. 8 4/8/90 -04080 -4
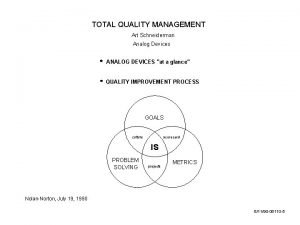
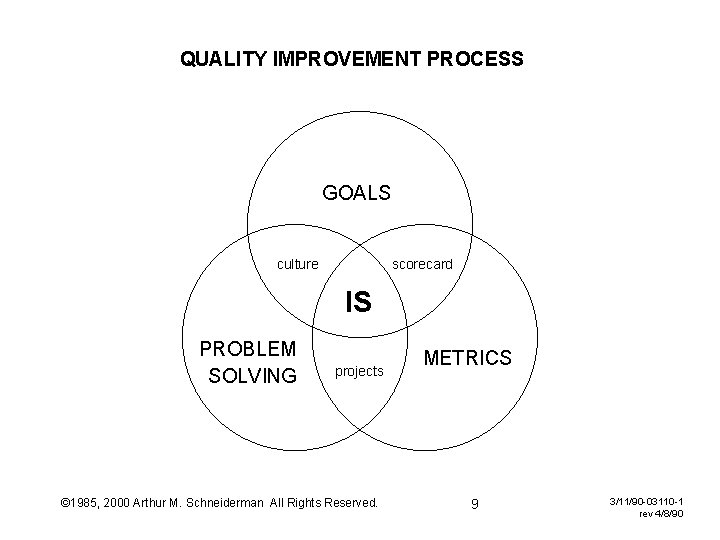
QUALITY IMPROVEMENT PROCESS GOALS culture scorecard IS PROBLEM SOLVING projects © 1985, 2000 Arthur M. Schneiderman All Rights Reserved. METRICS 9 3/11/90 -03110 -1 rev 4/8/90
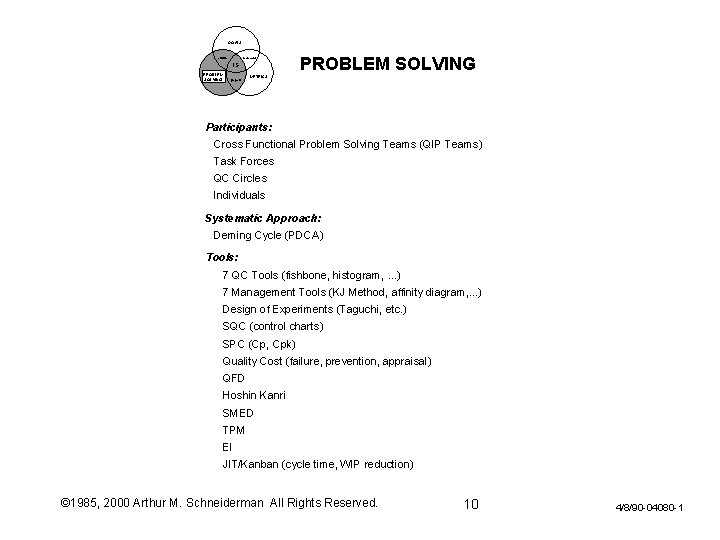
GOALS culture scorecard IS PROBLEM SOLVING projects PROBLEM SOLVING METRICS Participants: Cross Functional Problem Solving Teams (QIP Teams) Task Forces QC Circles Individuals Systematic Approach: Deming Cycle (PDCA) Tools: 7 QC Tools (fishbone, histogram, . . . ) 7 Management Tools (KJ Method, affinity diagram, . . . ) Design of Experiments (Taguchi, etc. ) SQC (control charts) SPC (Cp, Cpk) Quality Cost (failure, prevention, appraisal) QFD Hoshin Kanri SMED TPM EI JIT/Kanban (cycle time, WIP reduction) © 1985, 2000 Arthur M. Schneiderman All Rights Reserved. 10 4/8/90 -04080 -1
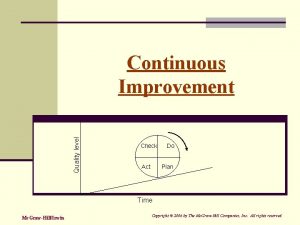
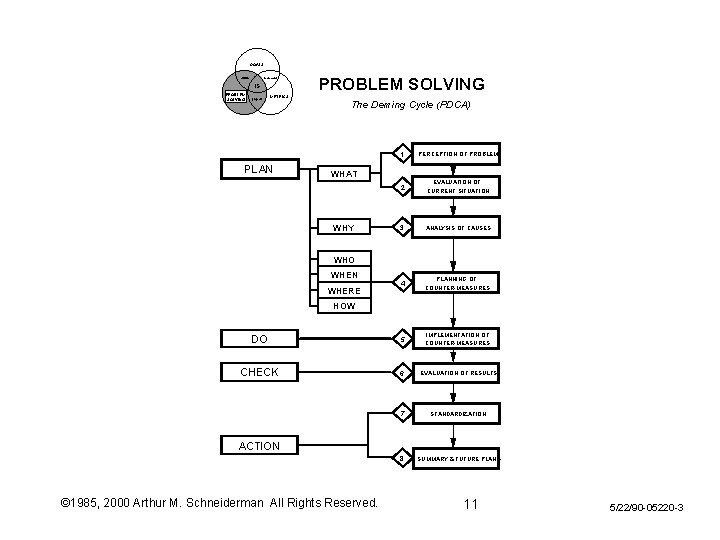
GOALS culture scorecard IS PROBLEM SOLVING projects METRICS PROBLEM SOLVING The Deming Cycle (PDCA) 1 PERCEPTION OF PROBLEM 2 EVALUATION OF CURRENT SITUATION 3 ANALYSIS OF CAUSES 4 PLANNING OF COUNTER-MEASURES DO 5 IMPLEMENTATION OF COUNTER-MEASURES CHECK 6 EVALUATION OF RESULTS 7 STANDARDIZATION 8 SUMMARY & FUTURE PLANS PLAN WHAT WHY WHO WHEN WHERE HOW ACTION © 1985, 2000 Arthur M. Schneiderman All Rights Reserved. 11 5/22/90 -05220 -3
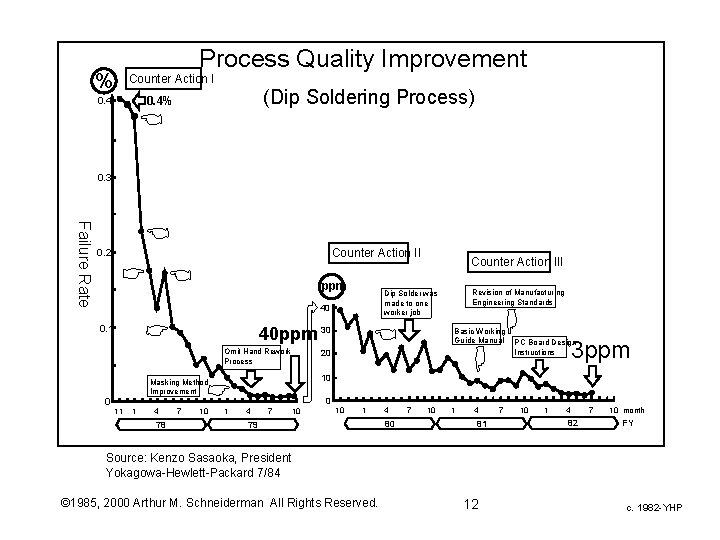
Process Quality Improvement % Counter Action I (Dip Soldering Process) 0. 4% 0. 4 0. 3 Failure Rate Counter Action II 0. 2 ppm 40 ppm 30 Omit Hand Rework Process 0 1 4 78 7 10 Basic Working Guide Manual 20 3 ppm PC Board Design Instructions 10 Masking Method Improvement 11 Revision of Manufacturing Engineering Standards Dip Solder was made to one worker job 40 0. 1 Counter Action III 0 1 4 7 10 10 1 79 4 80 7 10 1 4 81 7 10 1 4 82 7 10 month FY Source: Kenzo Sasaoka, President Yokagowa-Hewlett-Packard 7/84 © 1985, 2000 Arthur M. Schneiderman All Rights Reserved. 12 c. 1982 -YHP
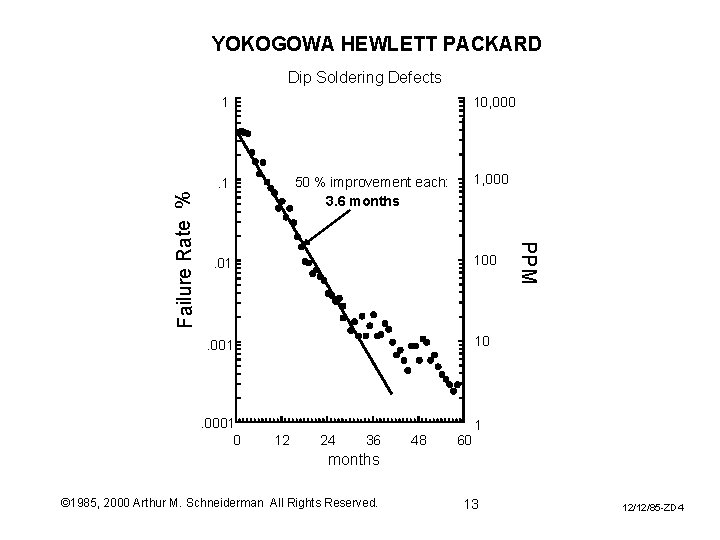
YOKOGOWA HEWLETT PACKARD Dip Soldering Defects 10, 000 1 . 01 100 . 001 10 . 0001 0 12 24 36 48 60 PPM Failure Rate % 1, 000 50 % improvement each: 3. 6 months . 1 1 months © 1985, 2000 Arthur M. Schneiderman All Rights Reserved. 13 12/12/85 -ZD 4
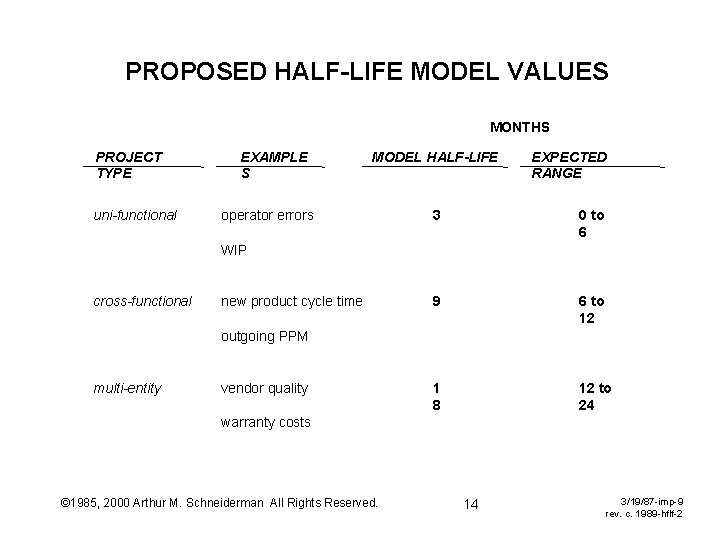
PROPOSED HALF-LIFE MODEL VALUES MONTHS PROJECT TYPE uni-functional EXAMPLE S MODEL HALF-LIFE operator errors EXPECTED RANGE 3 0 to 6 9 6 to 12 1 8 12 to 24 WIP cross-functional new product cycle time outgoing PPM multi-entity vendor quality warranty costs © 1985, 2000 Arthur M. Schneiderman All Rights Reserved. 14 3/19/87 -imp-9 rev. c. 1989 -hflf-2
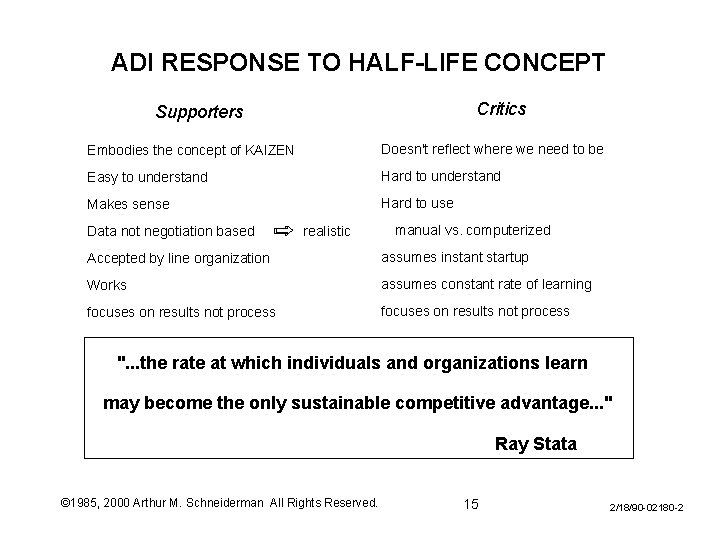
ADI RESPONSE TO HALF-LIFE CONCEPT Critics Supporters Embodies the concept of KAIZEN Doesn't reflect where we need to be Easy to understand Hard to understand Makes sense Hard to use Data not negotiation based realistic manual vs. computerized Accepted by line organization assumes instant startup Works assumes constant rate of learning focuses on results not process ". . . the rate at which individuals and organizations learn may become the only sustainable competitive advantage. . . " Ray Stata © 1985, 2000 Arthur M. Schneiderman All Rights Reserved. 15 2/18/90 -02180 -2
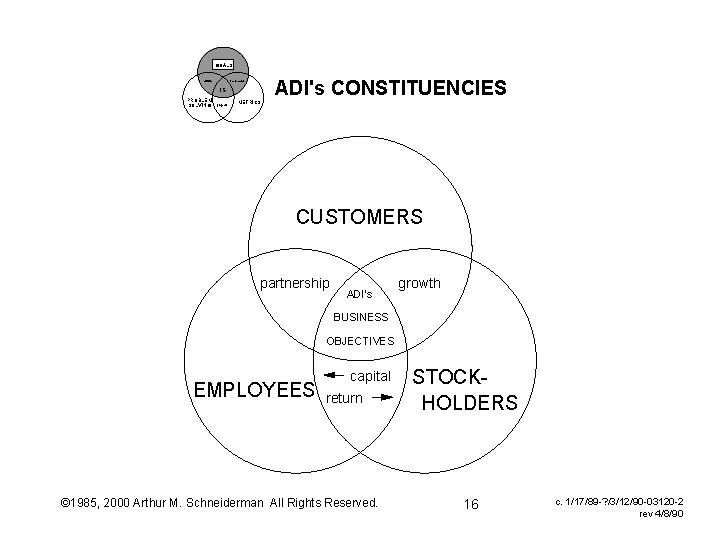
GOALS culture ADI's CONSTITUENCIES scorecard IS PROBLEM SOLVING projects METRICS CUSTOMERS partnership ADI's growth BUSINESS OBJECTIVES EMPLOYEES capital return © 1985, 2000 Arthur M. Schneiderman All Rights Reserved. STOCKHOLDERS 16 c. 1/17/89 -? /3/12/90 -03120 -2 rev 4/8/90
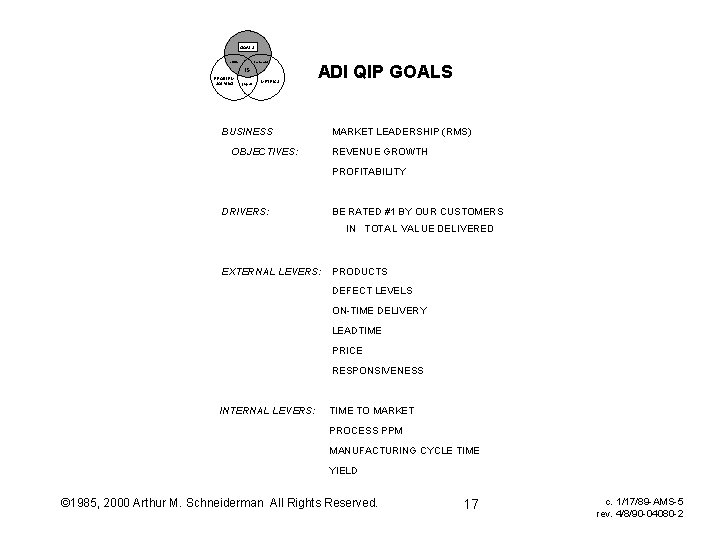
GOALS culture scorecard IS PROBLEM SOLVING projects METRICS BUSINESS OBJECTIVES: ADI QIP GOALS MARKET LEADERSHIP (RMS) REVENUE GROWTH PROFITABILITY DRIVERS: BE RATED #1 BY OUR CUSTOMERS IN TOTAL VALUE DELIVERED EXTERNAL LEVERS: PRODUCTS DEFECT LEVELS ON-TIME DELIVERY LEADTIME PRICE RESPONSIVENESS INTERNAL LEVERS: TIME TO MARKET PROCESS PPM MANUFACTURING CYCLE TIME YIELD © 1985, 2000 Arthur M. Schneiderman All Rights Reserved. 17 c. 1/17/89 -AMS-5 rev. 4/8/90 -04080 -2
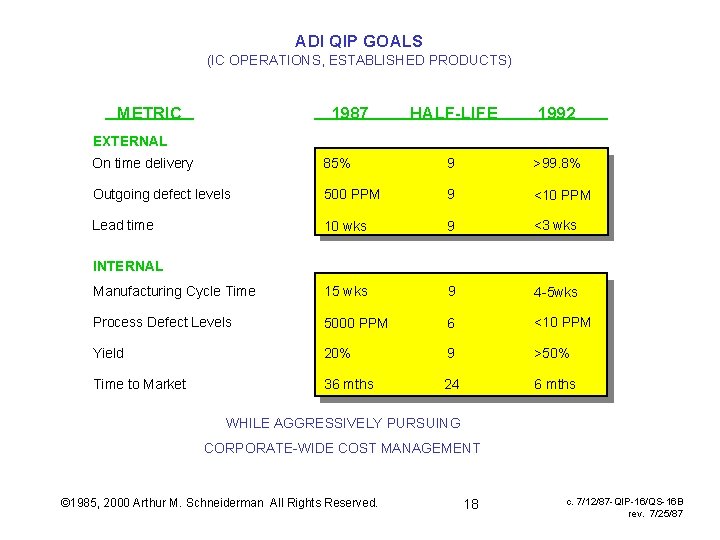
ADI QIP GOALS (IC OPERATIONS, ESTABLISHED PRODUCTS) METRIC 1987 HALF-LIFE 1992 EXTERNAL On time delivery 85% 9 >99. 8% Outgoing defect levels 500 PPM 9 <10 PPM Lead time 10 wks 9 <3 wks Manufacturing Cycle Time 15 wks 9 4 -5 wks Process Defect Levels 5000 PPM 6 <10 PPM Yield 20% 9 >50% Time to Market 36 mths 24 6 mths INTERNAL WHILE AGGRESSIVELY PURSUING CORPORATE-WIDE COST MANAGEMENT © 1985, 2000 Arthur M. Schneiderman All Rights Reserved. 18 c. 7/12/87 -QIP-16/QS-16 B rev. 7/25/87
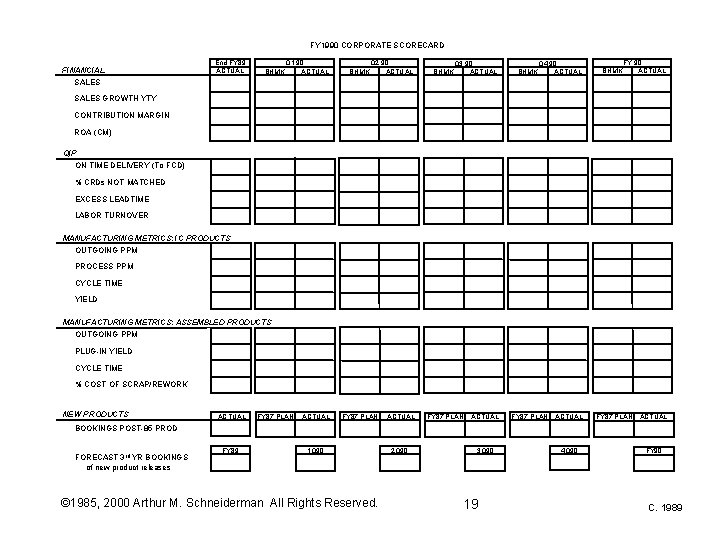
FY 1990 CORPORATE SCORECARD FINANCIAL End FY 89 ACTUAL BHMK Q 1 90 ACTUAL BHMK Q 2 90 ACTUAL BHMK Q 3 90 ACTUAL BHMK Q 4 90 ACTUAL BHMK FY 90 ACTUAL SALES GROWTH YTY CONTRIBUTION MARGIN ROA (CM) QIP ON TIME DELIVERY (To FCD) % CRDs NOT MATCHED EXCESS LEADTIME LABOR TURNOVER MANUFACTURING METRICS: IC PRODUCTS OUTGOING PPM PROCESS PPM CYCLE TIME YIELD MANUFACTURING METRICS: ASSEMBLED PRODUCTS OUTGOING PPM PLUG-IN YIELD CYCLE TIME % COST OF SCRAP/REWORK NEW PRODUCTS ACTUAL FY 87 PLAN ACTUAL FY 87 PLAN ACTUAL BOOKINGS POST-85 PROD FORECAST 3 rd YR BOOKINGS of new product releases FY 89 1 Q 90 © 1985, 2000 Arthur M. Schneiderman All Rights Reserved. 2 Q 90 3 Q 90 19 4 Q 90 FY 90 C. 1989
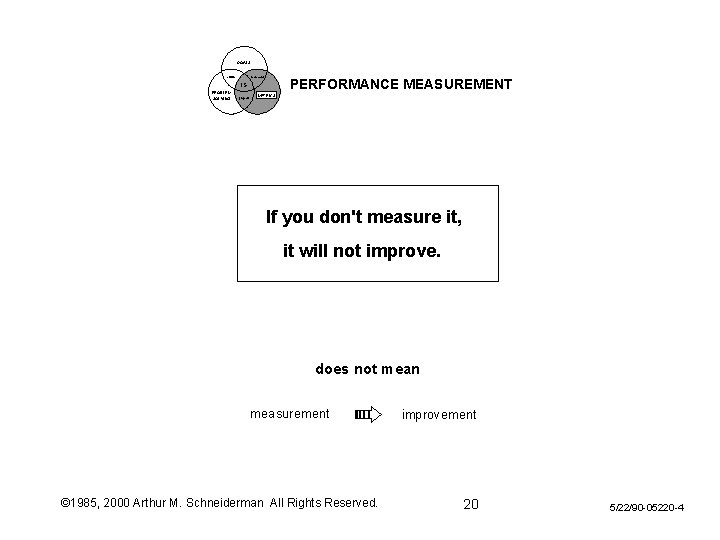
GOALS culture scorecard PERFORMANCE MEASUREMENT IS PROBLEM SOLVING projects METRICS If you don't measure it, it will not improve. does not mean measurement © 1985, 2000 Arthur M. Schneiderman All Rights Reserved. improvement 20 5/22/90 -05220 -4
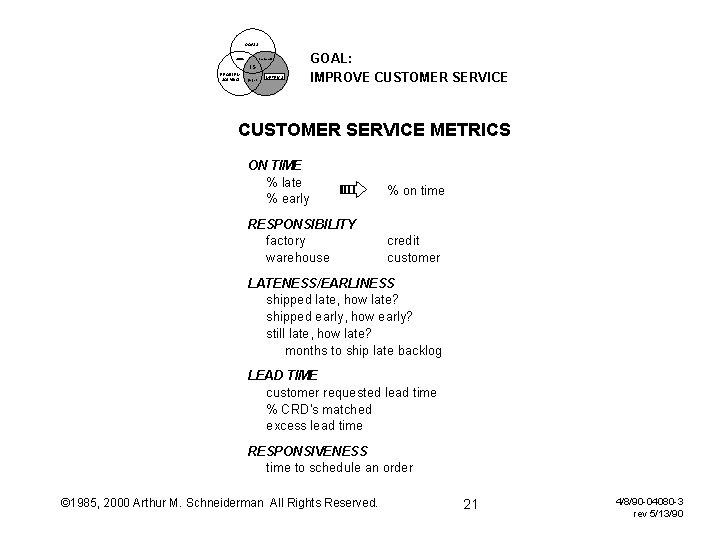
GOALS culture scorecard IS PROBLEM SOLVING projects METRICS GOAL: IMPROVE CUSTOMER SERVICE METRICS ON TIME % late % early RESPONSIBILITY factory warehouse % on time credit customer LATENESS/EARLINESS shipped late, how late? shipped early, how early? still late, how late? months to ship late backlog LEAD TIME customer requested lead time % CRD's matched excess lead time RESPONSIVENESS time to schedule an order © 1985, 2000 Arthur M. Schneiderman All Rights Reserved. 21 4/8/90 -04080 -3 rev 5/13/90
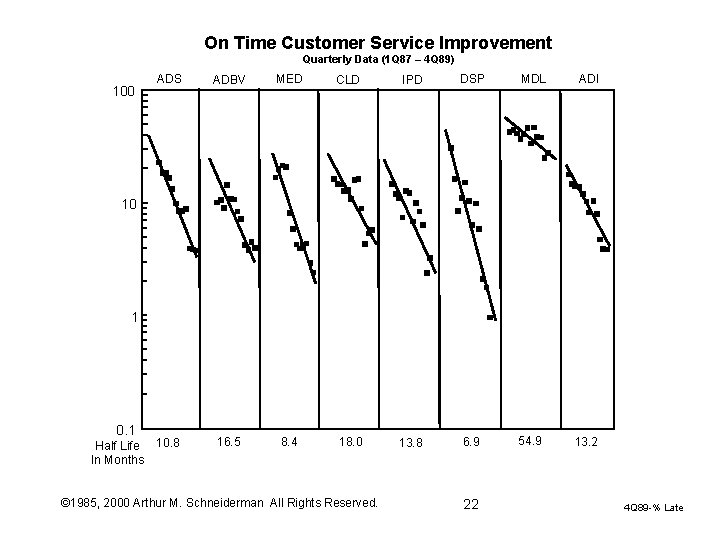
On Time Customer Service Improvement Quarterly Data (1 Q 87 – 4 Q 89) 100 ADS ADBV MED CLD IPD DSP MDL ADI 10. 8 16. 5 8. 4 18. 0 13. 8 6. 9 54. 9 13. 2 10 1 0. 1 Half Life In Months © 1985, 2000 Arthur M. Schneiderman All Rights Reserved. 22 4 Q 89 -% Late
CREDITS Elizabeth Derwin Jim Doscher Wally Francis Rich Lynch Ira Moskowitz Holley Murphy Art Schneiderman Pilot Executive Software © 1985, 2000 Arthur M. Schneiderman All Rights Reserved. 23 5/22/90 -05220 -2
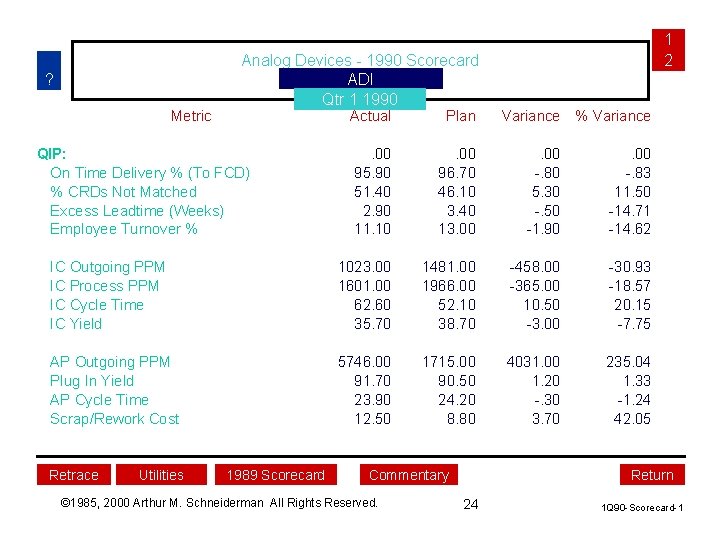
? Metric Analog Devices - 1990 Scorecard ADI Qtr 1 1990 1 2 Actual Plan . 00 95. 90 51. 40 2. 90 11. 10 . 00 96. 70 46. 10 3. 40 13. 00 -. 80 5. 30 -. 50 -1. 90 . 00 -. 83 11. 50 -14. 71 -14. 62 IC Outgoing PPM IC Process PPM IC Cycle Time IC Yield 1023. 00 1601. 00 62. 60 35. 70 1481. 00 1966. 00 52. 10 38. 70 -458. 00 -365. 00 10. 50 -3. 00 -30. 93 -18. 57 20. 15 -7. 75 AP Outgoing PPM Plug In Yield AP Cycle Time Scrap/Rework Cost 5746. 00 91. 70 23. 90 12. 50 1715. 00 90. 50 24. 20 8. 80 4031. 00 1. 20 -. 30 3. 70 235. 04 1. 33 -1. 24 42. 05 QIP: On Time Delivery % (To FCD) % CRDs Not Matched Excess Leadtime (Weeks) Employee Turnover % Retrace Utilities 1989 Scorecard Commentary © 1985, 2000 Arthur M. Schneiderman All Rights Reserved. Variance % Variance Return 24 1 Q 90 -Scorecard-1
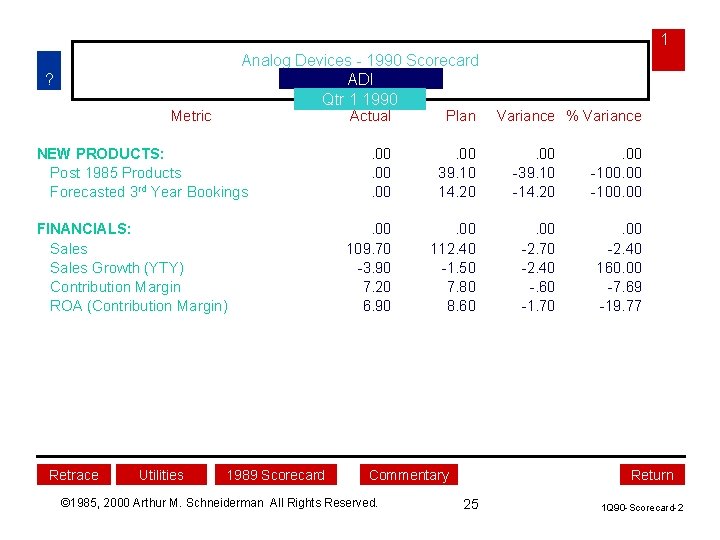
1 Analog Devices - 1990 Scorecard ADI Qtr 1 1990 ? Metric NEW PRODUCTS: Post 1985 Products Forecasted 3 rd Year Bookings FINANCIALS: Sales Growth (YTY) Contribution Margin ROA (Contribution Margin) Retrace Utilities 1989 Scorecard Actual Plan . 00. 00 39. 10 14. 20 . 00 -39. 10 -14. 20 . 00 -100. 00 109. 70 -3. 90 7. 20 6. 90 . 00 112. 40 -1. 50 7. 80 8. 60 . 00 -2. 70 -2. 40 -. 60 -1. 70 . 00 -2. 40 160. 00 -7. 69 -19. 77 Commentary © 1985, 2000 Arthur M. Schneiderman All Rights Reserved. Variance % Variance Return 25 1 Q 90 -Scorecard-2
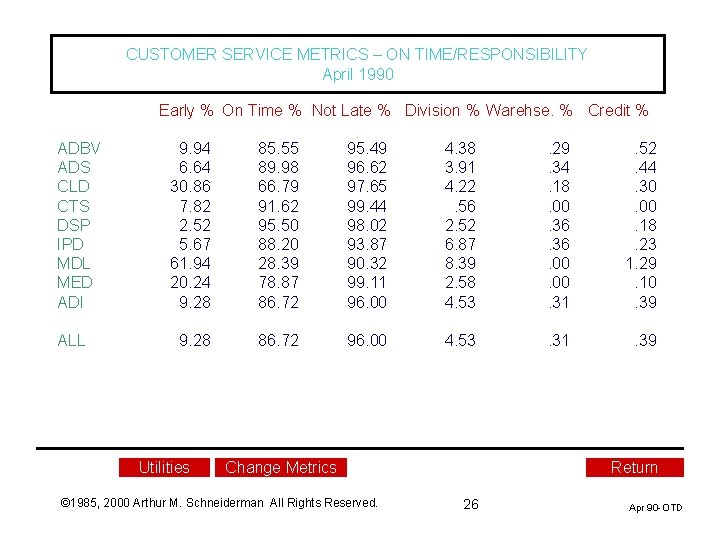
CUSTOMER SERVICE METRICS – ON TIME/RESPONSIBILITY April 1990 Early % On Time % Not Late % Division % Warehse. % Credit % ADBV ADS CLD CTS DSP IPD MDL MED ADI ALL 9. 94 6. 64 30. 86 7. 82 2. 52 5. 67 61. 94 20. 24 9. 28 85. 55 89. 98 66. 79 91. 62 95. 50 88. 20 28. 39 78. 87 86. 72 95. 49 96. 62 97. 65 99. 44 98. 02 93. 87 90. 32 99. 11 96. 00 4. 38 3. 91 4. 22. 56 2. 52 6. 87 8. 39 2. 58 4. 53 . 29. 34. 18. 00. 36. 00. 31 . 52. 44. 30. 00. 18. 23 1. 29. 10. 39 9. 28 86. 72 96. 00 4. 53 . 31 . 39 Utilities Change Metrics © 1985, 2000 Arthur M. Schneiderman All Rights Reserved. Return 26 Apr 90 -OTD
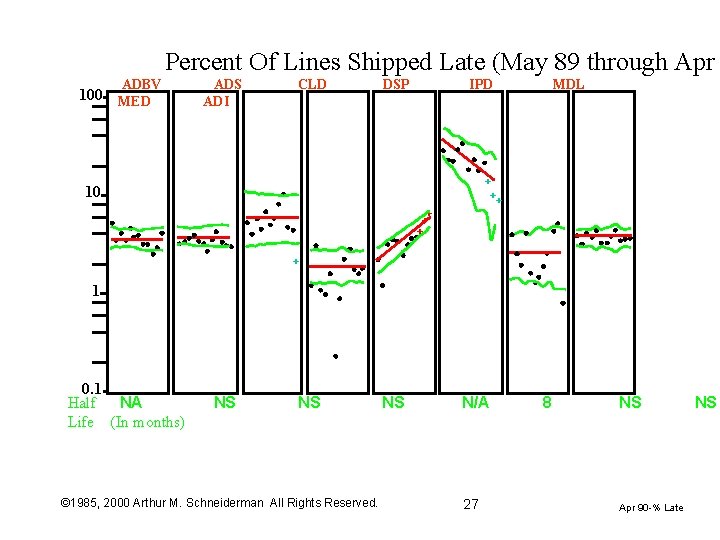
Percent Of Lines Shipped Late (May 89 through Apr ADBV 100 MED ADS ADI CLD DSP IPD MDL + ++ 10 + + 1 0. 1 Half NA Life (In months) NS NS © 1985, 2000 Arthur M. Schneiderman All Rights Reserved. NS N/A 27 8 NS Apr 90 -% Late NS
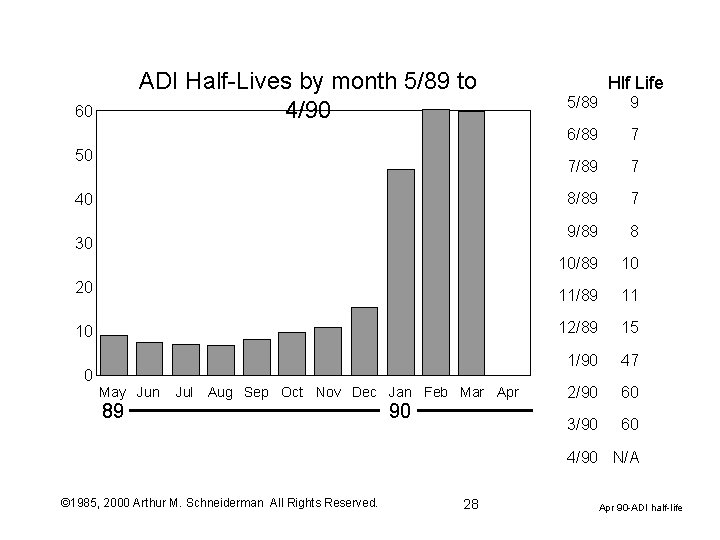
ADI Half-Lives by month 5/89 to 4/90 60 50 40 30 20 10 0 May Jun Jul Aug Sep Oct Nov Dec Jan Feb Mar Apr 89 90 5/89 Hlf Life 9 6/89 7 7/89 7 8/89 7 9/89 8 10/89 10 11/89 11 12/89 15 1/90 47 2/90 60 3/90 60 4/90 N/A © 1985, 2000 Arthur M. Schneiderman All Rights Reserved. 28 Apr 90 -ADI half-life
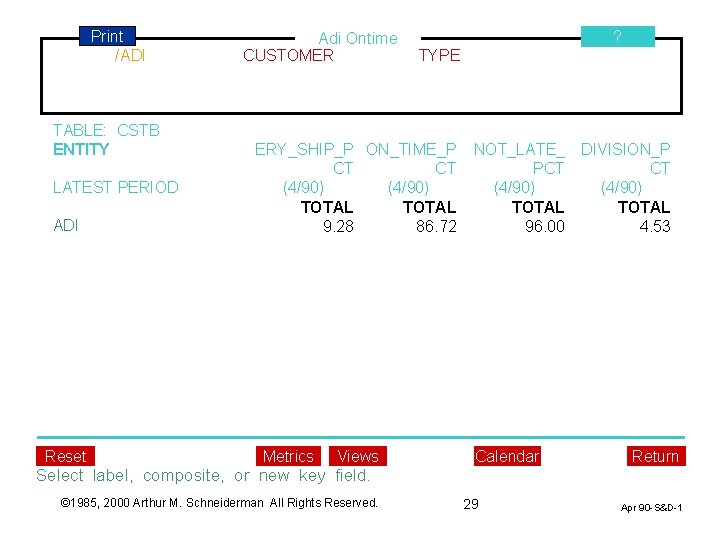
Print /ADI TABLE: CSTB ENTITY LATEST PERIOD ADI Reset Adi Ontime CUSTOMER ? TYPE ERY_SHIP_P ON_TIME_P CT CT (4/90) TOTAL 9. 28 86. 72 Metrics Views Select label, composite, or new key field. © 1985, 2000 Arthur M. Schneiderman All Rights Reserved. NOT_LATE_ PCT (4/90) TOTAL 96. 00 Calendar 29 DIVISION_P CT (4/90) TOTAL 4. 53 Return Apr 90 -S&D-1
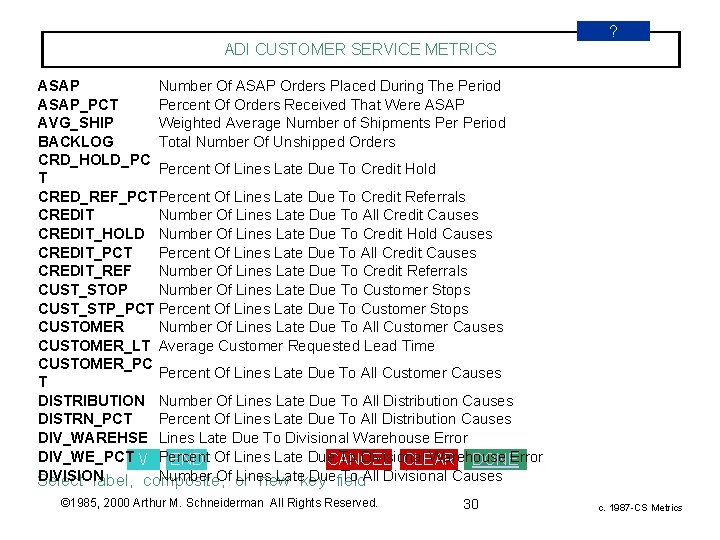
? ADI CUSTOMER SERVICE METRICS ASAP Number Of ASAP Orders Placed During The Period ASAP_PCT Percent Of Orders Received That Were ASAP AVG_SHIP Weighted Average Number of Shipments Period BACKLOG Total Number Of Unshipped Orders CRD_HOLD_PC Percent Of Lines Late Due To Credit Hold T CRED_REF_PCTPercent Of Lines Late Due To Credit Referrals CREDIT Number Of Lines Late Due To All Credit Causes CREDIT_HOLD Number Of Lines Late Due To Credit Hold Causes CREDIT_PCT Percent Of Lines Late Due To All Credit Causes CREDIT_REF Number Of Lines Late Due To Credit Referrals CUST_STOP Number Of Lines Late Due To Customer Stops CUST_STP_PCT Percent Of Lines Late Due To Customer Stops CUSTOMER Number Of Lines Late Due To All Customer Causes CUSTOMER_LT Average Customer Requested Lead Time CUSTOMER_PC Percent Of Lines Late Due To All Customer Causes T DISTRIBUTION Number Of Lines Late Due To All Distribution Causes DISTRN_PCT Percent Of Lines Late Due To All Distribution Causes DIV_WAREHSE Lines Late Due To Divisional Warehouse Error DIV_WE_PCT / Percent To Divisional Warehouse Error END Of Lines Late Due CANCEL CLEAR DONE DIVISION Number Of or Lines Latekey Duefield To All Divisional Causes Select label, composite, new © 1985, 2000 Arthur M. Schneiderman All Rights Reserved. 30 c. 1987 -CS Metrics
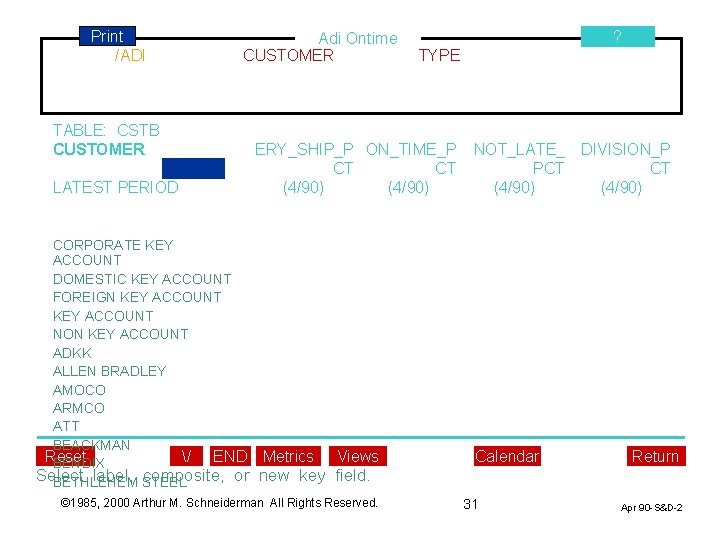
Print /ADI TABLE: CSTB CUSTOMER LATEST PERIOD Finished Adi Ontime CUSTOMER ? TYPE ERY_SHIP_P ON_TIME_P CT CT (4/90) CORPORATE KEY ACCOUNT DOMESTIC KEY ACCOUNT FOREIGN KEY ACCOUNT NON KEY ACCOUNT ADKK ALLEN BRADLEY AMOCO ARMCO ATT BEACKMAN / END Metrics Views Reset BENDIX Select label, STEEL composite, or new key field. BETHLEHEM © 1985, 2000 Arthur M. Schneiderman All Rights Reserved. NOT_LATE_ PCT (4/90) Calendar 31 DIVISION_P CT (4/90) Return Apr 90 -S&D-2
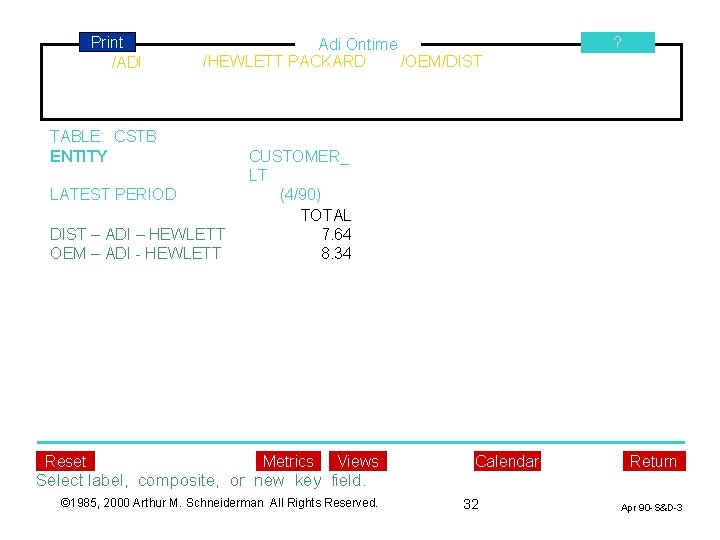
Print /ADI Adi Ontime /OEM/DIST /HEWLETT PACKARD TABLE: CSTB ENTITY LATEST PERIOD DIST – ADI – HEWLETT OEM – ADI - HEWLETT Reset ? CUSTOMER_ LT (4/90) TOTAL 7. 64 8. 34 Metrics Views Select label, composite, or new key field. © 1985, 2000 Arthur M. Schneiderman All Rights Reserved. Calendar 32 Return Apr 90 -S&D-3
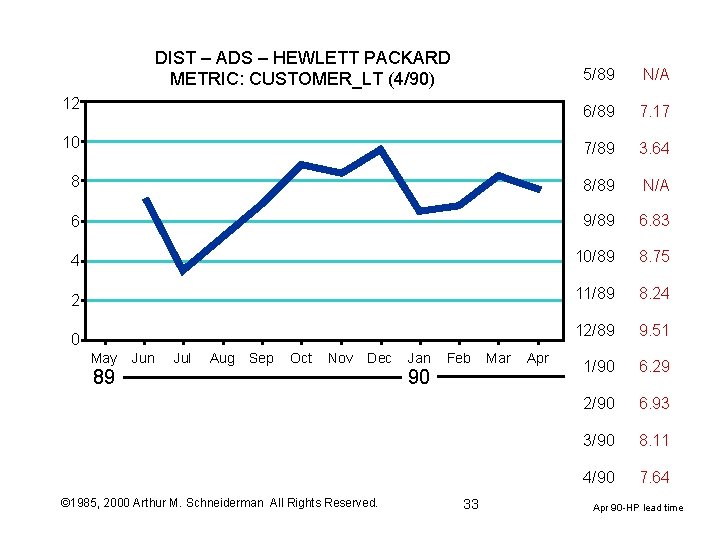
DIST – ADS – HEWLETT PACKARD METRIC: CUSTOMER_LT (4/90) 5/89 N/A 6/89 7. 17 10 7/89 3. 64 8 8/89 N/A 6 9/89 6. 83 4 10/89 8. 75 2 11/89 8. 24 12/89 9. 51 1/90 6. 29 2/90 6. 93 3/90 8. 11 4/90 7. 64 12 0 May Jun Jul Aug Sep Oct Nov Dec 89 © 1985, 2000 Arthur M. Schneiderman All Rights Reserved. Jan Feb 90 33 Mar Apr 90 -HP lead time
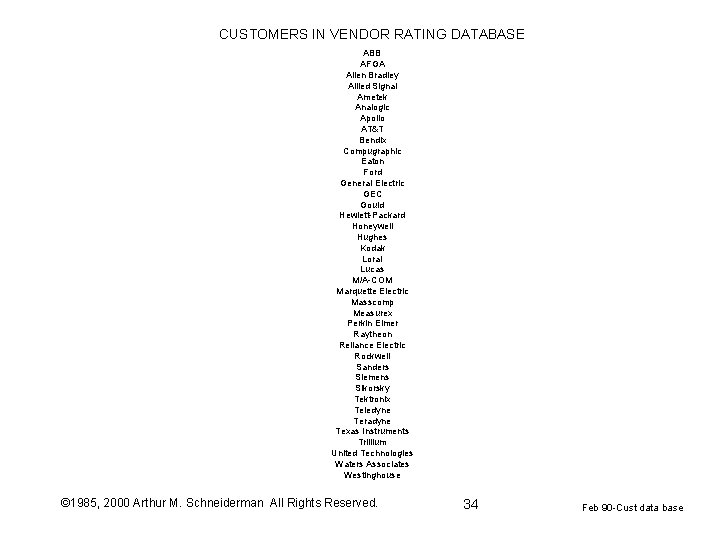
CUSTOMERS IN VENDOR RATING DATABASE ABB AFGA Allen Bradley Allied Signal Ametek Analogic Apollo AT&T Bendix Compugraphic Eaton Ford General Electric GEC Gould Hewlett-Packard Honeywell Hughes Kodak Loral Lucas M/A-COM Marquette Electric Masscomp Measurex Perkin Elmer Raytheon Reliance Electric Rockwell Sanders Siemens Sikorsky Tektronix Teledyne Teradyne Texas Instruments Trillium United Technologies Waters Associates Westinghouse © 1985, 2000 Arthur M. Schneiderman All Rights Reserved. 34 Feb 90 -Cust data base
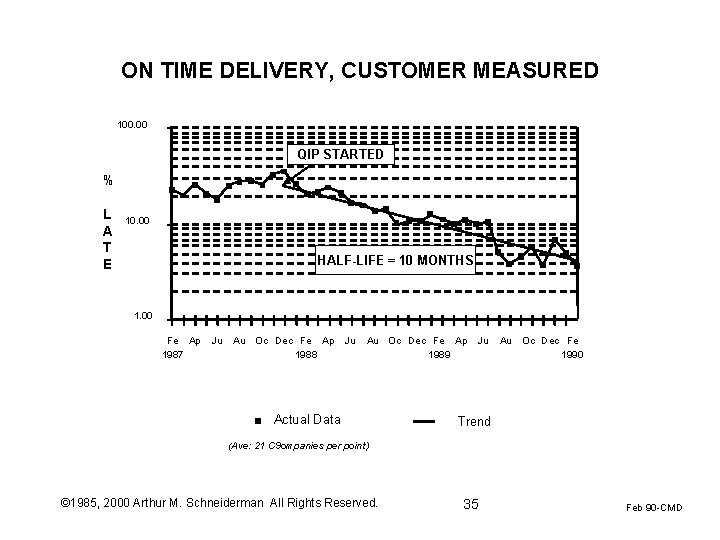
ON TIME DELIVERY, CUSTOMER MEASURED 100. 00 QIP STARTED % L A T E 10. 00 HALF-LIFE = 10 MONTHS 1. 00 Fe Ap 1987 Ju Au Oc Dec Fe Ap 1988 Ju Au Oc Dec Fe Ap 1989 Actual Data Ju Au Oc Dec Fe 1990 Trend (Ave: 21 C 9 ompanies per point) © 1985, 2000 Arthur M. Schneiderman All Rights Reserved. 35 Feb 90 -CMD
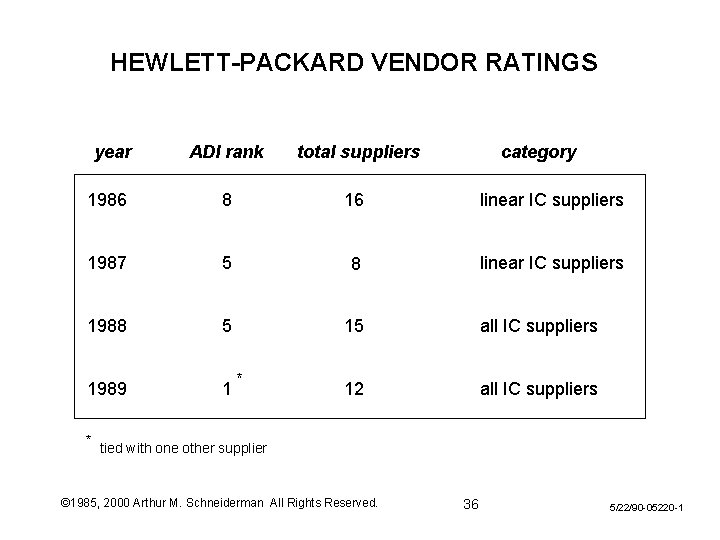
HEWLETT-PACKARD VENDOR RATINGS year ADI rank total suppliers 1986 8 16 linear IC suppliers 1987 5 8 linear IC suppliers 1988 5 15 all IC suppliers 1989 1 12 all IC suppliers * * category tied with one other supplier © 1985, 2000 Arthur M. Schneiderman All Rights Reserved. 36 5/22/90 -05220 -1
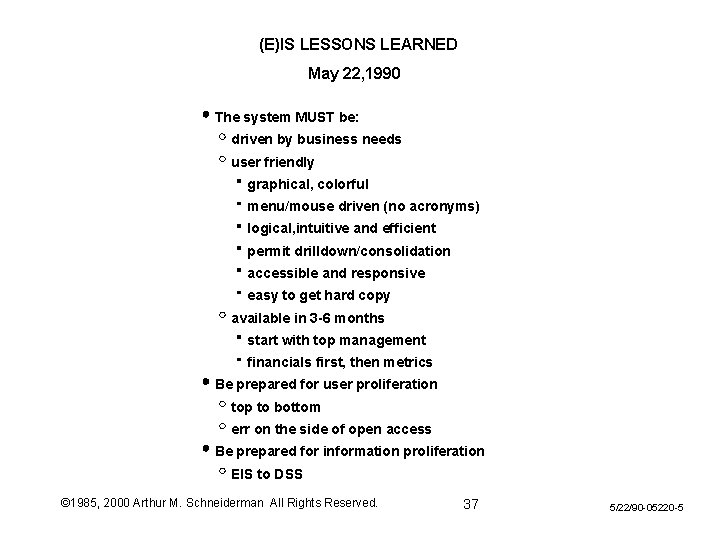
(E)IS LESSONS LEARNED May 22, 1990 The system MUST be: driven by business needs user friendly graphical, colorful menu/mouse driven (no acronyms) logical, intuitive and efficient permit drilldown/consolidation accessible and responsive easy to get hard copy available in 3 -6 months start with top management financials first, then metrics Be prepared for user proliferation top to bottom err on the side of open access Be prepared for information proliferation EIS to DSS © 1985, 2000 Arthur M. Schneiderman All Rights Reserved. 37 5/22/90 -05220 -5
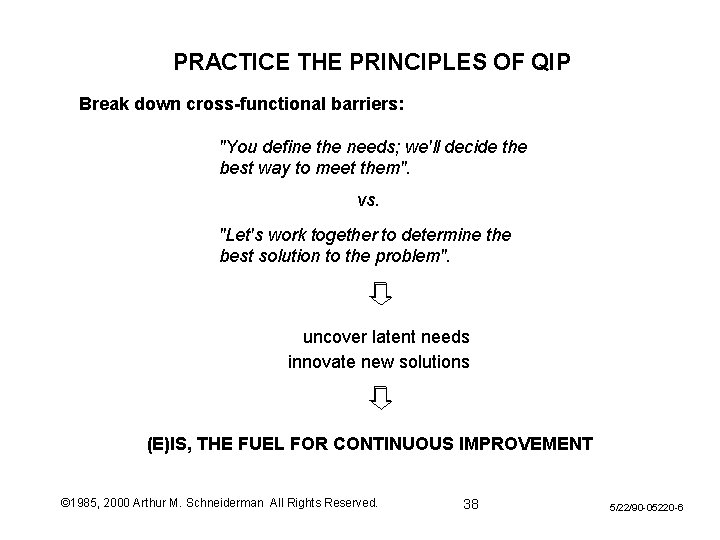
PRACTICE THE PRINCIPLES OF QIP Break down cross-functional barriers: "You define the needs; we'll decide the best way to meet them". vs. "Let's work together to determine the best solution to the problem". uncover latent needs innovate new solutions (E)IS, THE FUEL FOR CONTINUOUS IMPROVEMENT © 1985, 2000 Arthur M. Schneiderman All Rights Reserved. 38 5/22/90 -05220 -6