TOTAL QUALITY MANAGEMENT Art Schneiderman Analog Devices ANALOG
- Slides: 43
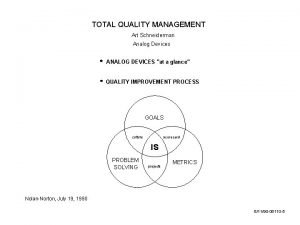
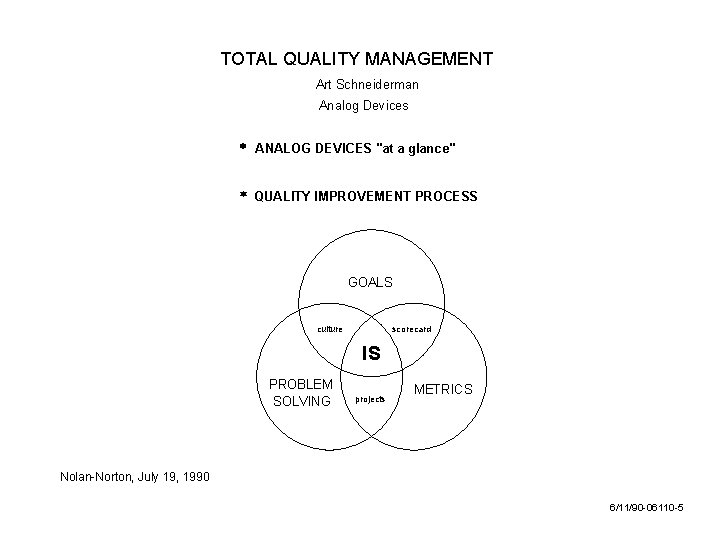
TOTAL QUALITY MANAGEMENT Art Schneiderman Analog Devices ANALOG DEVICES "at a glance" QUALITY IMPROVEMENT PROCESS GOALS culture scorecard IS PROBLEM SOLVING projects METRICS Nolan-Norton, July 19, 1990 6/11/90 -06110 -5
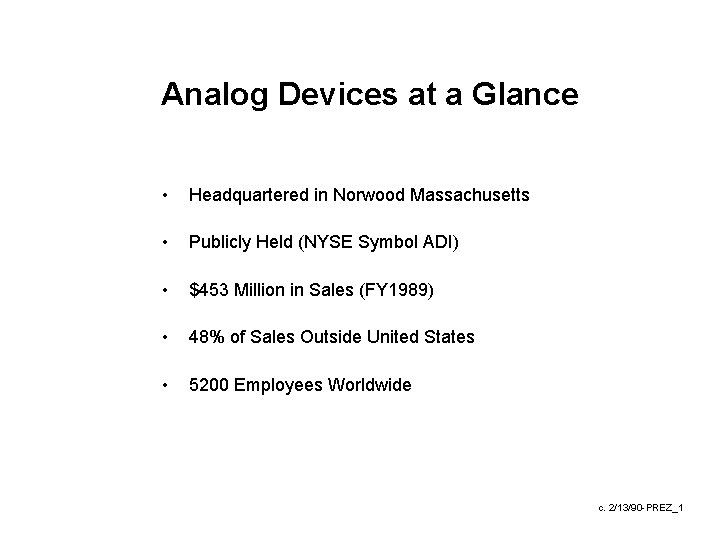
Analog Devices at a Glance • Headquartered in Norwood Massachusetts • Publicly Held (NYSE Symbol ADI) • $453 Million in Sales (FY 1989) • 48% of Sales Outside United States • 5200 Employees Worldwide c. 2/13/90 -PREZ_1
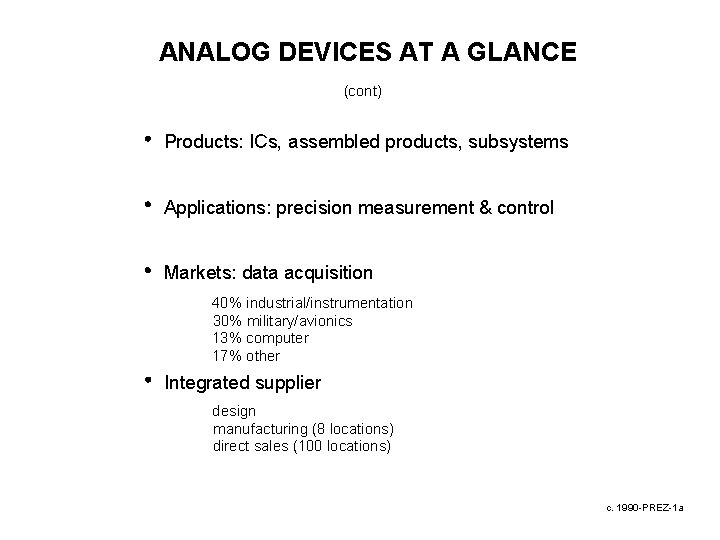
ANALOG DEVICES AT A GLANCE (cont) Products: ICs, assembled products, subsystems Applications: precision measurement & control Markets: data acquisition 40% industrial/instrumentation 30% military/avionics 13% computer 17% other Integrated supplier design manufacturing (8 locations) direct sales (100 locations) c. 1990 -PREZ-1 a
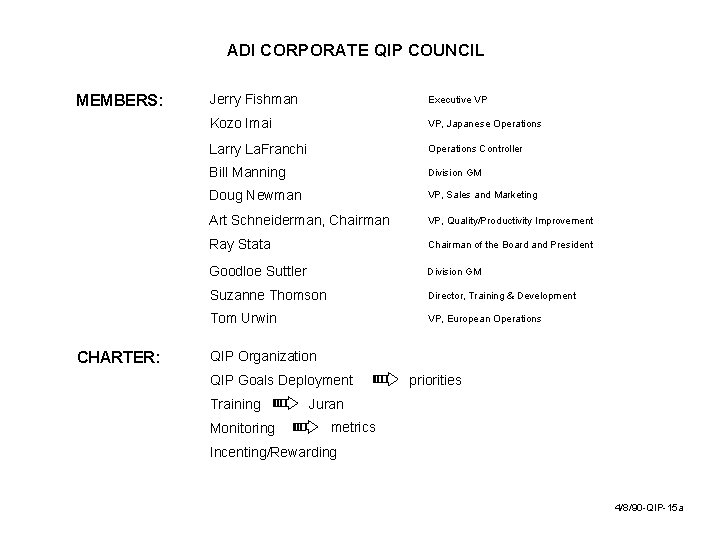
ADI CORPORATE QIP COUNCIL MEMBERS: CHARTER: Jerry Fishman Executive VP Kozo Imai VP, Japanese Operations Larry La. Franchi Operations Controller Bill Manning Division GM Doug Newman VP, Sales and Marketing Art Schneiderman, Chairman VP, Quality/Productivity Improvement Ray Stata Chairman of the Board and President Goodloe Suttler Division GM Suzanne Thomson Director, Training & Development Tom Urwin VP, European Operations QIP Organization QIP Goals Deployment Training Monitoring priorities Juran metrics Incenting/Rewarding 4/8/90 -QIP-15 a
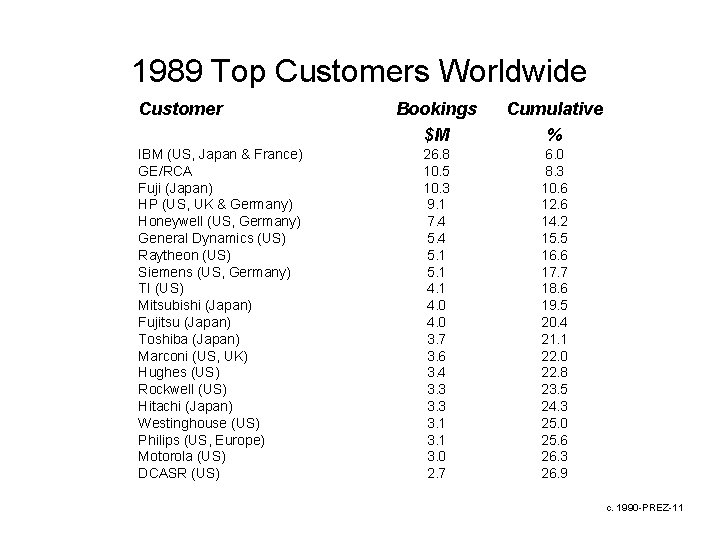
1989 Top Customers Worldwide Customer IBM (US, Japan & France) GE/RCA Fuji (Japan) HP (US, UK & Germany) Honeywell (US, Germany) General Dynamics (US) Raytheon (US) Siemens (US, Germany) TI (US) Mitsubishi (Japan) Fujitsu (Japan) Toshiba (Japan) Marconi (US, UK) Hughes (US) Rockwell (US) Hitachi (Japan) Westinghouse (US) Philips (US, Europe) Motorola (US) DCASR (US) Bookings $M Cumulative % 26. 8 10. 5 10. 3 9. 1 7. 4 5. 1 4. 0 3. 7 3. 6 3. 4 3. 3 3. 1 3. 0 2. 7 6. 0 8. 3 10. 6 12. 6 14. 2 15. 5 16. 6 17. 7 18. 6 19. 5 20. 4 21. 1 22. 0 22. 8 23. 5 24. 3 25. 0 25. 6 26. 3 26. 9 c. 1990 -PREZ-11
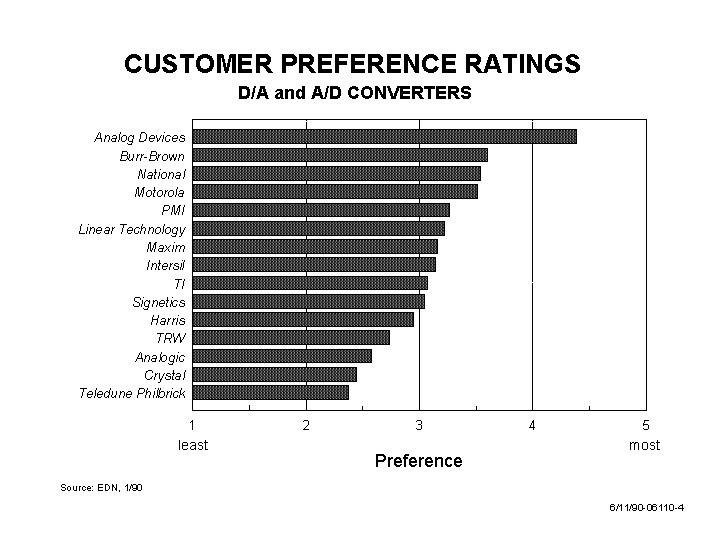
CUSTOMER PREFERENCE RATINGS D/A and A/D CONVERTERS Analog Devices Burr-Brown National Motorola PMI Linear Technology Maxim Intersil TI Signetics Harris TRW Analogic Crystal Teledune Philbrick 1 least 2 3 Preference 4 5 most Source: EDN, 1/90 6/11/90 -06110 -4
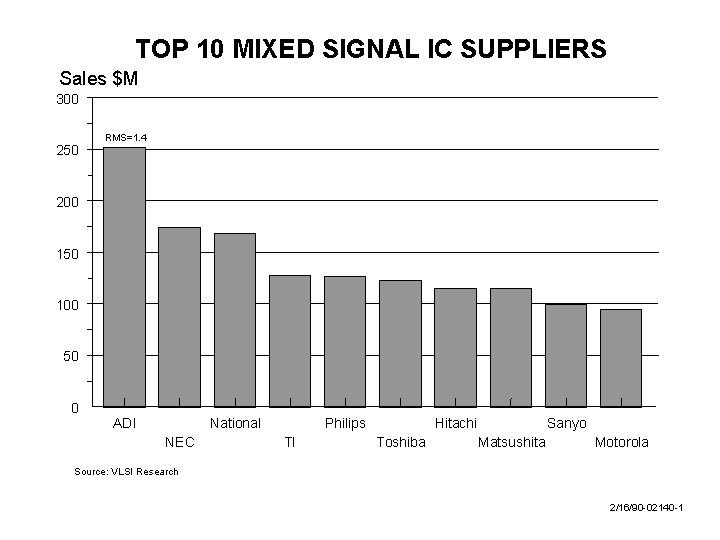
TOP 10 MIXED SIGNAL IC SUPPLIERS Sales $M 300 250 RMS=1. 4 200 150 100 50 0 ADI National NEC Philips TI Hitachi Toshiba Sanyo Matsushita Motorola Source: VLSI Research 2/16/90 -02140 -1
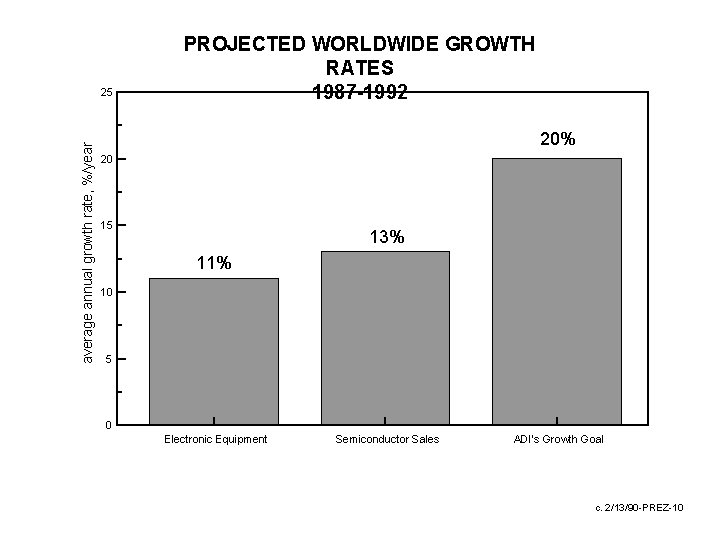
average annual growth rate, %/year 25 PROJECTED WORLDWIDE GROWTH RATES 1987 -1992 20% 20 15 13% 11% 10 5 0 Electronic Equipment Semiconductor Sales ADI's Growth Goal c. 2/13/90 -PREZ-10
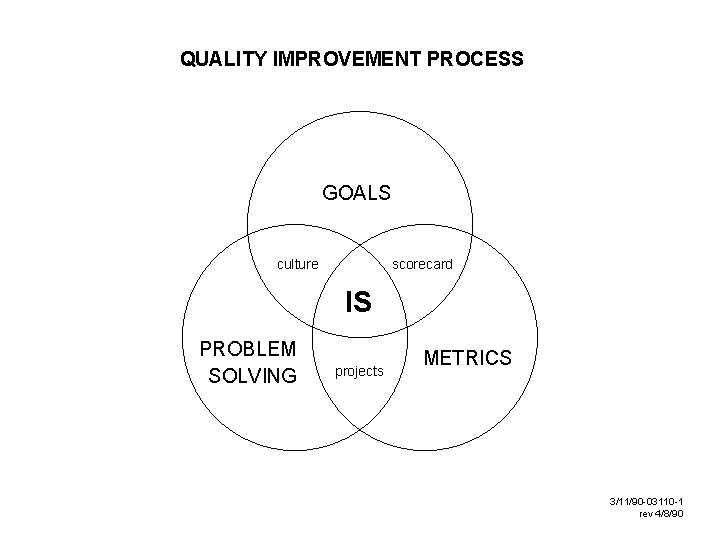
QUALITY IMPROVEMENT PROCESS GOALS culture scorecard IS PROBLEM SOLVING projects METRICS 3/11/90 -03110 -1 rev 4/8/90
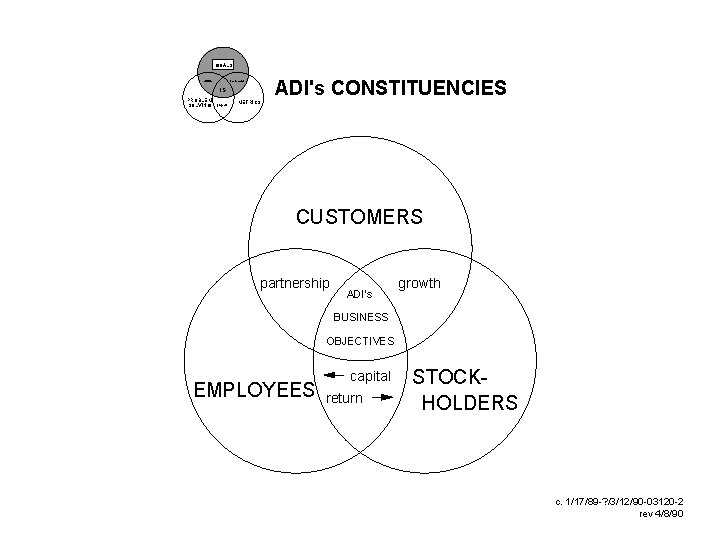
GOALS culture ADI's CONSTITUENCIES scorecard IS PROBLEM SOLVING projects METRICS CUSTOMERS partnership ADI's growth BUSINESS OBJECTIVES EMPLOYEES capital return STOCKHOLDERS c. 1/17/89 -? /3/12/90 -03120 -2 rev 4/8/90
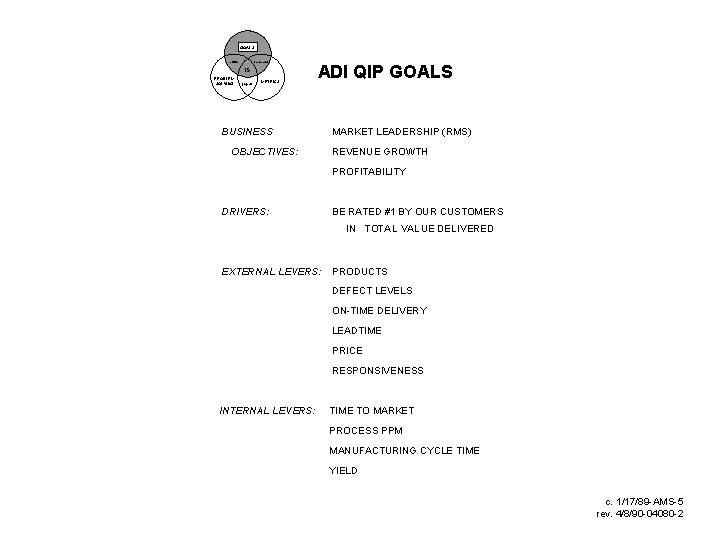
GOALS culture scorecard IS PROBLEM SOLVING projects METRICS BUSINESS OBJECTIVES: ADI QIP GOALS MARKET LEADERSHIP (RMS) REVENUE GROWTH PROFITABILITY DRIVERS: BE RATED #1 BY OUR CUSTOMERS IN TOTAL VALUE DELIVERED EXTERNAL LEVERS: PRODUCTS DEFECT LEVELS ON-TIME DELIVERY LEADTIME PRICE RESPONSIVENESS INTERNAL LEVERS: TIME TO MARKET PROCESS PPM MANUFACTURING CYCLE TIME YIELD c. 1/17/89 -AMS-5 rev. 4/8/90 -04080 -2
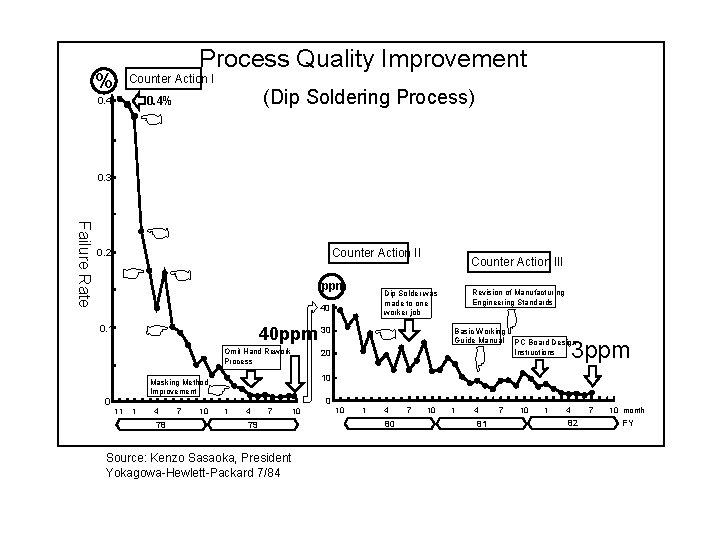
Process Quality Improvement % Counter Action I (Dip Soldering Process) 0. 4% 0. 4 0. 3 Failure Rate Counter Action II 0. 2 ppm 40 ppm 30 Omit Hand Rework Process 0 1 4 78 7 10 Basic Working Guide Manual 20 3 ppm PC Board Design Instructions 10 Masking Method Improvement 11 Revision of Manufacturing Engineering Standards Dip Solder was made to one worker job 40 0. 1 Counter Action III 0 1 4 7 79 Source: Kenzo Sasaoka, President Yokagowa-Hewlett-Packard 7/84 10 10 1 4 80 7 10 1 4 81 7 10 1 4 82 7 10 month FY
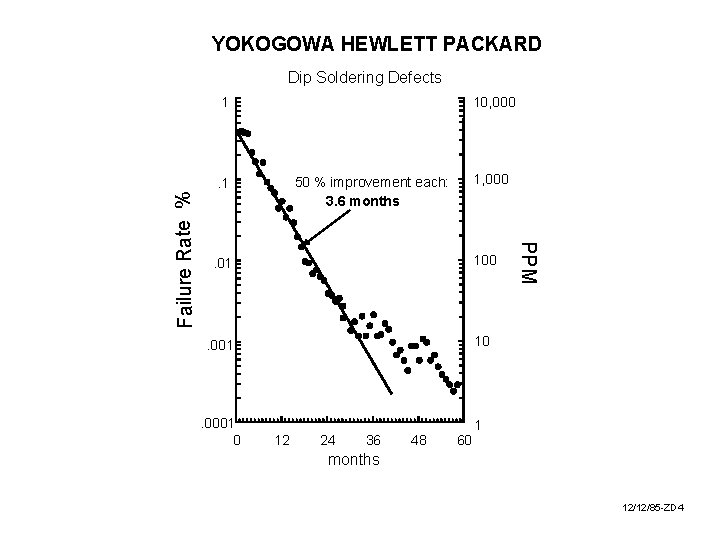
YOKOGOWA HEWLETT PACKARD Dip Soldering Defects 10, 000 1 . 01 100 . 001 10 . 0001 0 12 24 36 48 60 PPM Failure Rate % 1, 000 50 % improvement each: 3. 6 months . 1 1 months 12/12/85 -ZD 4
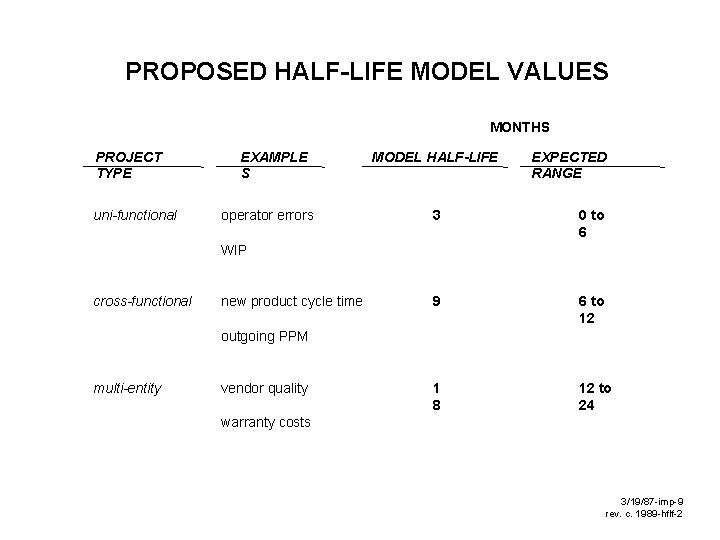
PROPOSED HALF-LIFE MODEL VALUES MONTHS PROJECT TYPE uni-functional EXAMPLE S operator errors MODEL HALF-LIFE EXPECTED RANGE 3 0 to 6 9 6 to 12 1 8 12 to 24 WIP cross-functional new product cycle time outgoing PPM multi-entity vendor quality warranty costs 3/19/87 -imp-9 rev. c. 1989 -hflf-2
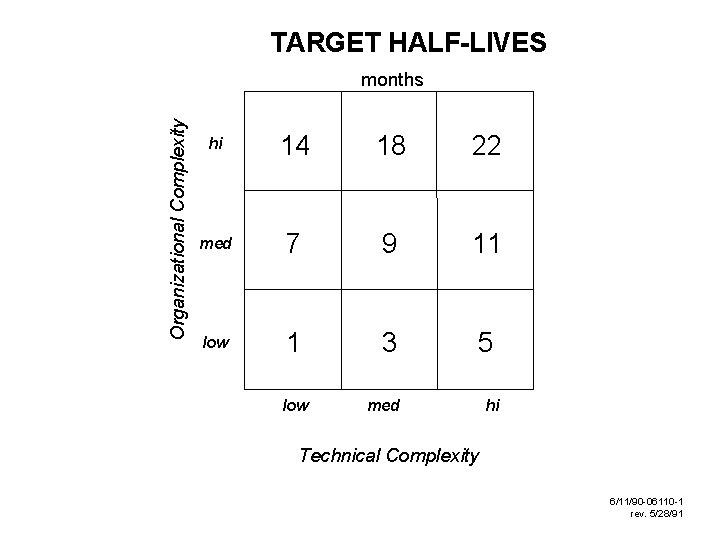
TARGET HALF-LIVES Organizational Complexity months hi 14 18 22 med 7 9 11 low 1 3 5 low med hi Technical Complexity 6/11/90 -06110 -1 rev. 5/28/91
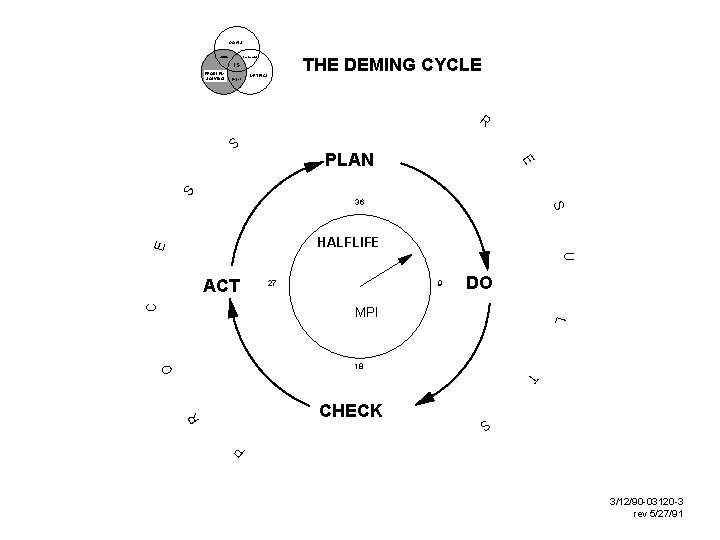
GOALS culture scorecard IS PROBLEM SOLVING projects METRICS THE DEMING CYCLE R S S E PLAN S 36 U E HALFLIFE C ACT 27 9 DO L MPI O 18 T R S CHECK P 3/12/90 -03120 -3 rev 5/27/91
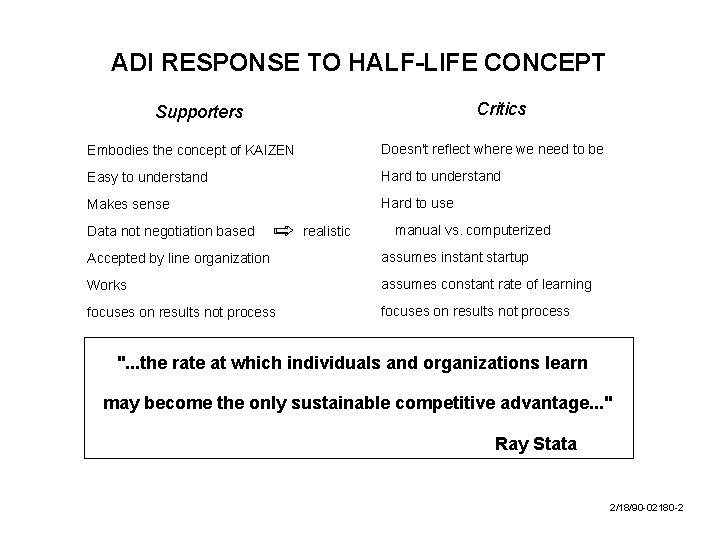
ADI RESPONSE TO HALF-LIFE CONCEPT Critics Supporters Embodies the concept of KAIZEN Doesn't reflect where we need to be Easy to understand Hard to understand Makes sense Hard to use Data not negotiation based realistic manual vs. computerized Accepted by line organization assumes instant startup Works assumes constant rate of learning focuses on results not process ". . . the rate at which individuals and organizations learn may become the only sustainable competitive advantage. . . " Ray Stata 2/18/90 -02180 -2
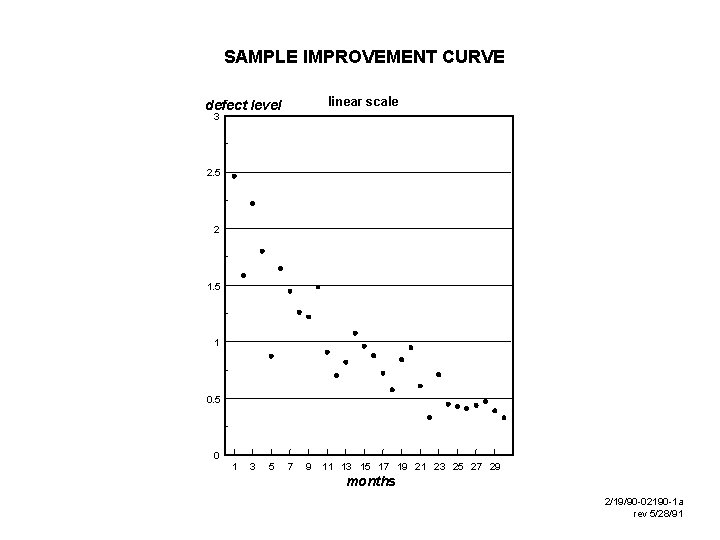
SAMPLE IMPROVEMENT CURVE linear scale defect level 3 2. 5 2 1. 5 1 0. 5 0 1 3 5 7 9 11 13 15 17 19 21 23 25 27 29 months 2/19/90 -02190 -1 a rev 5/28/91
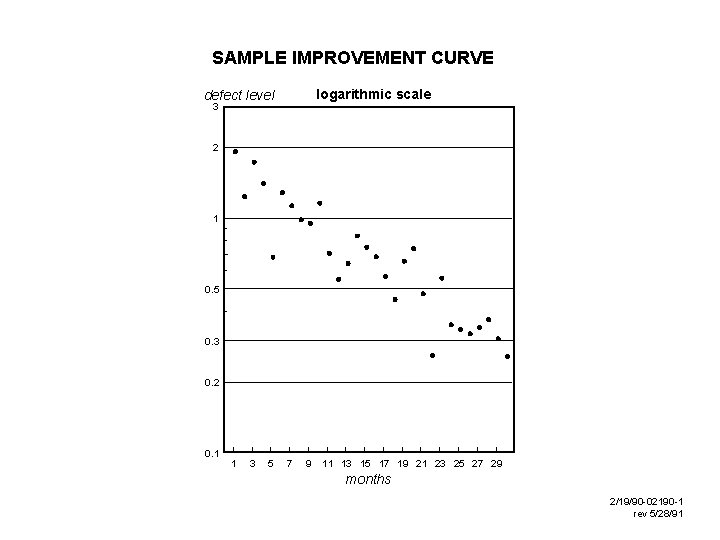
SAMPLE IMPROVEMENT CURVE logarithmic scale defect level 3 2 1 0. 5 0. 3 0. 2 0. 1 1 3 5 7 9 11 13 15 17 19 21 23 25 27 29 months 2/19/90 -02190 -1 rev 5/28/91
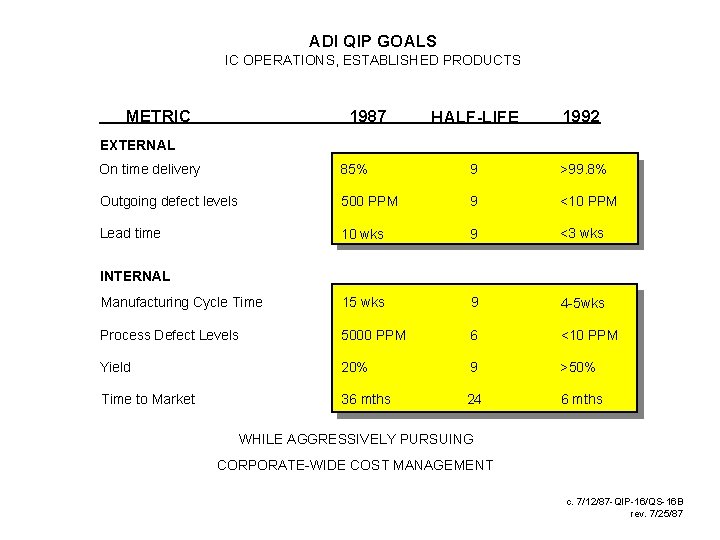
ADI QIP GOALS IC OPERATIONS, ESTABLISHED PRODUCTS METRIC 1987 HALF-LIFE 1992 EXTERNAL On time delivery 85% 9 >99. 8% Outgoing defect levels 500 PPM 9 <10 PPM Lead time 10 wks 9 <3 wks Manufacturing Cycle Time 15 wks 9 4 -5 wks Process Defect Levels 5000 PPM 6 <10 PPM Yield 20% 9 >50% Time to Market 36 mths 24 6 mths INTERNAL WHILE AGGRESSIVELY PURSUING CORPORATE-WIDE COST MANAGEMENT c. 7/12/87 -QIP-16/QS-16 B rev. 7/25/87
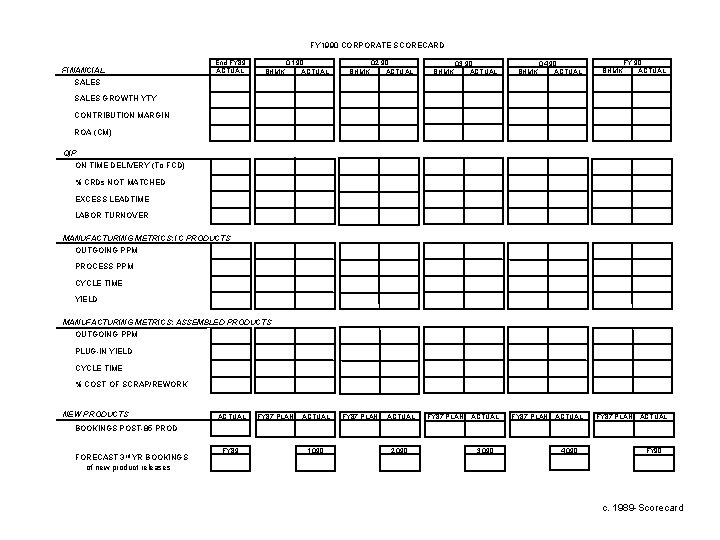
FY 1990 CORPORATE SCORECARD FINANCIAL End FY 89 ACTUAL BHMK Q 1 90 ACTUAL BHMK Q 2 90 ACTUAL BHMK Q 3 90 ACTUAL BHMK Q 4 90 ACTUAL BHMK FY 90 ACTUAL SALES GROWTH YTY CONTRIBUTION MARGIN ROA (CM) QIP ON TIME DELIVERY (To FCD) % CRDs NOT MATCHED EXCESS LEADTIME LABOR TURNOVER MANUFACTURING METRICS: IC PRODUCTS OUTGOING PPM PROCESS PPM CYCLE TIME YIELD MANUFACTURING METRICS: ASSEMBLED PRODUCTS OUTGOING PPM PLUG-IN YIELD CYCLE TIME % COST OF SCRAP/REWORK NEW PRODUCTS ACTUAL FY 87 PLAN ACTUAL FY 87 PLAN ACTUAL BOOKINGS POST-85 PROD FORECAST 3 rd YR BOOKINGS of new product releases FY 89 1 Q 90 2 Q 90 3 Q 90 4 Q 90 FY 90 c. 1989 -Scorecard
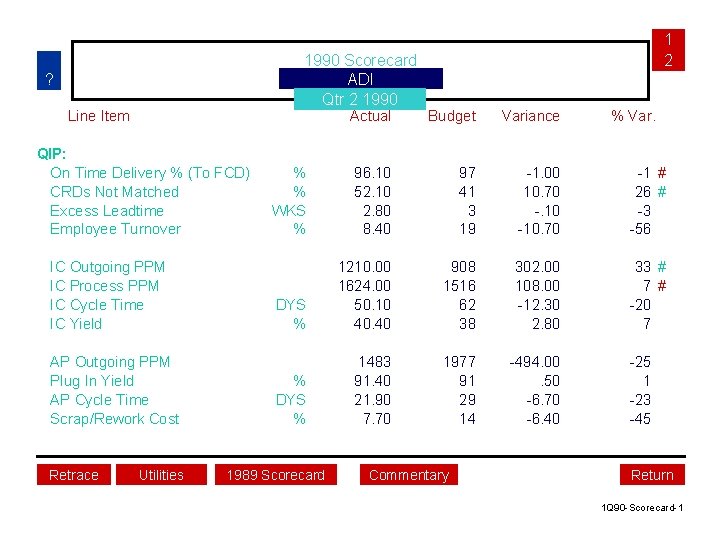
1990 Scorecard ADI Qtr 2 1990 ? Line Item QIP: On Time Delivery % (To FCD) CRDs Not Matched Excess Leadtime Employee Turnover IC Outgoing PPM IC Process PPM IC Cycle Time IC Yield AP Outgoing PPM Plug In Yield AP Cycle Time Scrap/Rework Cost Retrace Utilities 1 2 Actual Budget Variance % % WKS % 96. 10 52. 10 2. 80 8. 40 97 41 3 19 -1. 00 10. 70 -. 10 -10. 70 -1 # 26 # -3 -56 DYS % 1210. 00 1624. 00 50. 10 40. 40 908 1516 62 38 302. 00 108. 00 -12. 30 2. 80 33 # 7# -20 7 % DYS % 1483 91. 40 21. 90 7. 70 1977 91 29 14 -494. 00. 50 -6. 70 -6. 40 1989 Scorecard Commentary % Var. -25 1 -23 -45 Return 1 Q 90 -Scorecard-1
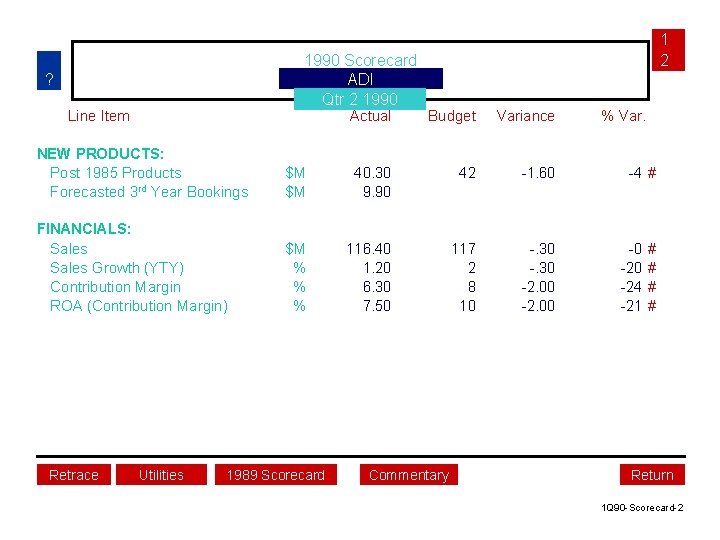
1990 Scorecard ADI Qtr 2 1990 ? Line Item 1 2 Actual Budget Variance NEW PRODUCTS: Post 1985 Products Forecasted 3 rd Year Bookings $M $M 40. 30 9. 90 42 -1. 60 FINANCIALS: Sales Growth (YTY) Contribution Margin ROA (Contribution Margin) $M % % % 116. 40 1. 20 6. 30 7. 50 117 2 8 10 -. 30 -2. 00 Retrace Utilities 1989 Scorecard Commentary % Var. -4 # -0 -24 -21 # # Return 1 Q 90 -Scorecard-2
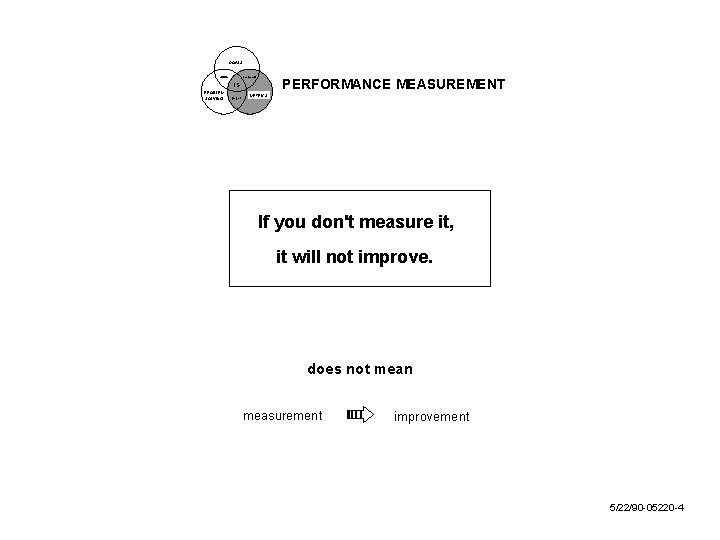
GOALS culture scorecard PERFORMANCE MEASUREMENT IS PROBLEM SOLVING projects METRICS If you don't measure it, it will not improve. does not mean measurement improvement 5/22/90 -05220 -4
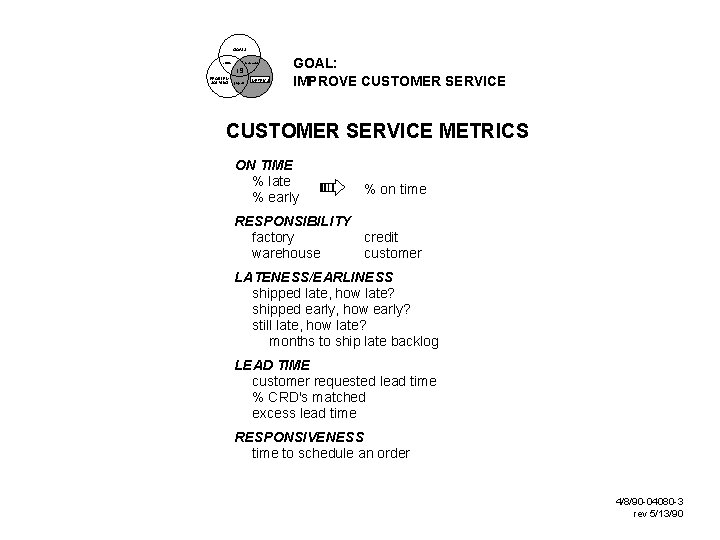
GOALS culture scorecard IS PROBLEM SOLVING projects METRICS GOAL: IMPROVE CUSTOMER SERVICE METRICS ON TIME % late % early % on time RESPONSIBILITY factory credit warehouse customer LATENESS/EARLINESS shipped late, how late? shipped early, how early? still late, how late? months to ship late backlog LEAD TIME customer requested lead time % CRD's matched excess lead time RESPONSIVENESS time to schedule an order 4/8/90 -04080 -3 rev 5/13/90
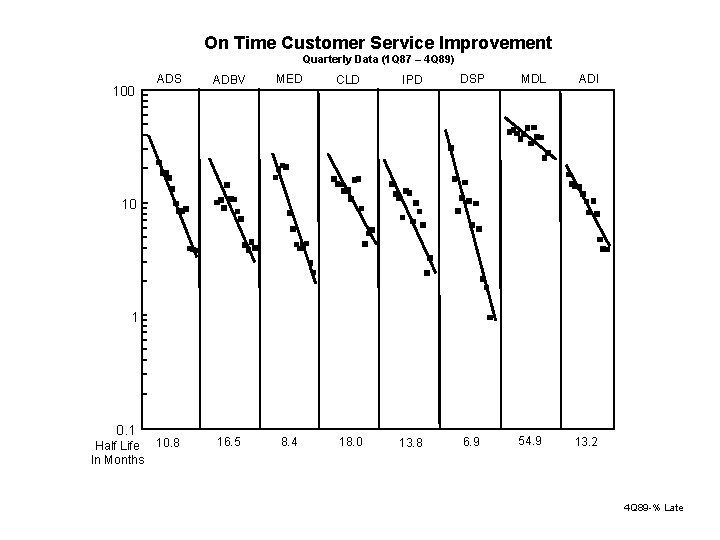
On Time Customer Service Improvement Quarterly Data (1 Q 87 – 4 Q 89) 100 ADS ADBV MED CLD IPD DSP MDL ADI 10. 8 16. 5 8. 4 18. 0 13. 8 6. 9 54. 9 13. 2 10 1 0. 1 Half Life In Months 4 Q 89 -% Late
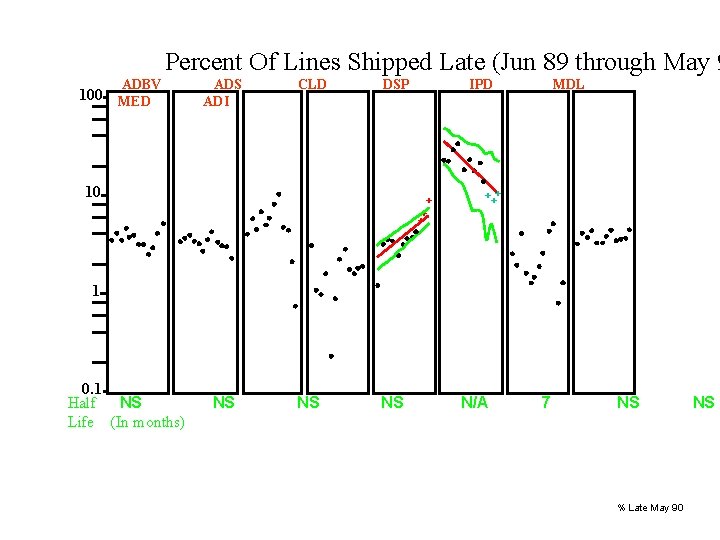
Percent Of Lines Shipped Late (Jun 89 through May 9 ADBV 100 MED ADS ADI CLD DSP 10 IPD + + + MDL +++ 1 0. 1 Half NS Life (In months) NS NS NS N/A 7 NS % Late May 90 NS
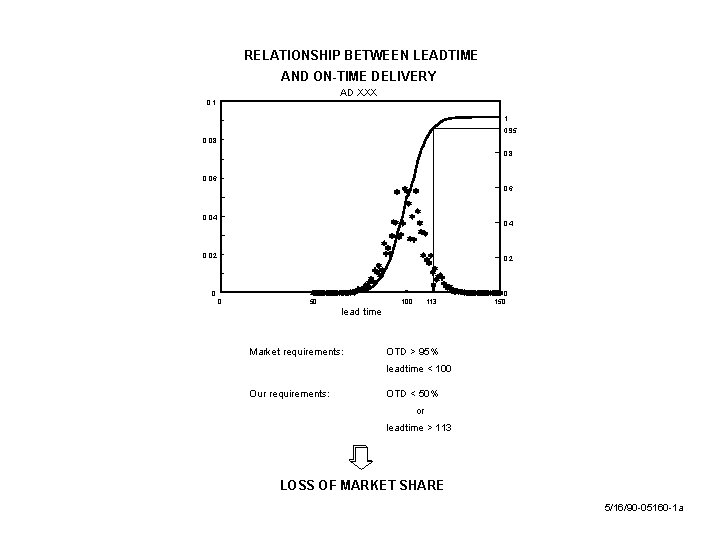
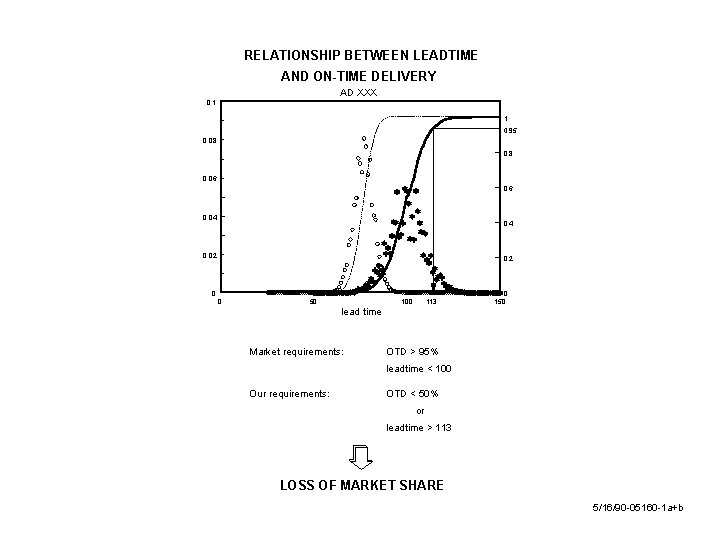
RELATIONSHIP BETWEEN LEADTIME AND ON-TIME DELIVERY AD XXX 0. 1 1 0. 95 0. 08 0. 06 0. 04 0. 02 0 0. 2 0 50 100 113 0 150 lead time Market requirements: OTD > 95% leadtime < 100 Our requirements: OTD < 50% or leadtime > 113 LOSS OF MARKET SHARE 5/16/90 -05160 -1 a
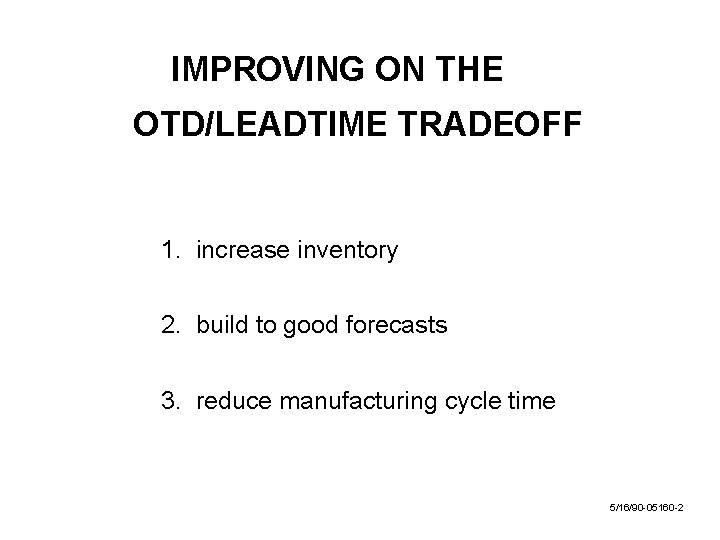
IMPROVING ON THE OTD/LEADTIME TRADEOFF 1. increase inventory 2. build to good forecasts 3. reduce manufacturing cycle time 5/16/90 -05160 -2
RELATIONSHIP BETWEEN LEADTIME AND ON-TIME DELIVERY AD XXX 0. 1 1 0. 95 0. 08 0. 06 0. 04 0. 02 0 0. 2 0 50 100 113 0 150 lead time Market requirements: OTD > 95% leadtime < 100 Our requirements: OTD < 50% or leadtime > 113 LOSS OF MARKET SHARE 5/16/90 -05160 -1 a+b
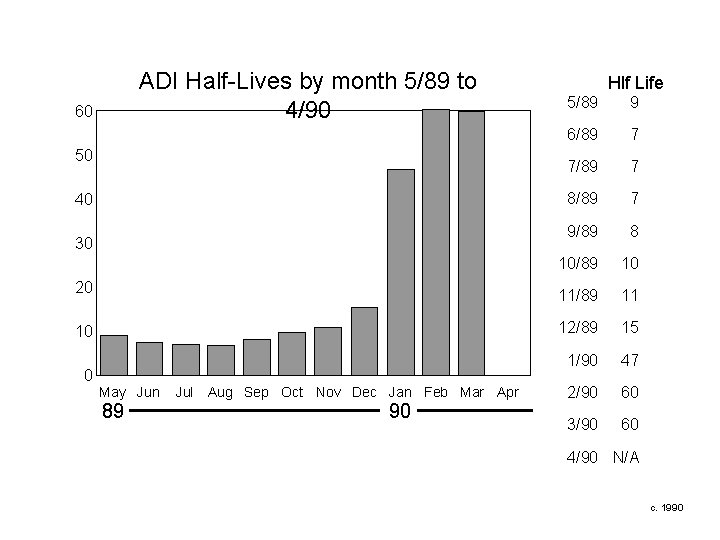
ADI Half-Lives by month 5/89 to 4/90 60 50 40 30 20 10 0 May Jun 89 Jul Aug Sep Oct Nov Dec Jan Feb Mar Apr 90 5/89 Hlf Life 9 6/89 7 7/89 7 8/89 7 9/89 8 10/89 10 11/89 11 12/89 15 1/90 47 2/90 60 3/90 60 4/90 N/A c. 1990
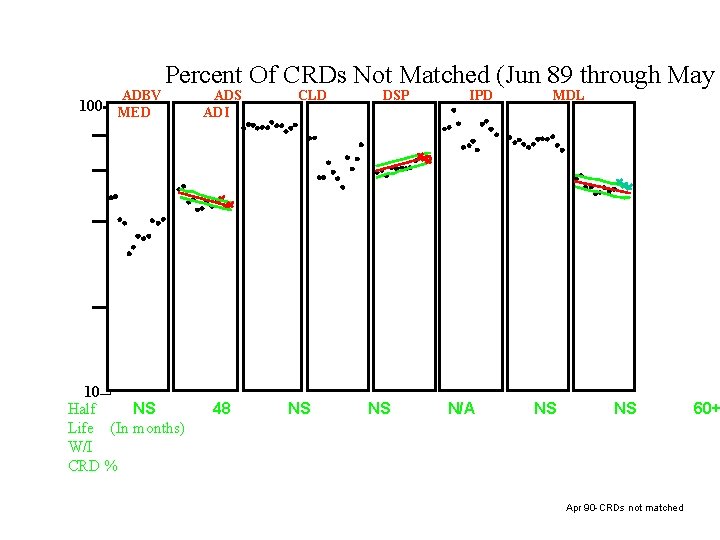
ADBV Percent Of CRDs Not Matched (Jun 89 through May 100 MED 10 NS Half Life (In months) W/I CRD % ADS ADI 48 CLD NS DSP NS IPD N/A MDL NS NS Apr 90 -CRDs not matched 60+
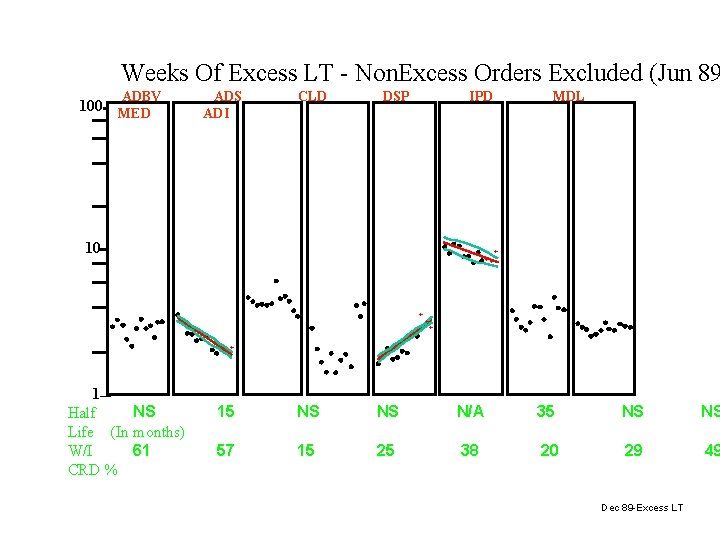
Weeks Of Excess LT - Non. Excess Orders Excluded (Jun 89 ADBV 100 MED ADS ADI CLD DSP IPD 10 MDL + ++ + + 1 NS Half Life (In months) 61 W/I CRD % 15 NS NS N/A 35 NS NS 57 15 25 38 20 29 49 Dec 89 -Excess LT
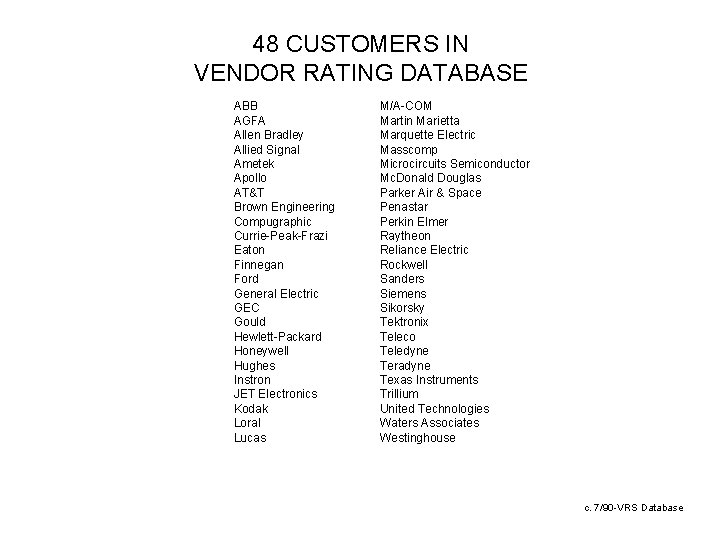
48 CUSTOMERS IN VENDOR RATING DATABASE ABB AGFA Allen Bradley Allied Signal Ametek Apollo AT&T Brown Engineering Compugraphic Currie-Peak-Frazi Eaton Finnegan Ford General Electric GEC Gould Hewlett-Packard Honeywell Hughes Instron JET Electronics Kodak Loral Lucas M/A-COM Martin Marietta Marquette Electric Masscomp Microcircuits Semiconductor Mc. Donald Douglas Parker Air & Space Penastar Perkin Elmer Raytheon Reliance Electric Rockwell Sanders Siemens Sikorsky Tektronix Teleco Teledyne Teradyne Texas Instruments Trillium United Technologies Waters Associates Westinghouse c. 7/90 -VRS Database
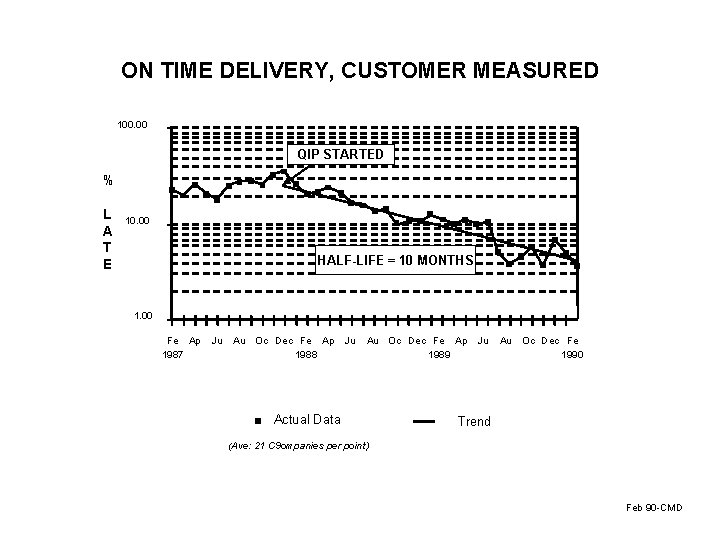
ON TIME DELIVERY, CUSTOMER MEASURED 100. 00 QIP STARTED % L A T E 10. 00 HALF-LIFE = 10 MONTHS 1. 00 Fe Ap 1987 Ju Au Oc Dec Fe Ap 1988 Ju Au Oc Dec Fe Ap 1989 Actual Data Ju Au Oc Dec Fe 1990 Trend (Ave: 21 C 9 ompanies per point) Feb 90 -CMD
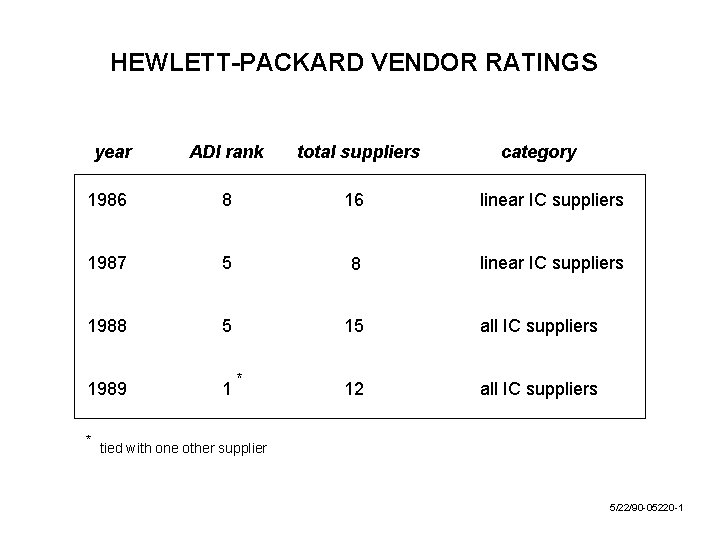
HEWLETT-PACKARD VENDOR RATINGS year ADI rank total suppliers 1986 8 16 linear IC suppliers 1987 5 8 linear IC suppliers 1988 5 15 all IC suppliers 1989 1 12 all IC suppliers * * category tied with one other supplier 5/22/90 -05220 -1
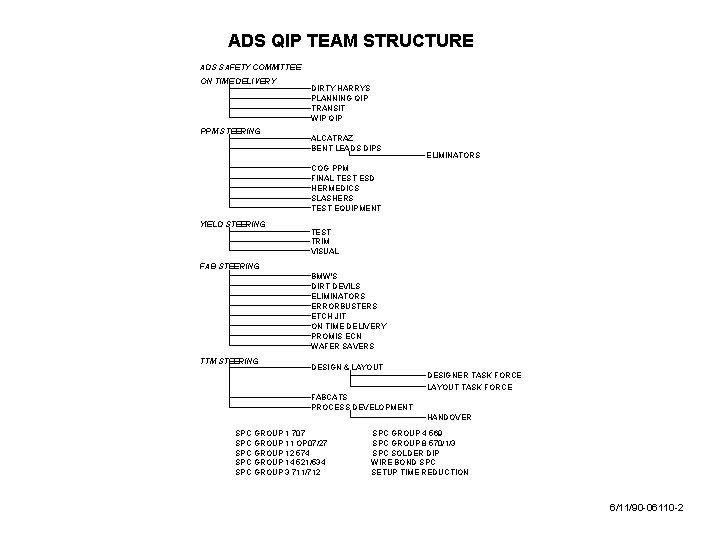
ADS QIP TEAM STRUCTURE ADS SAFETY COMMITTEE ON TIME DELIVERY PPM STEERING DIRTY HARRYS PLANNING QIP TRANSIT WIP QIP ALCATRAZ BENT LEADS DIPS ELIMINATORS COG PPM FINAL TEST ESD HERMEDICS SLASHERS TEST EQUIPMENT YIELD STEERING TEST TRIM VISUAL FAB STEERING BMW'S DIRT DEVILS ELIMINATORS ERRORBUSTERS ETCH JIT ON TIME DELIVERY PROMIS ECN WAFER SAVERS TTM STEERING DESIGN & LAYOUT DESIGNER TASK FORCE LAYOUT TASK FORCE FABCATS PROCESS DEVELOPMENT HANDOVER SPC GROUP 1 707 SPC GROUP 11 OP 07/27 SPC GROUP 12 574 SPC GROUP 14 521/534 SPC GROUP 3 711/712 SPC GROUP 4 569 SPC GROUP 8 570/1/3 SPC SOLDER DIP WIRE BOND SPC SETUP TIME REDUCTION 6/11/90 -06110 -2
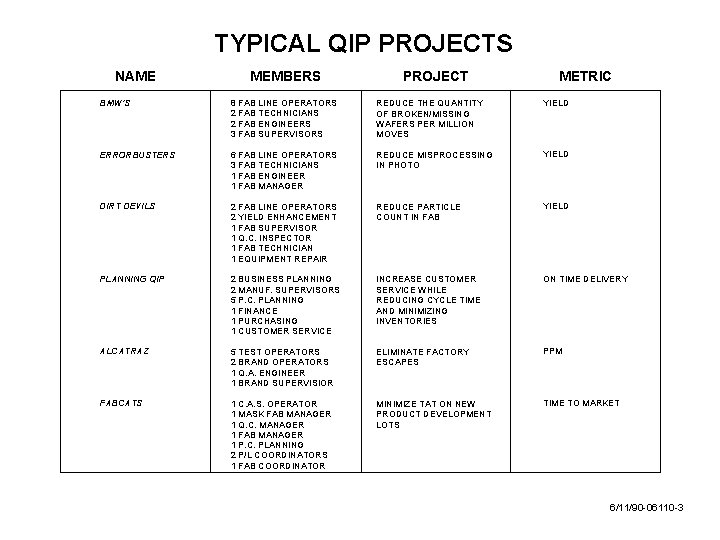
TYPICAL QIP PROJECTS NAME MEMBERS PROJECT METRIC BMW'S 8 FAB LINE OPERATORS 2 FAB TECHNICIANS 2 FAB ENGINEERS 3 FAB SUPERVISORS REDUCE THE QUANTITY OF BROKEN/MISSING WAFERS PER MILLION MOVES YIELD ERRORBUSTERS 6 FAB LINE OPERATORS 3 FAB TECHNICIANS 1 FAB ENGINEER 1 FAB MANAGER REDUCE MISPROCESSING IN PHOTO YIELD DIRT DEVILS 2 FAB LINE OPERATORS 2 YIELD ENHANCEMENT 1 FAB SUPERVISOR 1 Q. C. INSPECTOR 1 FAB TECHNICIAN 1 EQUIPMENT REPAIR REDUCE PARTICLE COUNT IN FAB YIELD PLANNING QIP 2 BUSINESS PLANNING 2 MANUF. SUPERVISORS 5 P. C. PLANNING 1 FINANCE 1 PURCHASING 1 CUSTOMER SERVICE INCREASE CUSTOMER SERVICE WHILE REDUCING CYCLE TIME AND MINIMIZING INVENTORIES ON TIME DELIVERY ALCATRAZ 5 TEST OPERATORS 2 BRAND OPERATORS 1 Q. A. ENGINEER 1 BRAND SUPERVISIOR ELIMINATE FACTORY ESCAPES PPM FABCATS 1 C. A. S. OPERATOR 1 MASK FAB MANAGER 1 Q. C. MANAGER 1 FAB MANAGER 1 P. C. PLANNING 2 P/L COORDINATORS 1 FAB COORDINATOR MINIMIZE TAT ON NEW PRODUCT DEVELOPMENT LOTS TIME TO MARKET 6/11/90 -06110 -3
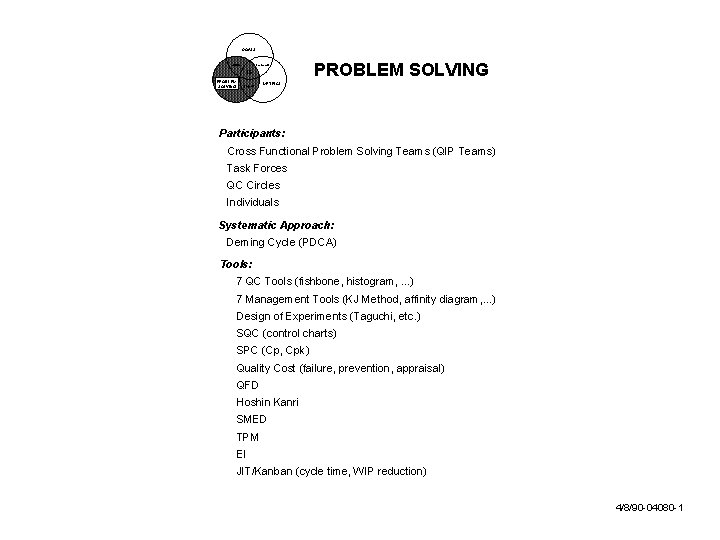
GOALS culture scorecard IS PROBLEM SOLVING projects PROBLEM SOLVING METRICS Participants: Cross Functional Problem Solving Teams (QIP Teams) Task Forces QC Circles Individuals Systematic Approach: Deming Cycle (PDCA) Tools: 7 QC Tools (fishbone, histogram, . . . ) 7 Management Tools (KJ Method, affinity diagram, . . . ) Design of Experiments (Taguchi, etc. ) SQC (control charts) SPC (Cp, Cpk) Quality Cost (failure, prevention, appraisal) QFD Hoshin Kanri SMED TPM EI JIT/Kanban (cycle time, WIP reduction) 4/8/90 -04080 -1
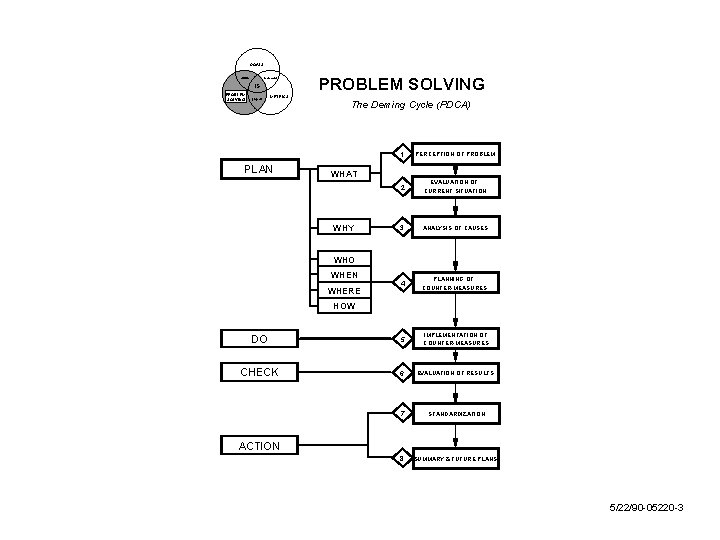
GOALS culture scorecard IS PROBLEM SOLVING projects METRICS PROBLEM SOLVING The Deming Cycle (PDCA) 1 PERCEPTION OF PROBLEM 2 EVALUATION OF CURRENT SITUATION 3 ANALYSIS OF CAUSES 4 PLANNING OF COUNTER-MEASURES DO 5 IMPLEMENTATION OF COUNTER-MEASURES CHECK 6 EVALUATION OF RESULTS 7 STANDARDIZATION 8 SUMMARY & FUTURE PLANS PLAN WHAT WHY WHO WHEN WHERE HOW ACTION 5/22/90 -05220 -3
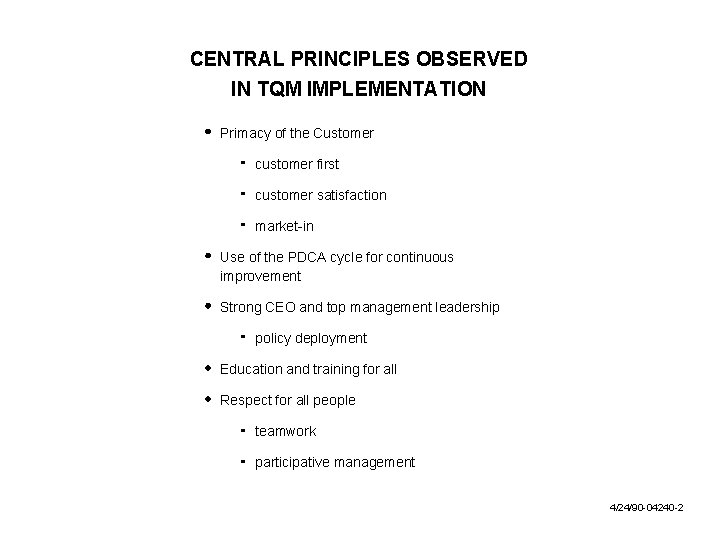
CENTRAL PRINCIPLES OBSERVED IN TQM IMPLEMENTATION Primacy of the Customer customer first customer satisfaction market-in Use of the PDCA cycle for continuous improvement Strong CEO and top management leadership policy deployment Education and training for all Respect for all people teamwork participative management 4/24/90 -04240 -2
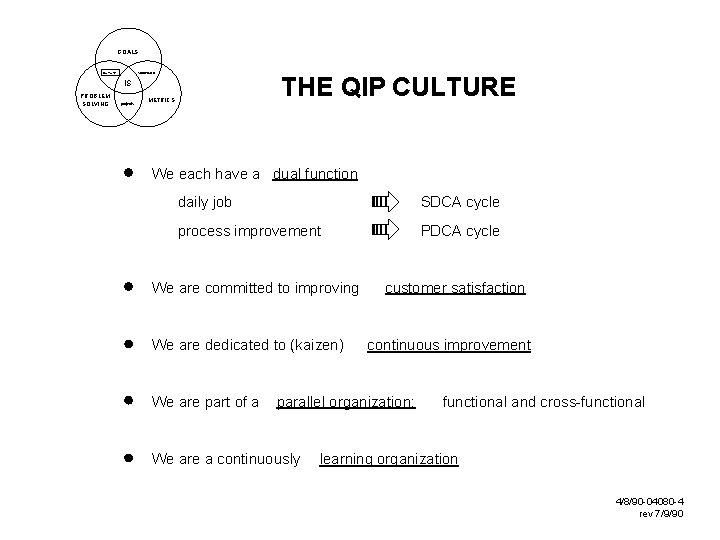
GOALS culture scorecard THE QIP CULTURE IS PROBLEM SOLVING projects METRICS We each have a dual function daily job SDCA cycle process improvement PDCA cycle We are committed to improving We are dedicated to (kaizen) We are part of a customer satisfaction continuous improvement parallel organization: We are a continuously functional and cross-functional learning organization 4/8/90 -04080 -4 rev 7/9/90
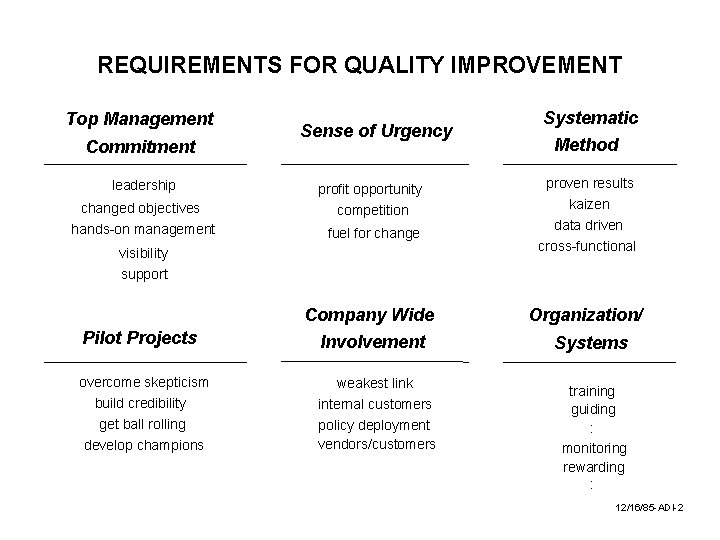
REQUIREMENTS FOR QUALITY IMPROVEMENT Top Management Commitment leadership Sense of Urgency changed objectives profit opportunity competition hands-on management fuel for change visibility support Pilot Projects Company Wide Involvement overcome skepticism build credibility weakest link internal customers get ball rolling develop champions policy deployment vendors/customers Systematic Method proven results kaizen data driven cross-functional Organization/ Systems training guiding : monitoring rewarding : 12/16/85 -ADI-2