DOSE AND TIMEDEPENDENT PHARMACOKINETICS CAUSES OF DOSE OR


![Remember that [Ef] = [ET] – [ES]](https://slidetodoc.com/presentation_image_h2/46a8a61ad0dcc0e4e70be3d3aa6bf982/image-14.jpg "Remember that [Ef] = [ET] – [ES]")


 of 80 proof")


 and multiple")


- Slides: 43
DOSE- AND TIMEDEPENDENT PHARMACOKINETICS
CAUSES OF DOSE- OR TIME-DEPENDENT KINETICS PROCESS EXAMPLE PARAMETER Saturable gut wall transport riboflavin Saturable gut wall metabolism salicylamide Poor solubility griseofulvin F F F Saturable plasma protein binding disopyramide fup Active tubular secretion Active tubular reabsorption Alterations in urine p. H Alterations in urine flow Nephrotoxicity penicillin G ascorbic acid salicylic acid theophylline gentamicin CLR CLR CLR
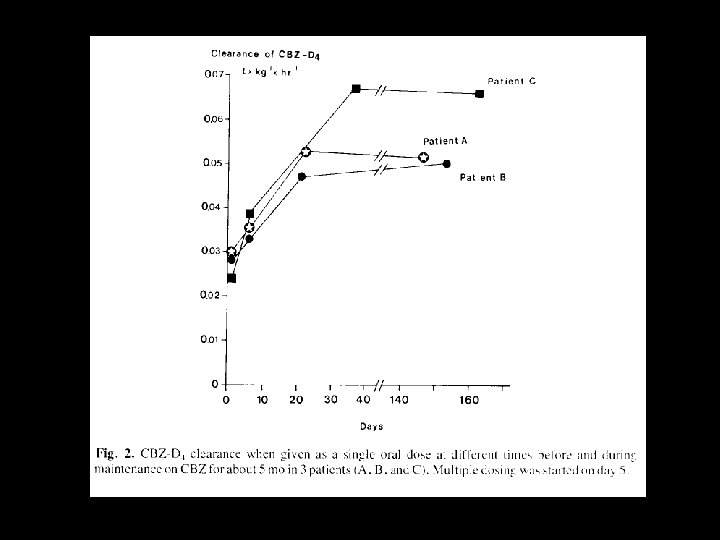
CAUSES OF DOSE- OR TIME-DEPENDENT KINETICS PROCESS EXAMPLE PARAMETER Capacity-limited metabolism Autoinduction Co-substrate depletion Product (metabolite) inhibition phenytoin carbamazepine acetaminophenylbutazone CLH CLH
I. ABSORPTION Effect of dose on riboflavin urinary recovery when given on an empty stomach. Date from: Levy G, Jusko WJ. Factors affecting the absorption of riboflavin in man. J Pharm Sci 55: 285 -289, 1966.
Effect of dose on ascorbic acid absorption. Data from Blanchard J et al. Am J Clin Nutr 66: 1165 -1171, 1997
Steady-state Vitamin C plasma concentration as a function of dose in 13 female subjects receiving doses from 30 to 2, 500 mg. From: Levine M, et al. A new recommended dietary allowance of vitamin C for healthy young women. Proc Natl Acad Sci USA 98: 9842 -9846, 2001.
From: Levine M, et al. A new recommended dietary allowance of vitamin C for healthy young women. Proc Natl Acad Sci USA 98: 9842 -9846, 2001.
Reproduced from: Rowland M, Tozet TN. Clinical Pharmacokinetics – Concepts and Applications, 3 rd edition, 1995, p. 397.
Reproduced from: Rowland M, Tozer TN. Ibid, p. 396.
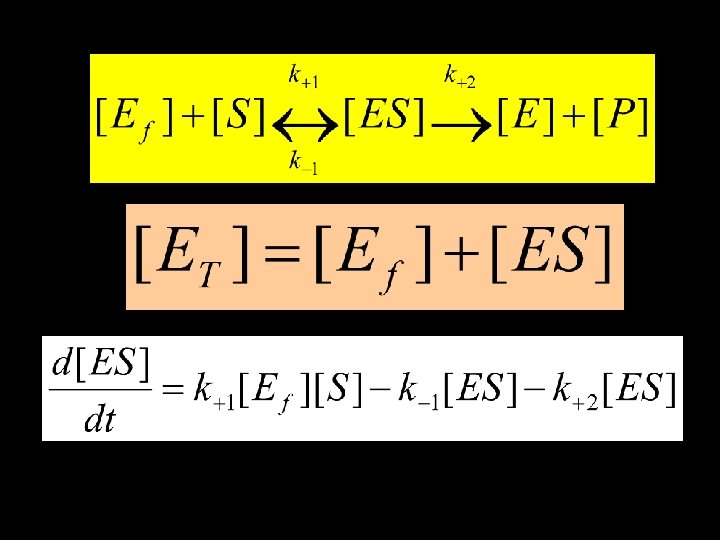
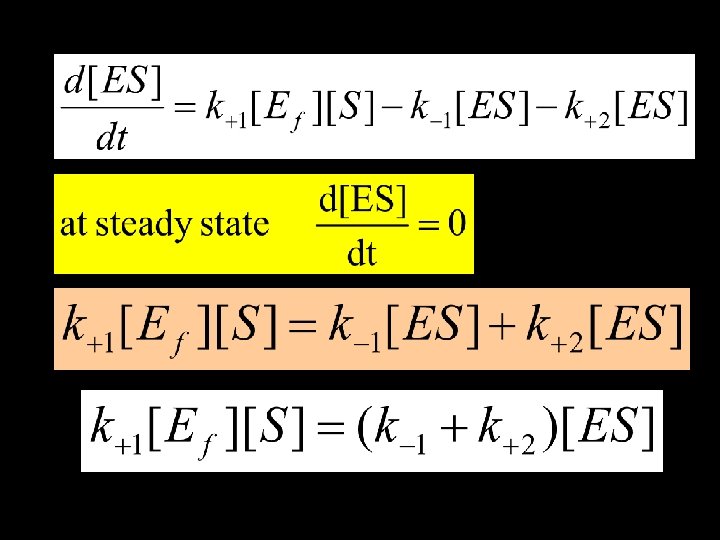
II. ELIMINATION A. CAPACITY-LIMITED ELIMINATION 1. MATHEMATICAL ANALYSIS These processes can be described via the Michaelis. Menten relationship:
k-1 is a dissociation process, whereas k+2 requires the breaking of bonds; thus, k-1>>k+2
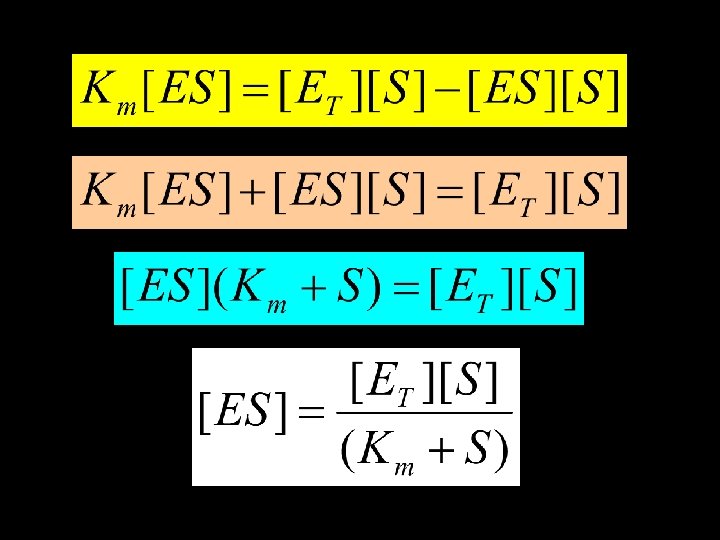
Remember that [Ef] = [ET] – [ES]
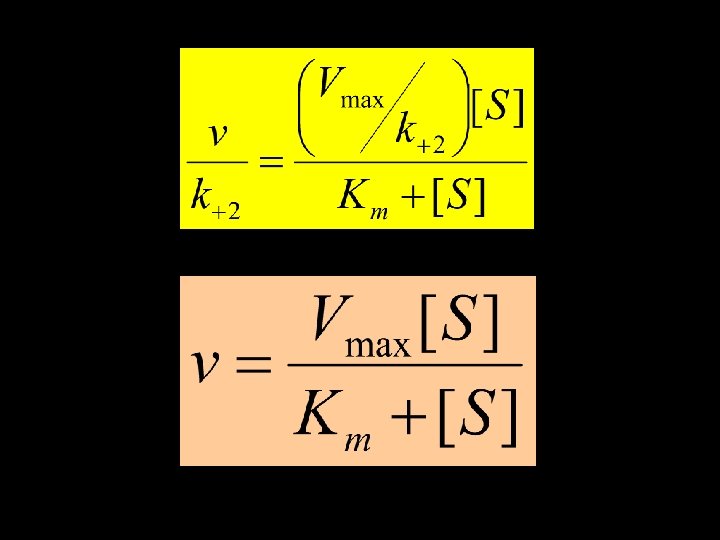
The rate of formation of the product is given as: By implication, the maximum rate is given as
For most drugs, Km >>C. Hence
Since Vmax and Km are constant for a given drug in a given individual, this ratio will be constant. Elimination will proceed in a first-order fashion.
Drugs for which Km << C: ethanol salicylate phenytoin Numerous drugs after first-pass
2. Clinical Consequences a. Relationship btwn dose and Cp Reproduced from: Tozer TN, Winter ME. Phenytoin, In: Evans WE, Schentag JJ, Jusko WJ, Applied Pharmacokinetics – Principles for Therapeutic Drug Monitoring. 3 rd edition, 1992, p. 25 -12
b. Relationship btwn dose and time to steady-state From: Ibid.
c. Relationship btwn dose and AUCo Plasma AUC of lorcainide in a subject as a function of dose. Data from: Janchen E et al. Clin Pharmacol Ther 26: 187, 1979.
c. Relationship btwn dose and AUCo Plasma AUC/Dose of lorcainide in a subject as a function of dose. Data from: Janchen E et al. Clin Pharmacol Ther 26: 187, 1979.
d. Relationship btwn dose and bioavailability Bioavailability of nicardipine after oral administration. Data from: Wagner JG et al. Biopharm Drug Dispos 8: 133148, 1987.
e. Relationship btwn Cp and time
3. Determination of Michaelis-Menten Parameters a. Lineweaver-Burke Expression 1/v 1/Vmax 1/C 1/Km Slope = Km/Vmax
b. In Vivo Determination Vmax Km K 0/Css
JB is an 18 yo male receiving phenytoin for prophylaxis of post-traumatic head injury seizures. The following steady state concentrations were obtained at the indicated doses: Dose (mg/d) 100 300 Css (mg/L) 3. 7 47 From this data, determine this patient’s Km and Vmax for phenytoin.
JB is an 18 yo male receiving phenytoin for prophylaxis of post-traumatic head injury seizures. The following steady state concentrations were obtained at the indicated doses: Dose (mg/d) 100 300 Css (mg/L) 3. 7 47 Dose Rate/Css (L/d) 27 6. 4 Vmax = 362 mg/d K 0 (mg/d) Km = 9. 7 mg/L K 0/Css (L/d)
What Css would be expected if a dose of 200 mg/d were given to this patient?
4. Application to Alcohol Avg Vmax = 10 g/hr Km = 100 mg/L Detectable pharmacologic effect: 250 mg/L Lethal concentrations >7000 mg/L
Note: Et. OH metabolism becomes zero-order. One jigger (45 m. L) of 80 proof Et. OH contains ~14 g of ethanol – which exceeds the Vmax! Data from: Rowland M, Tozer TN. Ibid, p. 406.
Reproduced from: Ibid, p. 408.
Reproduced from: Ibid, p. 408.
B. Autoinduction
C. Saturable Renal Tubular Reabsorption Steady-state plasma ascorbic acid concentration in healthy adults receiving various regimens twice daily for 3 to 4 weeks. Control subjects had no supplement. Estimated daily dietary intake of ascorbic acid was 5075 mg. From: Nutr Rep Intern 30: 597 -601, 1984.
Reproduced from: Rowland M, Tozer TN. Ibid, p. 404.
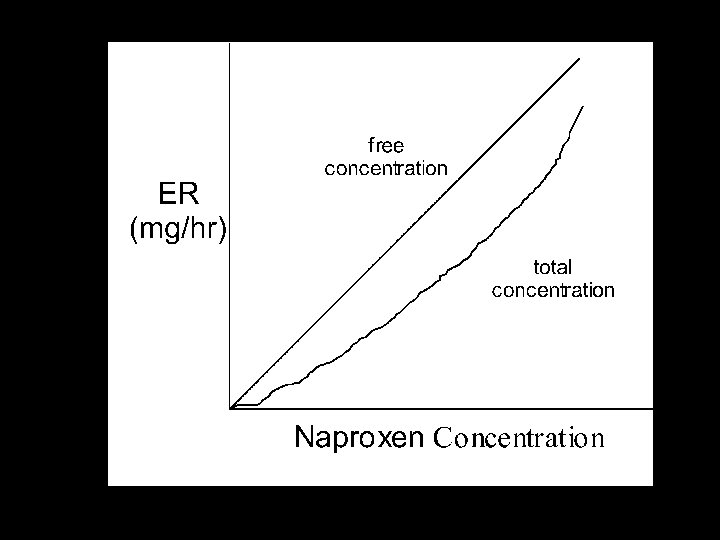
III. SATURABLE PROTEIN BINDING Dose vs AUC for naproxen after single (AUCs) and multiple (AUCm) doses. From: Clin Pharmacol Ther 15: 261 -266, 1974.
In vitro binding of naproxen as a function of Cp.
Relationship between oral clearance and fraction unbound of oxaprozin. From: J Clin Pharmacol 36: 985 -997, 1996.