Nonlinear Pharmacokinetics Most of the rate processes discussed
- Slides: 31
Nonlinear Pharmacokinetics • Most of the rate processes discussed in this course, except for the infusion process, follow first order kinetics. • For a few drugs it is observed that the elimination of the drug appears to be zero order at high concentrations and first order at low concentrations. • That is 'concentration' or 'dose' dependent kinetics are observed. At higher doses, which produce higher plasma concentrations, zero order kinetics are observed, whereas at lower doses the kinetics are linear or first order.
Nonlinear Pharmacokinetics • This occurs especially with drugs which are extensively metabolized. • A typical characteristic of enzymatic reactions and active transport is a limitation on the capacity of the process. • There is only so much enzyme present in the liver, and therefore there is a maximum rate at which metabolism can occur.
Nonlinear Pharmacokinetics • A further limitation in the rate of metabolism can be the limited availability of a co-substance or cofactor required in the enzymatic process. • This might be a limit in the amount of available glucuronide or glycine, for example. • Drug concentrations in the blood can increase rapidly once an elimination process is saturated. • This nonlinear pharmacokinetic behavior is also termed dose-dependent pharmacokinetics.
Nonlinear Pharmacokinetics • A number of drugs demonstrate saturation or capacity-limited metabolism in humans. • Examples of these saturable metabolic processes include: – glycine conjugation of salicylate. – sulfate conjugation of salicylamide. – acetylation of p-aminobenzoic acid. – The elimination of phenytoin.
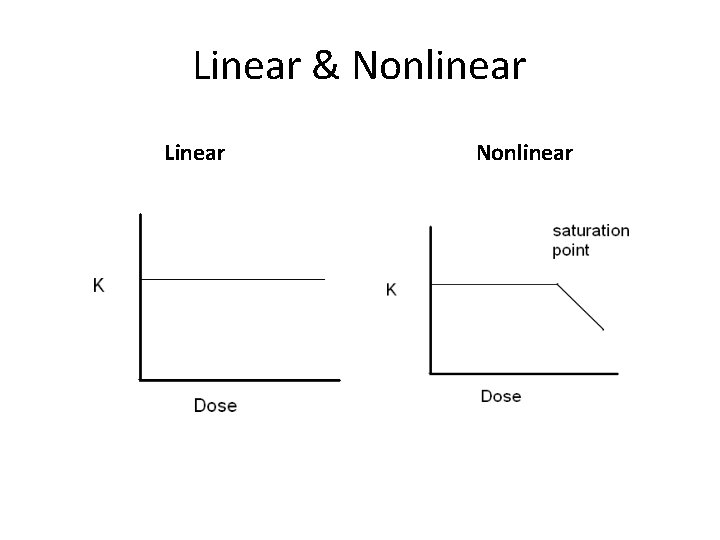
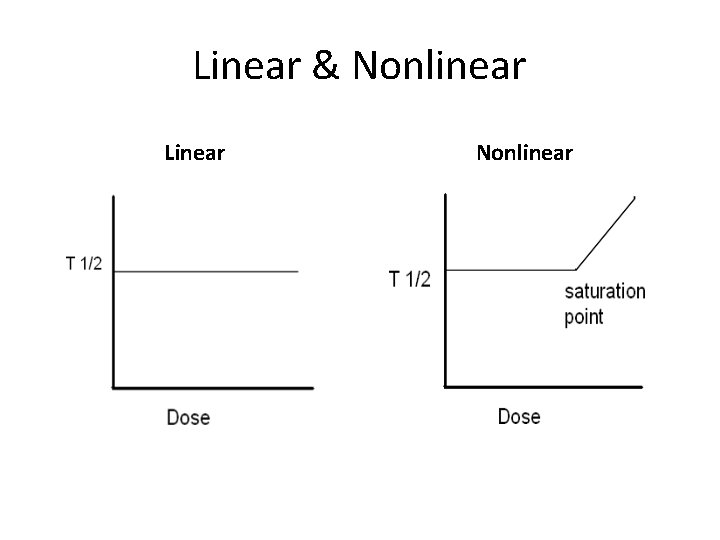
Nonlinear Pharmacokinetics • Drugs that demonstrate saturation kinetics usually show the following characteristics: 1) Elimination of drug does not follow simple first-order kinetics—that is, elimination kinetics are nonlinear. 2) The elimination half-life changes as dose is increased. Usually, the elimination half-life increases with increased dose due to saturation of an enzyme system. However, the elimination half-life might decrease due to "self"-induction of liver biotransformation enzymes, as is observed for carbamazepine.
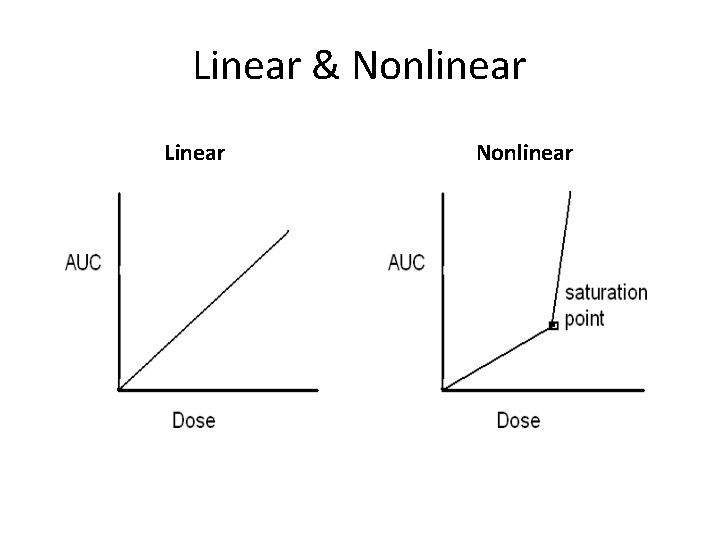
Nonlinear Pharmacokinetics 3) The area under the curve (AUC) is not proportional to the amount of bioavailable drug. 4) The saturation of capacity-limited processes may be affected by other drugs that require the same enzyme or carrier-mediated system (ie, competition effects). 5) The composition and/or ratio of the metabolites of a drug may be affected by a change in the dose.
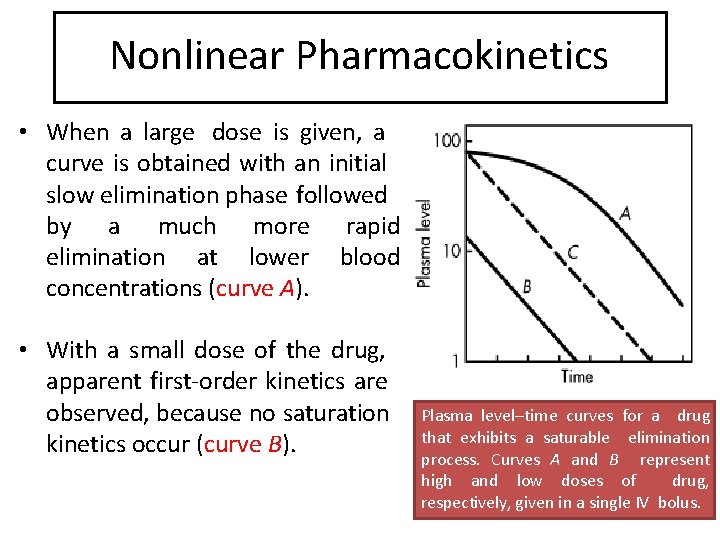
Nonlinear Pharmacokinetics • When a large dose is given, a curve is obtained with an initial slow elimination phase followed by a much more rapid elimination at lower blood concentrations (curve A). • With a small dose of the drug, apparent first-order kinetics are observed, because no saturation kinetics occur (curve B). Plasma level–time curves for a drug that exhibits a saturable elimination process. Curves A and B represent high and low doses of drug, respectively, given in a single IV bolus.
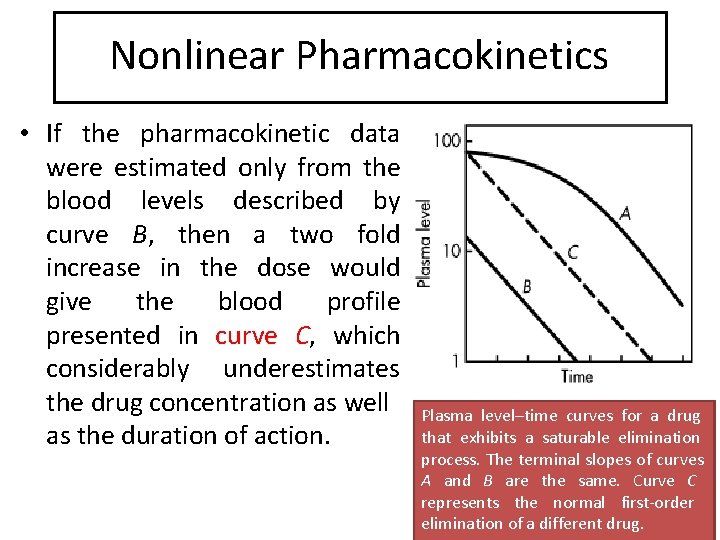
Nonlinear Pharmacokinetics • If the pharmacokinetic data were estimated only from the blood levels described by curve B, then a two fold increase in the dose would give the blood profile presented in curve C, which considerably underestimates the drug concentration as well as the duration of action. Plasma level–time curves for a drug that exhibits a saturable elimination process. The terminal slopes of curves A and B are the same. Curve C represents the normal first-order elimination of a different drug.
Nonlinear Pharmacokinetics • In order to determine whether a drug is following dose-dependent kinetics, the drug is given at various dosage levels and a plasma level–time curve is obtained for each dose. • The curves should exhibit parallel slopes if the drug follows dose-independent kinetics. Alternatively, a plot of the areas under the plasma level–time curves at various doses should be linear.
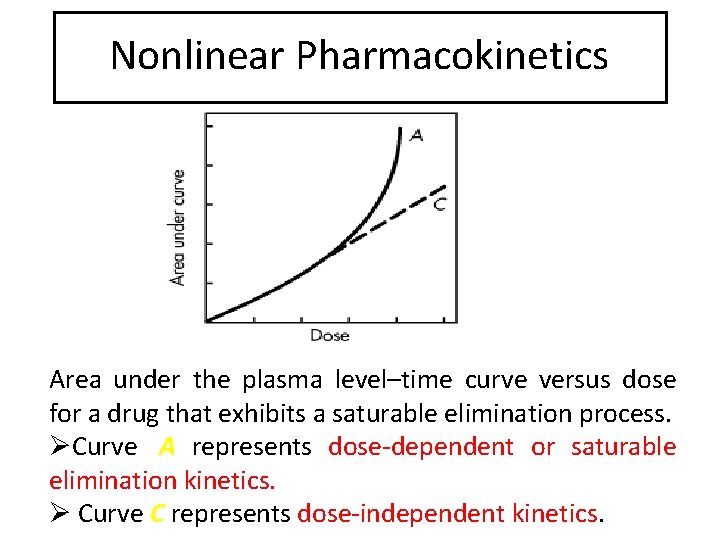
Nonlinear Pharmacokinetics Area under the plasma level–time curve versus dose for a drug that exhibits a saturable elimination process. Curve A represents dose-dependent or saturable elimination kinetics. Curve C represents dose-independent kinetics.
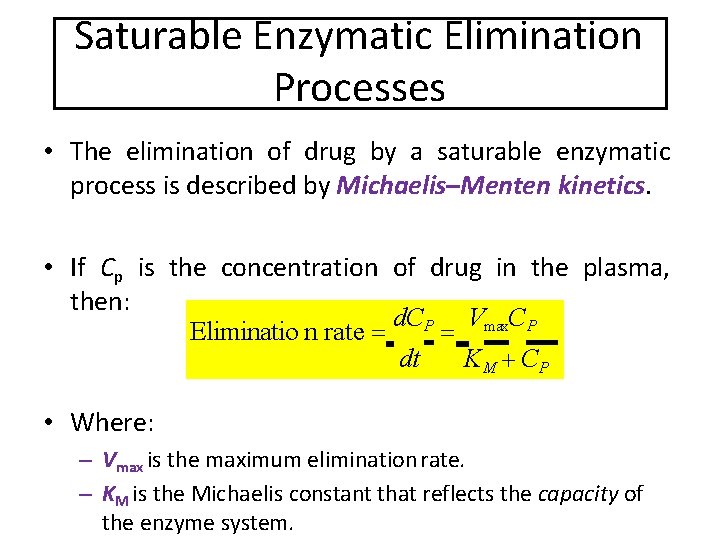
Saturable Enzymatic Elimination Processes • The elimination of drug by a saturable enzymatic process is described by Michaelis–Menten kinetics. • If Cp is the concentration of drug in the plasma, then: d. CP Vmax. CP Eliminatio n rate dt K M CP • Where: – Vmax is the maximum elimination rate. – KM is the Michaelis constant that reflects the capacity of the enzyme system.
Saturable Enzymatic Elimination Processes • KM is not an elimination constant, but is actually a hybrid rate constant in enzyme kinetics, representing both the forward and backward reaction rates and equal to the drug concentration or amount of drug in the body at 0. 5 Vmax. • The values for KM and Vmax are dependent on the nature of the drug and the enzymatic process involved.
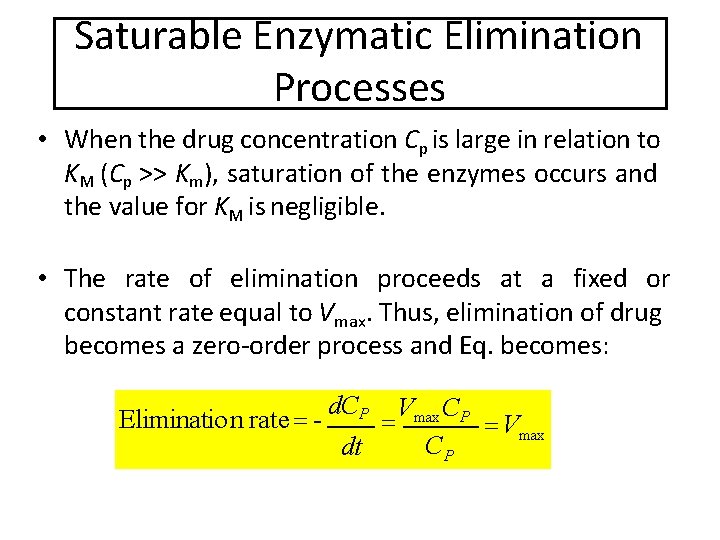
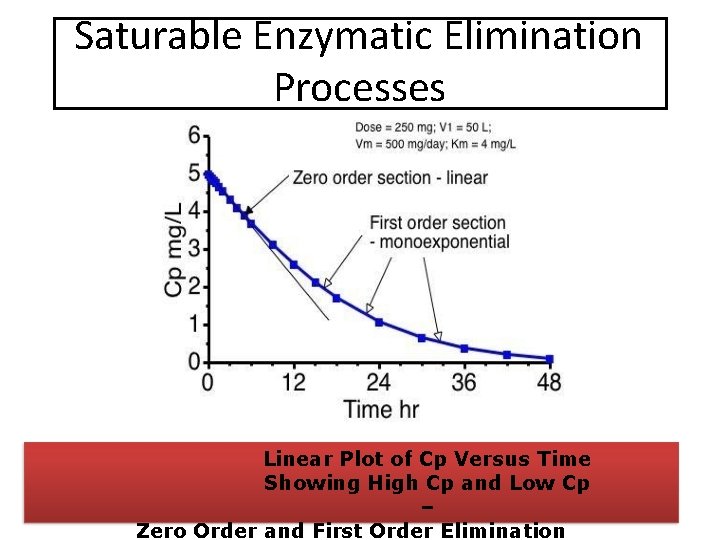
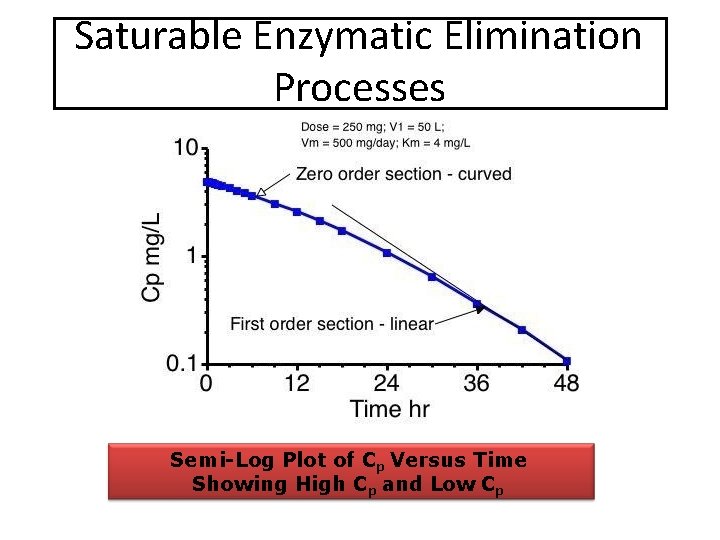
Saturable Enzymatic Elimination Processes • When the drug concentration Cp is large in relation to KM (Cp >> Km), saturation of the enzymes occurs and the value for KM is negligible. • The rate of elimination proceeds at a fixed or constant rate equal to Vmax. Thus, elimination of drug becomes a zero-order process and Eq. becomes: Eliminatio n rate - d. CP dt Vmax CP
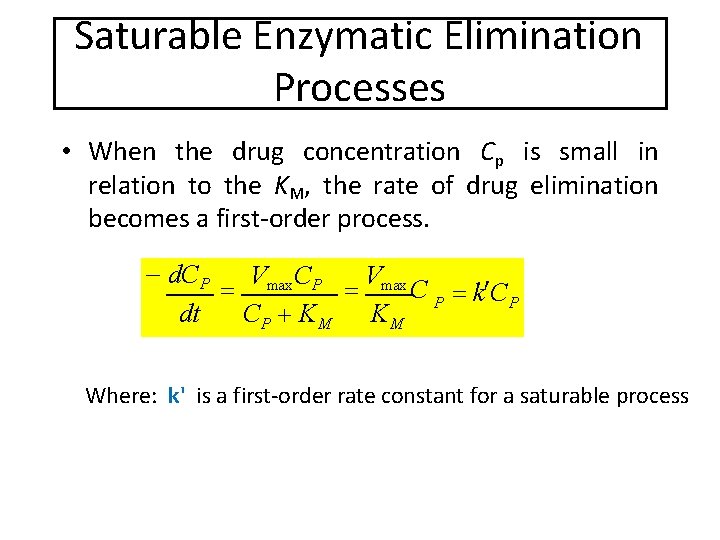
Saturable Enzymatic Elimination Processes • When the drug concentration Cp is small in relation to the KM, the rate of drug elimination becomes a first-order process. d. CP V C V max P max C P k C P dt CP K M Where: k' is a first-order rate constant for a saturable process
Saturable Enzymatic Elimination Processes • When given in therapeutic doses, most drugs produce plasma drug concentrations well below KM for all carrier-mediated enzyme systems affecting the pharmacokinetics of the drug. • Therefore, most drugs at normal therapeutic concentrations follow first-order rate processes.
Saturable Enzymatic Elimination Processes • Only a few drugs, such as salicylate and phenytoin, tend to saturate the hepatic mixedfunction oxidases at higher therapeutic doses. • With these drugs, elimination kinetics are firstorder with very small doses, mixed order at higher doses, and may approach zero-order with very high therapeutic doses.
Saturable Enzymatic Elimination Processes Linear Plot of Cp Versus Time Showing High Cp and Low Cp – Zero Order and First Order Elimination
Saturable Enzymatic Elimination Processes Semi-Log Plot of Cp Versus Time Showing High Cp and Low Cp
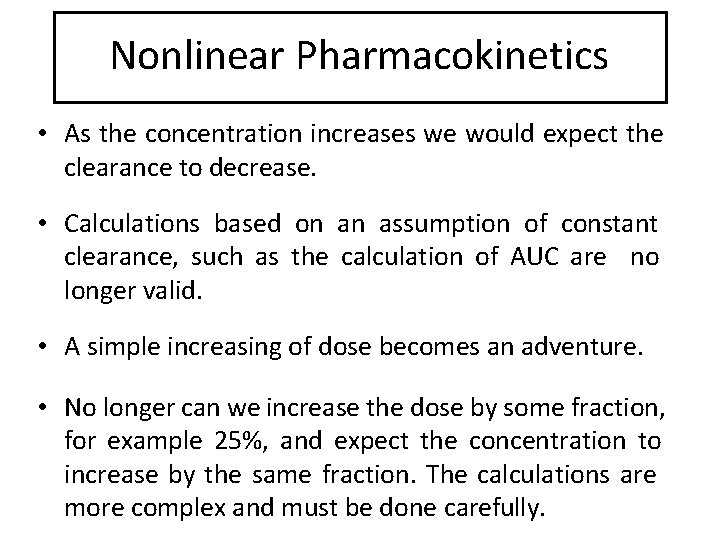
Nonlinear Pharmacokinetics • As the concentration increases we would expect the clearance to decrease. • Calculations based on an assumption of constant clearance, such as the calculation of AUC are no longer valid. • A simple increasing of dose becomes an adventure. • No longer can we increase the dose by some fraction, for example 25%, and expect the concentration to increase by the same fraction. The calculations are more complex and must be done carefully.
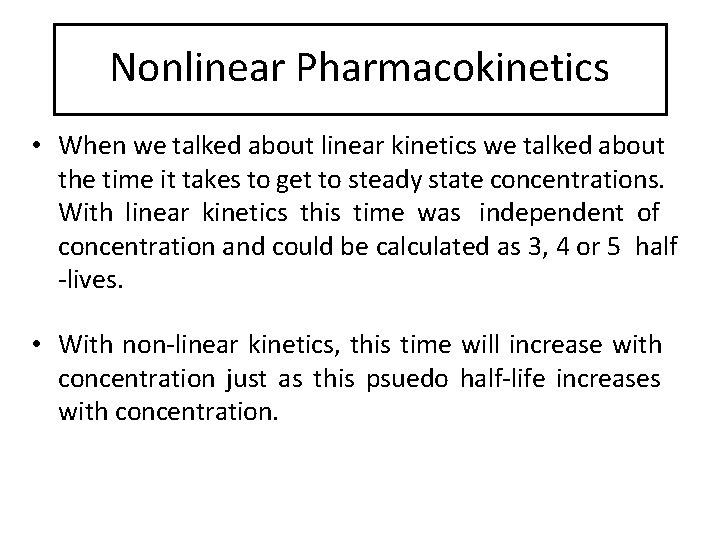
Nonlinear Pharmacokinetics • When we talked about linear kinetics we talked about the time it takes to get to steady state concentrations. With linear kinetics this time was independent of concentration and could be calculated as 3, 4 or 5 half -lives. • With non-linear kinetics, this time will increase with concentration just as this psuedo half-life increases with concentration.
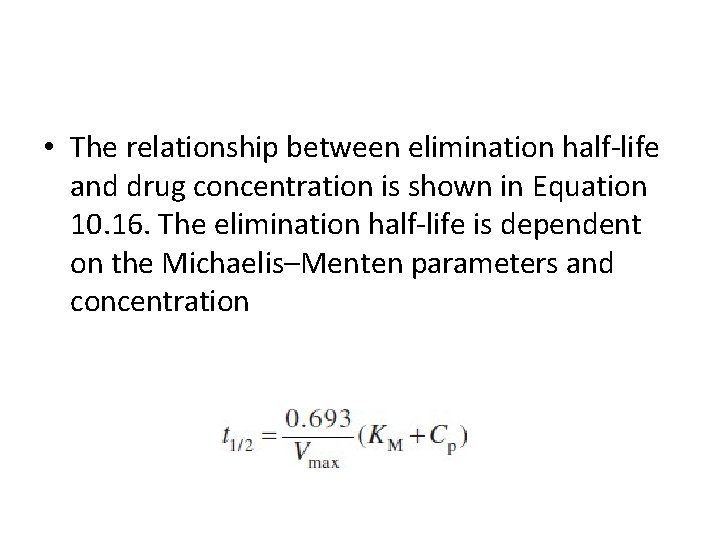
• The relationship between elimination half-life and drug concentration is shown in Equation 10. 16. The elimination half-life is dependent on the Michaelis–Menten parameters and concentration
Nonlinear Pharmacokinetics • This is very important when we use steady state concentrations to make parameter estimates. If we don't wait long enough our determination of steady state concentration will be in error and so will the parameter estimates. • This time to steady state might change from a few days to weeks as the dose is increased.
Nonlinear Pharmacokinetics • The presence of saturation kinetics can be quite important when high doses of certain drugs are given, or in case of over-dose. • In the case of high dose administration the effective elimination rate constant is reduced and the drug will if accumulate excessively saturation kinetics are not understood.
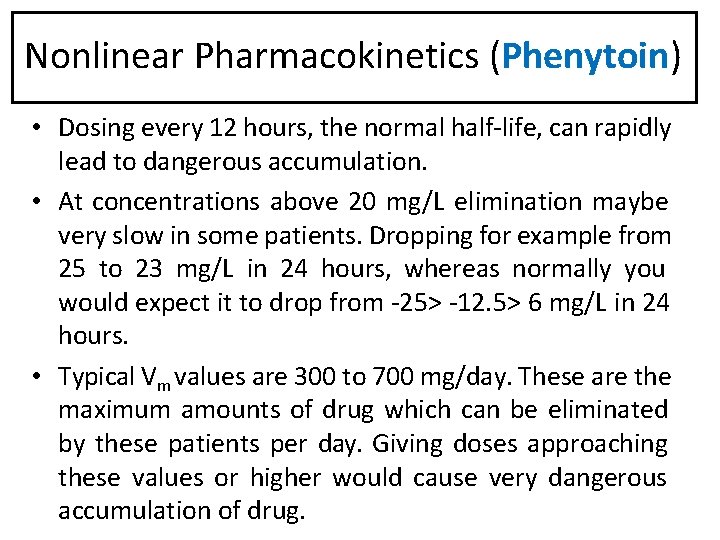
Nonlinear Pharmacokinetics (Phenytoin) • Phenytoin is an example of a drug which commonly has a Km value within or below therapeutic range. – The average Km value is about 4 mg/L. – The normally effective plasma concentrations for phenytoin are between 10 and 20 mg/L. • Therefore it is quite possible for patients to be overdosed due to drug accumulation. • At low concentration the apparent half-life is about 12 hours, whereas at higher concentration it may well be much greater than 24 hours.
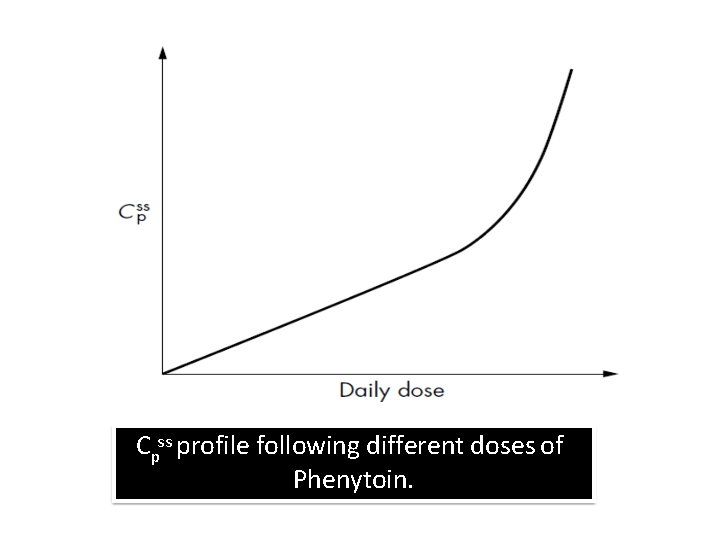
Nonlinear Pharmacokinetics (Phenytoin) • Dosing every 12 hours, the normal half-life, can rapidly lead to dangerous accumulation. • At concentrations above 20 mg/L elimination maybe very slow in some patients. Dropping for example from 25 to 23 mg/L in 24 hours, whereas normally you would expect it to drop from -25> -12. 5> 6 mg/L in 24 hours. • Typical Vm values are 300 to 700 mg/day. These are the maximum amounts of drug which can be eliminated by these patients per day. Giving doses approaching these values or higher would cause very dangerous accumulation of drug.
Cpss profile following different doses of Phenytoin.
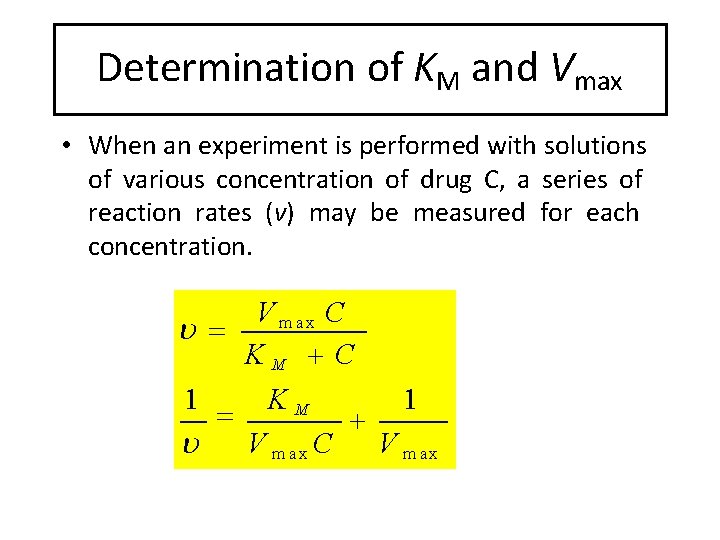
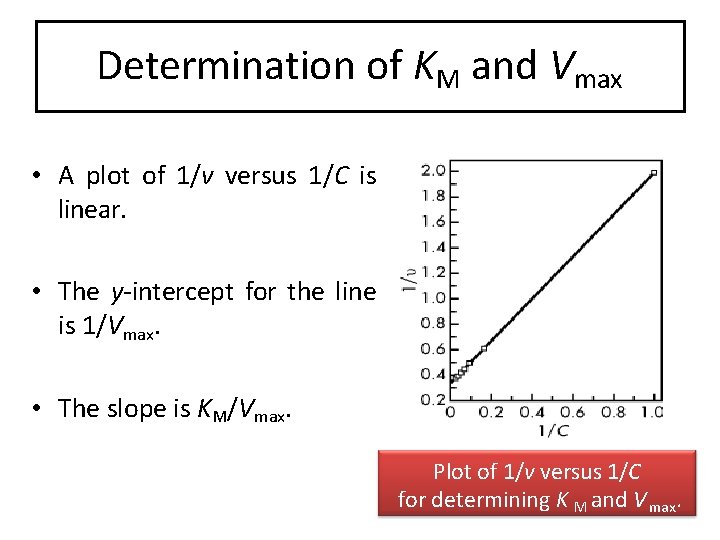
Determination of KM and Vmax • When an experiment is performed with solutions of various concentration of drug C, a series of reaction rates (v) may be measured for each concentration. V max C KM C 1 KM 1 V m ax C V m ax
Determination of KM and Vmax • A plot of 1/v versus 1/C is linear. • The y-intercept for the line is 1/Vmax. • The slope is KM/Vmax. Plot of 1/v versus 1/C for determining K M and V max.
Linear & Nonlinear Linear Nonlinear
Linear & Nonlinear Linear Nonlinear
Linear & Nonlinear Linear Nonlinear