Dokumentasi Rekomendasi Teknologi IK 305 Infrastruktur Teknologi Informasi
")


- Slides: 26
Dokumentasi Rekomendasi Teknologi IK 305 Infrastruktur Teknologi Informasi Suryo Widiantoro, ST, MMSI, M. Com(IS)
Capaian Pembelajaran Materi Perkuliahan � Mahasiswa mampu membuat dokumentasi rekomendasi teknologi menggunakan diagram infrastruktur TIK
Topik Bahasan 1. Studi kasus BPM
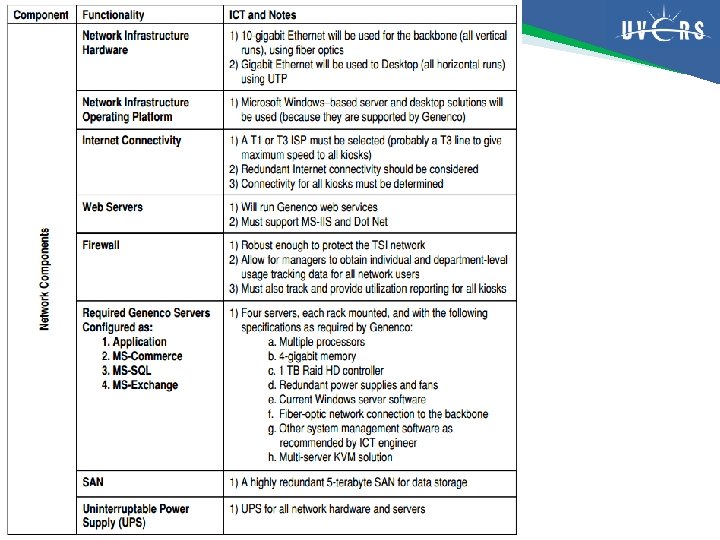
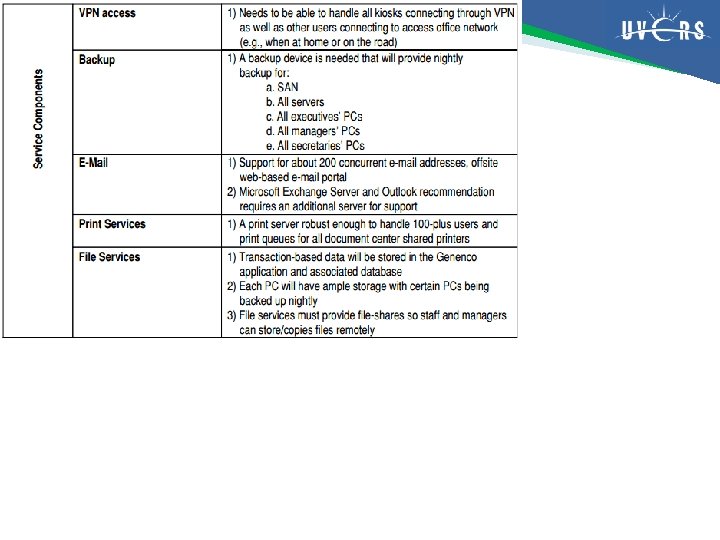
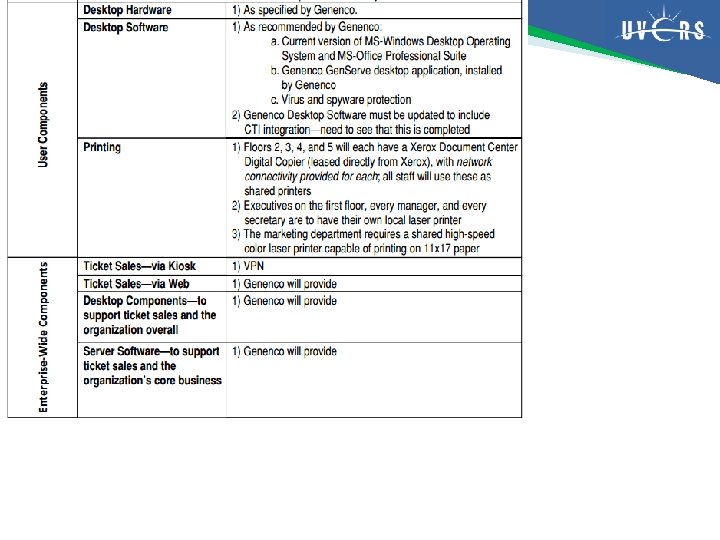
� The TSI case provides an abbreviated functionality list. � Note that the functionality and ICT lists will be dramatically different based on the recommendations included. � Having the engineer give input early in the process can prevent costly ICT infrastructure changes later during the implementation phase. ◦ In fact, consultation with the engineer should occur throughout the creation of the ICT functionality list, the ICT hierarchy diagram, bandwidth estimates, and the final high-level design documents.
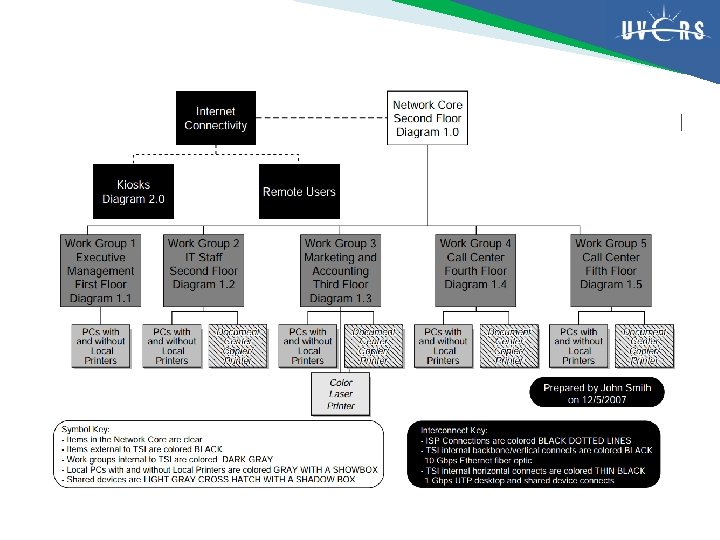
� Using TSI as an example, and looking from a very high level, we shows an ICT hierarchy. � This high-level view shows the internal TSI infrastructure and devices, the external Internet connectivity, and the external kiosks that would be implemented to fulfill TSI’s business model. � This sample ICT hierarchy diagram will be used as a basis for the examples of high-level ICT diagrams discussed later.
Creating High-Level ICT Design Documents � Using the working documents discussed in the previous section, the business analyst can now generate high-level diagrams suitable for the users, staff, managers, and ICT engineer so they can understand the ICT infrastructure. � It is important that the business analyst is in constant consultation with all of the stakeholders to ensure that the diagrams depict what the stakeholders envision. � Once the stakeholders see the ICT infrastructure in a high-level diagram, they may notice functionalities, components, or other items that were missing or not apparent in the earlier design documents.
� Currently, no generally adopted or recognized industry standards are available for drawing highlevel ICT infrastructure diagrams, so we provides a number of diagramming recommendations for creating user-friendly and consistent documents based on the experience. � As noted at the beginning, the recommended highlevel design document set consists of a document list, a context diagram, individual ICT diagrams for all objects in the core and work groups, and diagram notes.
General Diagramming Conventions � There a few general considerations for creating design documents. � The diagrams must be clear, uncluttered, and concise. � They must include diagram notes and be connected using decimal notation. � Diagrams should contain a title, a key for identifying unlabeled elements (e. g. , the speed of data links indicated by line thickness or color), and the name of the document creator. � The symbols to be used are up to the designer, but they should make sense to all of the stakeholders. � Topologies should also be clear.
� Diagrams and the items on them should use a decimal notation system for organization. � All diagrams and items (e. g. , servers, ICT equipment) should be labeled in dotted notation and should end in a number or a letter (e. g. , 1. 0, 1. 1, 1. 2, 1. a, 1. b, 1. c). � When a diagram ends in a number after the dot, it indicates that the diagram is linked to a subsequent diagram. ◦ Conversely, when a diagram ends in a letter after the dot, it means that there is no subsequent diagram.
� Diagram Notes. All diagrams in a document list should have associated diagram notes. Diagram notes contain information for those who will use and those who will build the infrastructure. The notes should be numbered the same as the diagram they pertain to, and each object on the diagram (i. e. , ending in a number or a letter) should have an entry in the notes that explains every item. � Connecting Diagrams. When a document set is created, it is often necessary to connect higher-level diagrams with lower-level ones. As a general rule, unless the ICT diagram is very small, each individual data frame (work group) should be shown on its own page. When using multiple pages, use the same symbol and name on the main diagram and on the
� Splitting Work Groups. Sometimes it is necessary to split work groups into multiple diagrams because of the omplexity of diagramming, the type of work being done, or for clarity. When splitting diagrams, you should append a letter to each diagram to indicate that there are no subsidiary diagrams that will be linked to it (e. g. , if you were splitting work group 9 into three diagrams, you might label the split diagrams 9 A, 9 B, and 9 C).
Document List � The document list is simply a list of the diagrams that will be included in the diagram set. � The items are numbered according to the ICT hierarchy discussed previously—think of it as a table of contents, of sorts.
� Based on TSI, the document list is composed of the following: TSI context diagram: 1. TSI main office core diagram 1. 0 �TSI first-floor work-group diagram 1. 1—note that a number is used at the end to signify that there will be subsequent diagrams. �There would be a number of other diagrams to complete the diagramming set. 2. TSI kiosk diagram 2. 0: �Diagram 2. 0 A—note a letter is used at the end to show that there will be no subsequent diagrams �Diagram 2. 0 B
Context Diagram � Use an ICT infrastructure context diagram to show the entire organization, its partners, and the related ICT infrastructure. � Based on the complexity of the infrastructure and the number of partners who share data, the ICT infrastructure context diagram may be complex and take a good bit of work to create. � This is created through interviews with stakeholders and ICT engineers and incorporates the business analyst’s recommendations.
Context diagram TSI
Context diagram notes TSI
Individual ICT Diagrams � Once the context diagram is completed, we move to the individual diagrams that describe the infrastructure. � The context diagram and the individual diagrams must work together and must agree with the document list described earlier. � The main office core at TSI will consist of an Ethernet backbone, connections to five work groups, several servers, a computer telephony integration server (the recommendation for which the business process diagram was completed), and connectivity to the Internet.
� TSI Main Office Core Diagram 1. 0
� TSI Main Office Core Diagram 1. 0 Notes
� TSI Third-Floor Work-Group Diagram 1. 3
TSI Third-Floor Work-Group Diagram 1. 3 Notes
Terima Kasih