Counting Viruses Measuring the Latent HIV1 Reservoir Michael

 q Collaboratory of AIDS Researchers for Eradication (David")


: Limiting-Dilution Coculture Assay q The current gold standard assay to")
: Limiting-Dilution Coculture Assay IUPM Calculation based on p 24 results")
: Limiting-Dilution Coculture Assay IUPM Calculation based on p 24 results")
: Limiting-Dilution Coculture Assay Dilution 2. 5 x 10⁶ cells/well 0.")

 • Estimate IUPM")

 • • •")
")
")
")

")
 VL 1 VL 2 DVL 1 VL")
: Limiting-Dilution Coculture Assay Dilution + - 2. 5 x 106")
 …")
 …")
")
 q Extend Myers et al / Trumble")

:")
 32 32 32 12 12 9 9 6")
 • Resting CD 4+")

 QVOA Total wells QVOA p 24+ wells VOA-UDSA wells")


 q Collaboratory of AIDS Researchers for Eradication (David")

- Slides: 46
Counting Viruses Measuring the Latent HIV-1 Reservoir Michael Hudgens UNC CFAR UNC Department of Biostatistics
Acknowledgements q UNC CFAR (Ron Swanstrom) q Collaboratory of AIDS Researchers for Eradication (David Margolis) q Ilana Trumble, Andrew Allmon, Nancie Archin q Joseph Rigdon, Owen Francis, Pedro Baldoni q Sook-Kyung Lee, Shuntai Zhou, Ean Spielvogel q David Margolis, Ronald Swanstrom
http: //www. nature. com/nature/journal/v 487/n 7408/pdf/nature 11286. pdf http: //www. forbes. com David Margolis Professor of Medicine, Microbiology and Immunology, and Epidemiology, at UNC http: //www. businessweek. com
Accurate Measurement Of Latent HIV-1 Reservoir Is Important Accurate measurement of latent HIV-1 reservoir is necessary for Assessing changes in the size of the viral reservoir over the course of therapy Assessing the effectiveness of anti-HIV-1 drugs and strategies for HIV-1 eradication
Frequency of Latently Infected Resting CD 4+ T Cells Extremely Low 1 in Million Resting CD 4+ T cells (Range: 0. 1 – 10) IUPM (Infectious Unit Per Million cells) 1. 0
Viral Outgrowth Assay (VOA): Limiting-Dilution Coculture Assay q The current gold standard assay to measure latent reservoir of HIV-1. q Measures resting CD 4+ T cells that harbor replication-competent HIV-1 in patients on HAART. q Resource and labor intensive.
Viral Outgrowth Assay (VOA): Limiting-Dilution Coculture Assay IUPM Calculation based on p 24 results (Slide courtesy of Nancie Archin)
Viral Outgrowth Assay (VOA): Limiting-Dilution Coculture Assay IUPM Calculation based on p 24 results (Slide courtesy of Nancie Archin)
Viral Outgrowth Assay (VOA): Limiting-Dilution Coculture Assay Dilution 2. 5 x 10⁶ cells/well 0. 1 x 10⁶ cells/well 0. 05 x 106 cells/well + - + - + - - - At least one latently infected resting CD 4+ T cell
Limiting Dilution Assay : Statistical Analysis
Limiting Dilution Assay : Statistical Analysis • Myers et al (1994) • Estimate IUPM via maximum likelihood • Confidence intervals by inverting exact likelihood ratio test • Goodness-of-fit test p-value (PGOF) : identify technical problems w assay • PGOF is pr of an experimental result occurring as rare or rarer than observed result • Low values indicate rare or implausible results, perhaps due to false - or false + wells • Samples with low PGOF might be considered for retesting • No (free) software
Limiting Dilution Assay : Statistical Analysis
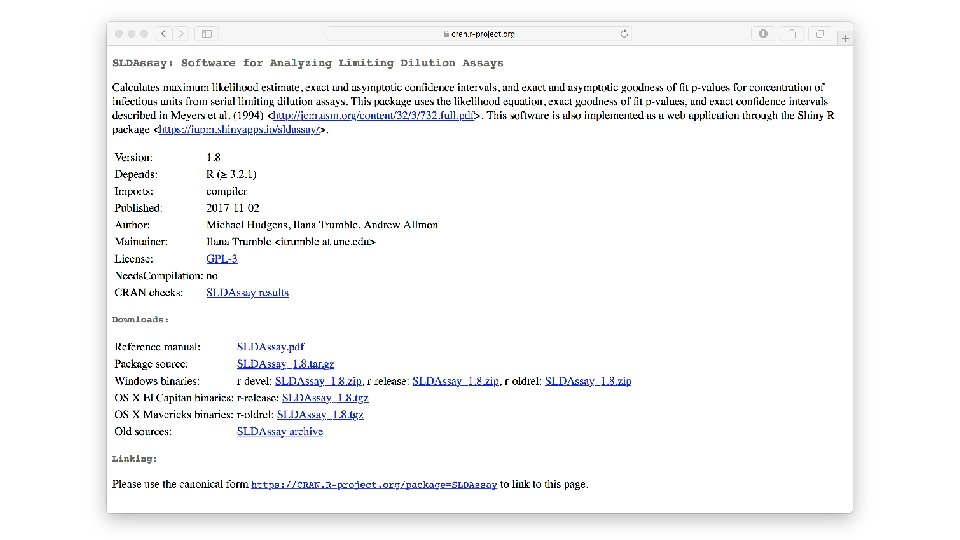
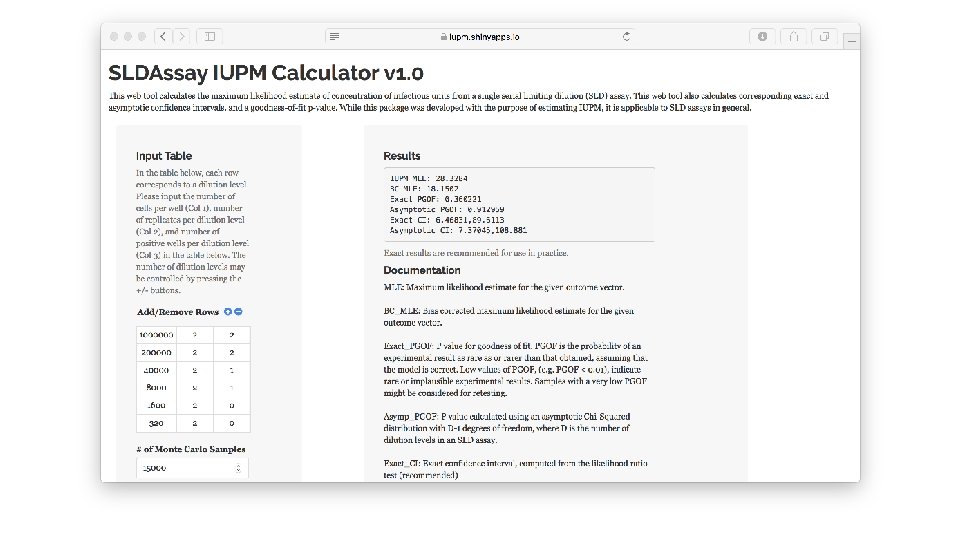
Limiting Dilution Assay : Statistical Analysis • Trumble et al (2017) • • • Free software implementing Myers et al. R package (SLDAssay on CRAN) and web calculator (shinyapps. io) Estimate IUPM via maximum likelihood (MLE) Also bias-corrected MLE (new) Confidence intervals by inverting exact likelihood ratio test Goodness-of-fit test • Simulation study, compare w/ results in Myers et al
Trumble et al (2017)
Trumble et al (2017)
Trumble et al (2017)
Bias-corrected MLE
Trumble et al (2017)
Primer-ID Based Ultra Deep Sequencing Assay (VOA-UDSA) VL 1 VL 2 DVL 1 VL 3 DVL 2 VL 4 DVL 3 VOA Induction of proviruses in resting CD 4+ T cells VL 5 Deep Sequencing and Phylogenetic analysis : Automated process IUPM
Viral Outgrowth Assay (VOA): Limiting-Dilution Coculture Assay Dilution + - 2. 5 x 10⁶ cells/well 0. 1 x 10⁶ cells/well 0. 05 x 106 cells/well + - + - + - - - VL 1 VL 2 VL 3 At least three latently infected resting CD 4+ T cells Progress!
1 2 3 4 5 6 7 m … P 24 test (VOA-LD) … …
1 2 3 4 5 6 7 m … P 24 test (VOA-LD) … …
1 2 3 4 5 6 7 m … … P 24 test (VOA-LD) … 0 1 1 0 0 … 0 ? ? ? 0 0 0 Lineage 2 1 0 0 0 0 … 1 ? ? ? 0 0 0 Lineage 3 0 0 0 1 1 0 1 … 0 ? ? ? 0 0 0 Lineage 4 1 0 0 1 0 … 1 ? ? ? 0 0 0 1 … 0 ? ? 0 … Lineage n 0 ? … 1 … 0 … Lineage 1 0 0
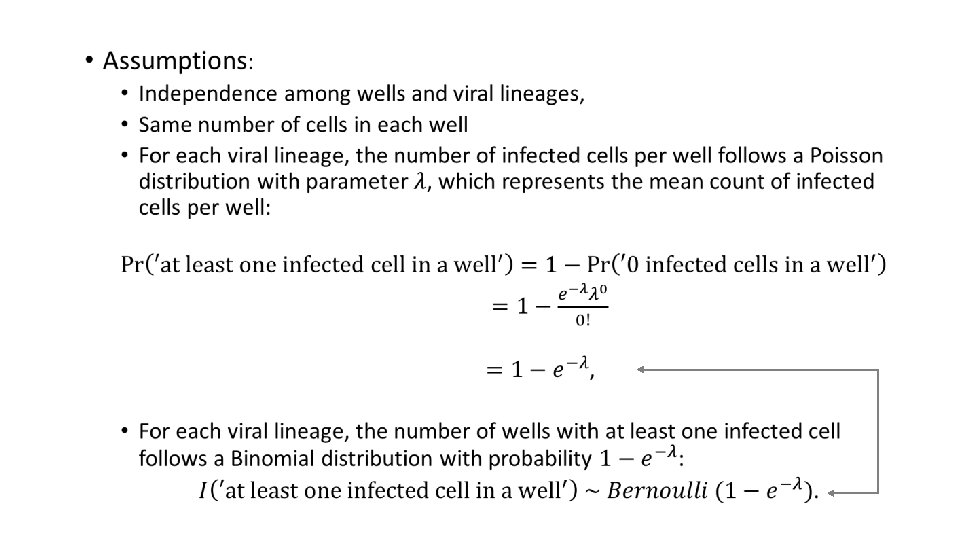
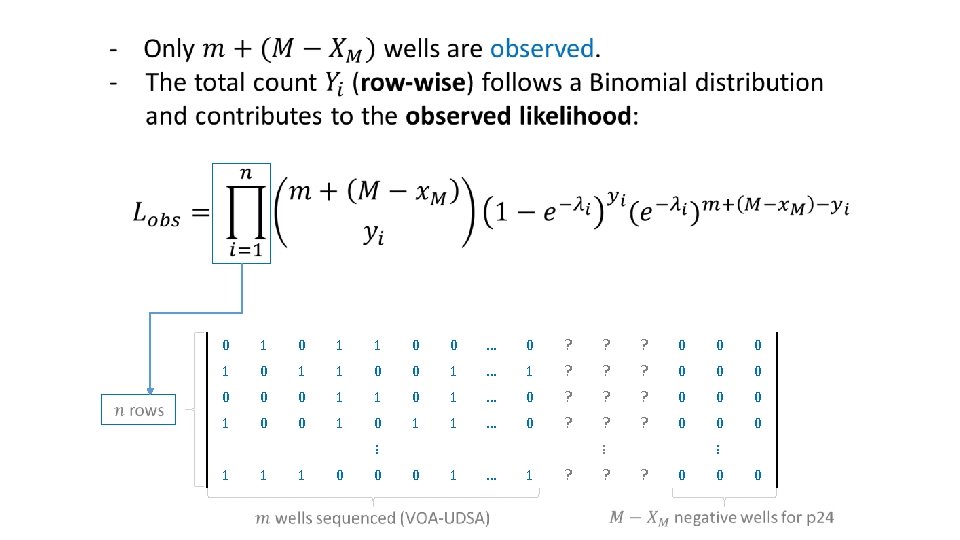
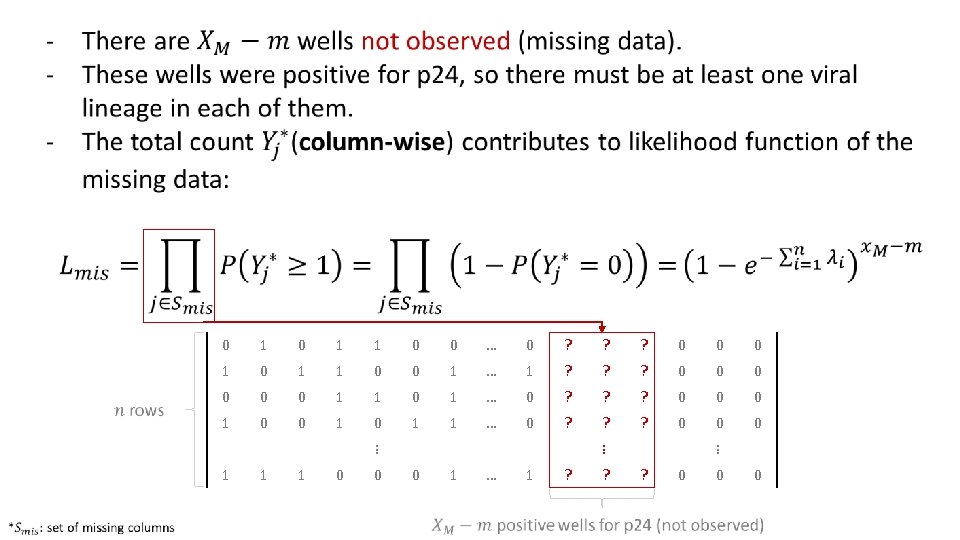
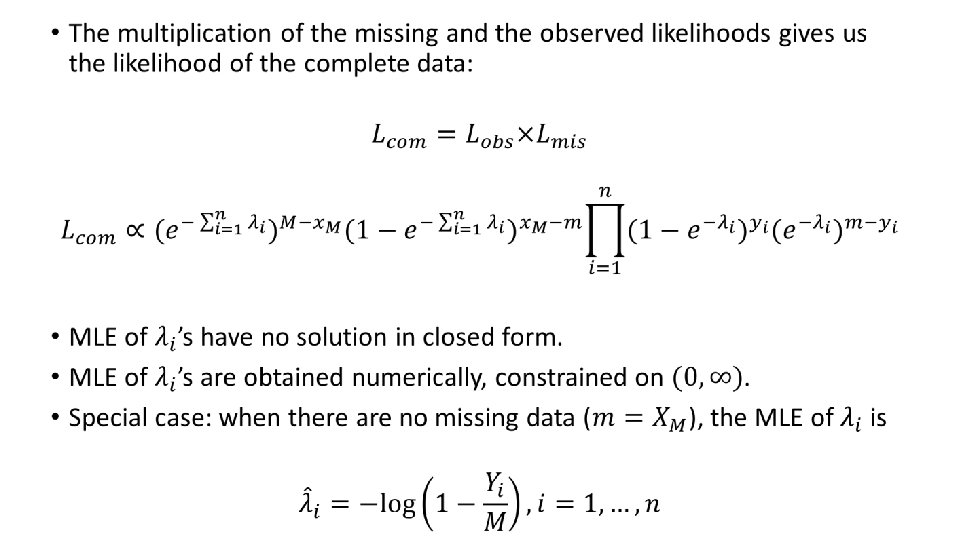
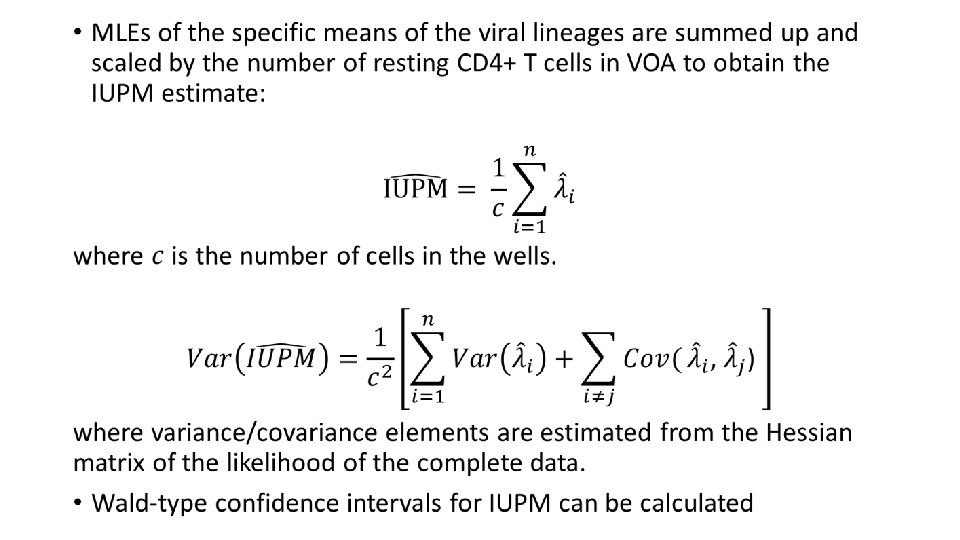
Primer-ID Based Ultra Deep Sequencing Assay (VOA-UDSA) q Extend Myers et al / Trumble et al q Estimate IUPM via maximum likelihood incorporating information about distinct viral lineages and missing data q Assume # of infected cells / well ~ Poisson for each DVL, independence among wells and lineages q Simulation studies evaluating extension q Analysis of data from 17 HIV+ individuals
Notation • 0 1 1 0 0 … 0 ? ? ? 0 0 0 1 1 0 0 1 … 1 ? ? ? 0 0 0 1 1 0 1 … 0 ? ? ? 0 0 0 1 0 1 1 … 0 ? ? ? 0 0 0 1 1 1 0 0 0 1 … 1 ? ? ? 0 0 0
Simulation Study • Data simulated under different scenarios • • Number of wells (VOA-LD): 12, 24, 32 Number of distinct viral lineages: 6, 9, 12 % of wells not sequenced (missing): 0, 15, 50 IUPM for each DVL: 0. 5 • For each possible parameter combination, 1, 000 datasets were simulated.
Simulation Study M n % (missingness) 32 32 32 12 12 9 9 6 6 0 10 15 50 6 6 4. 5 3 3 Relative bias Asymptotic S. E. Empirical S. E. % (coverage) Width 0. 02 0. 03 0. 04 0. 01 0. 02 0. 04 0. 02 0. 03 0. 04 0. 51 0. 53 0. 55 0. 73 0. 44 0. 46 0. 48 0. 61 0. 36 0. 37 0. 38 0. 47 0. 51 0. 53 0. 57 0. 72 0. 43 0. 47 0. 49 0. 64 0. 37 0. 39 0. 51 95. 10 94. 90 94. 00 95. 30 95. 20 95. 30 94. 30 93. 90 95. 40 95. 80 94. 90 94. 50 1. 98 2. 09 2. 17 2. 86 1. 71 1. 80 1. 87 2. 40 1. 47 1. 50 1. 86
Data Analysis • 17 patients on suppressive antiretroviral therapy (ART) • Resting CD 4+ T cells were isolated and QVOA was performed to recover replication competent HIV-1 from those cells. • Deep sequencing was performed in subset of wells positive for p 24 and distinct viral lineages (DVL) were determined. • IUPM calculation (VOA-UDSA).
VOA vs UDSA VOA
N. of cells (in million) QVOA Total wells QVOA p 24+ wells VOA-UDSA wells N. of VL/well N. of DVL % DVL C 1 2. 5 36 4 4 12 3. 00 12 C 2 2. 5 36 5 5 15 3. 00 C 3 2. 5 18 5 5 5 C 4 2. 5 18 5 3 C 5 2. 5 14 4 C 6 2. 5 18 C 7 2. 5 C 8 IUPM-QVOA (95% CI) IUPM-VOA-UDSA (95% CI) 100 0. 04 (0. 017, 0. 120) 0. 14 (0. 077, 0. 238) 7 47 0. 07 (0. 031, 0. 154) 0. 17 (0. 104, 0. 287) 1. 00 4 80 0. 12 (0. 049, 0. 287) 0. 12 (0. 048, 0. 278) 3 1. 00 3 100 0. 14 (0. 064, 0. 321) 0. 12 (0. 051, 0. 293) 3 5 1. 67 3 60 0. 15 (0. 062, 0. 361) 0. 20 (0. 087, 0. 437) 7 6 12 2. 00 4 33 0. 18 (0. 085, 0. 377) 0. 35 (0. 199, 0. 596) 36 15 15 56 3. 73 39 70 0. 22 (0. 134, 0. 360) 0. 64 (0. 492, 0. 830) 2. 5 36 22 22 86 3. 91 26 30 0. 41 (0. 273, 0. 617) 1. 06 (0. 856, 1. 309) C 9 2. 5 12 9 6 11 1. 83 8 73 0. 44 (0. 221, 0. 873) 0. 60 (0. 352, 1. 025) C 10 2. 5 18 12 6 19 3. 17 19 100 0. 54 (0. 323, 0. 912) 0. 73 (0. 490, 1. 099) C 11 2. 5 12 9 6 16 2. 67 9 56 0. 62 (0. 337, 1. 137) 0. 89 (0. 556, 1. 413) C 12 2. 5 36 32 32 123 3. 84 65 53 0. 94 (0. 632, 1. 393) 1. 42 (1. 187, 1. 690) C 13 0. 5 6 4 4 7 1. 75 7 100 1. 24 (0. 743, 2. 084) 2. 55 (1. 216, 5. 360) C 14 0. 5 6 3 3 5 1. 67 3 60 1. 82 (0. 902, 3. 658) 2. 12 (0. 864, 5. 178) C 15 0. 5 6 5 5 9 1. 80 6 67 2. 49 (1. 103, 5. 625) 3. 66 (1. 882, 7. 101) C 16 0. 5 6 4 4 8 2. 00 8 100 2. 52 (1. 158, 5. 462) 2. 92 (1. 457, 5. 839) C 17 0. 5 6 4 4 6 1. 50 6 100 3. 49 (1. 689, 7. 196) 2. 19 (0. 982, 4. 875) Patient ID Spearman correlation: 0. 94 (p<0. 0001)
IUPM: VOA-UDSA strongly correlates with QVOA r=0. 9370 P<0. 0001 IUPM: QVOA
IUPM estimates and 95% confidence intervals Patients
Gain in Precision
Summary q VOA-UDSA leverages information about the # of distinct viruses to quantify the number of resting CD 4+ T cells harboring replication competent HIV-1. q It eliminates (? ) the need for the LD step and reduces the number of cells required compared to QVOA. q Estimates are strongly correlated with IUPM estimates from QVOA (r=0. 94, p<0. 0001).
Summary for the Community q Key question: How do we measure the amount of virus in a person living with HIV? q Key finding: Laboratory assays plus statistical methods and software can be used to accurately measure the amount of virus q Why important? This research is important in evaluating drugs that might cure people living with HIV q Why should we be excited (or not) about this? Well, it’s statistics … q What’s next for this research? Free, easy to use software make these statistical methods readily available to the research community
Acknowledgements q UNC CFAR (Ron Swanstrom) q Collaboratory of AIDS Researchers for Eradication (David Margolis) q Ilana Trumble, Andrew Allmon, Nancie Archin q Joseph Rigdon, Owen Francis, Pedro Baldoni q Sook-Kyung Lee, Shuntai Zhou, Ean Spielvogel q David Margolis, Ronald Swanstrom q Emory Biostatistics!