COPE LEVELS IN MODERN PORTS A Case Study







- Slides: 53
COPE LEVELS IN MODERN PORTS: A Case Study for the Port of Ngqura 10 July 2019 CSIR International Convention Center, Pretoria, South Africa T. Ahmed and K. Mutombo
INTRODUCTION
Introduction • Ports are affected by uncertainties in their futures › Climate change impacts, › New generation vessels. • The inability to adapt will lead to huge consequences for a port. • Traditional practices in port planning have remained static and a new approach is needed. Southern African Transport Conference, 08 to 11 July 2019 Strictly private and confidential 2
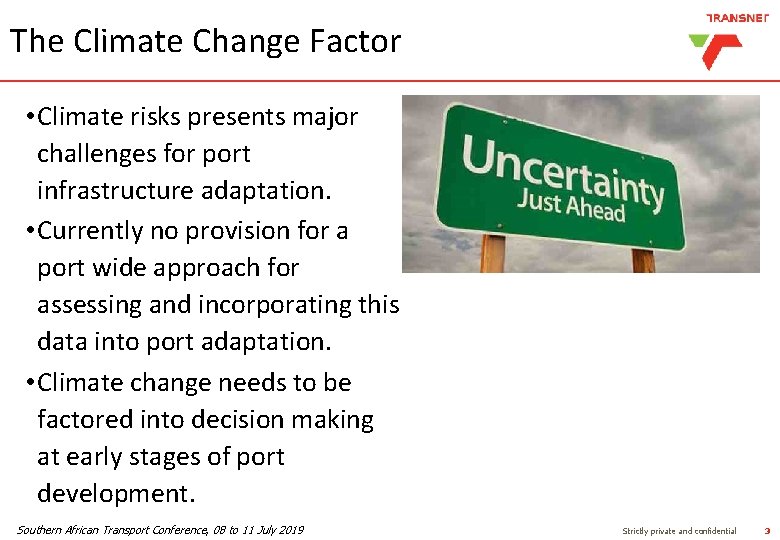
The Climate Change Factor • Climate risks presents major challenges for port infrastructure adaptation. • Currently no provision for a port wide approach for assessing and incorporating this data into port adaptation. • Climate change needs to be factored into decision making at early stages of port development. Southern African Transport Conference, 08 to 11 July 2019 Strictly private and confidential 3
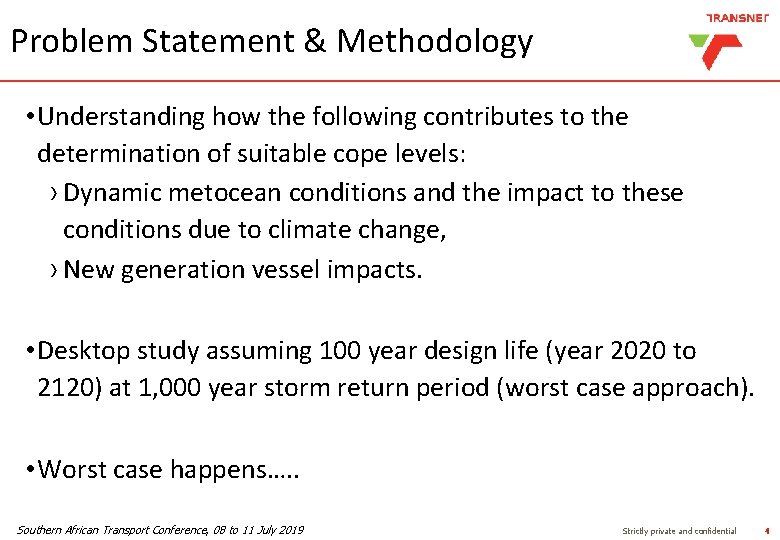
Problem Statement & Methodology • Understanding how the following contributes to the determination of suitable cope levels: › Dynamic metocean conditions and the impact to these conditions due to climate change, › New generation vessel impacts. • Desktop study assuming 100 year design life (year 2020 to 2120) at 1, 000 year storm return period (worst case approach). • Worst case happens…. . Southern African Transport Conference, 08 to 11 July 2019 Strictly private and confidential 4
Worst Case Events Port Elizabeth September 2008 Southern African Transport Conference, 08 to 11 July 2019 Strictly private and confidential 5
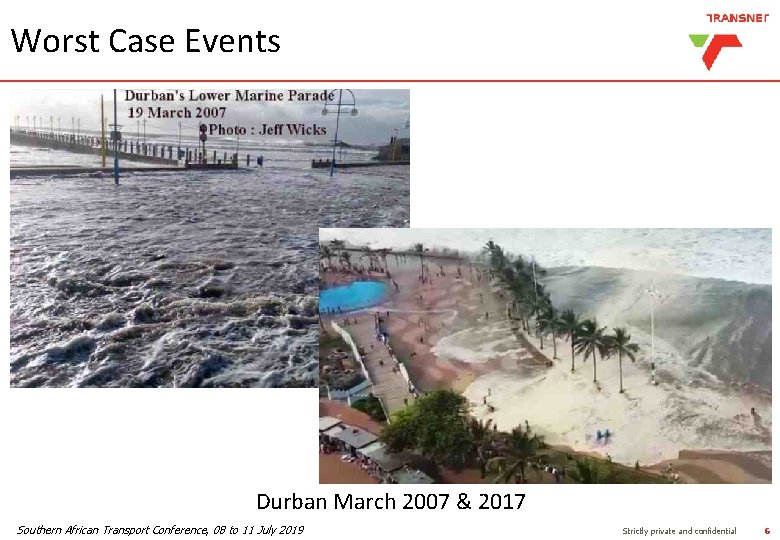
Worst Case Events Durban March 2007 & 2017 Southern African Transport Conference, 08 to 11 July 2019 Strictly private and confidential 6
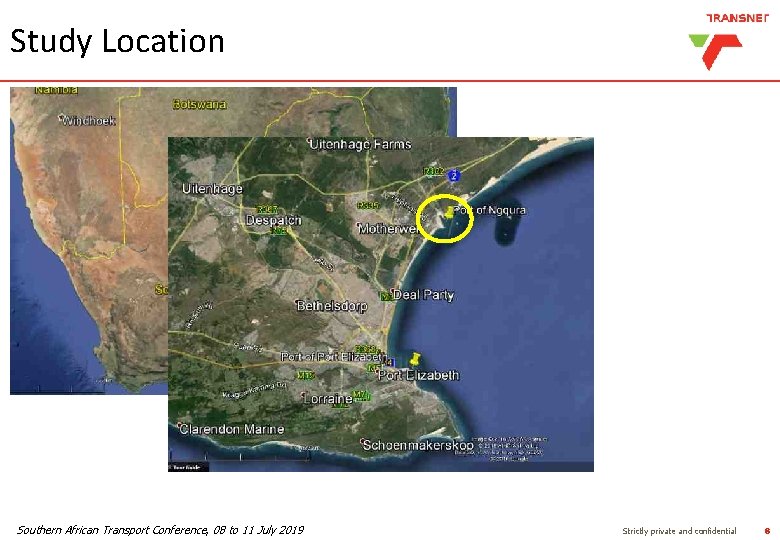
Study Location Southern African Transport Conference, 08 to 11 July 2019 Strictly private and confidential 7
Study Location Southern African Transport Conference, 08 to 11 July 2019 Strictly private and confidential 8
Study Location Southern African Transport Conference, 08 to 11 July 2019 Strictly private and confidential 9
Study Area Southern African Transport Conference, 08 to 11 July 2019 Strictly private and confidential 10
Study Area Southern African Transport Conference, 08 to 11 July 2019 Strictly private and confidential 11
Introduction - Port of Ngqura • A deep-water port (-18. 0 m and -16. 0 m) and 8 th addition to South Africa’s commercial ports. • Promulgated in 1998 and constructed from 2006 to 2009 (Phase 1) and then 2009 to 2012 (Phase 2). • 20 km east of the Port of Port Elizabeth. • Currently handling containers and exporting manganese (skips). • Manganese, bulk liquid and LNG terminals planned for the future. Southern African Transport Conference, 08 to 11 July 2019 Strictly private and confidential 12
Introduction - Port Planning • Ligteringen & Velsink, 2012: › Technical, environmental, nautical and economic factors need to be considered in the planning of port infrastructure. › The infrastructure needs to be designed for a dynamic marine environment. › For a port to be economically viable, its infrastructure should be carefully planned considering all dynamic aspects. Southern African Transport Conference, 08 to 11 July 2019 Strictly private and confidential 13
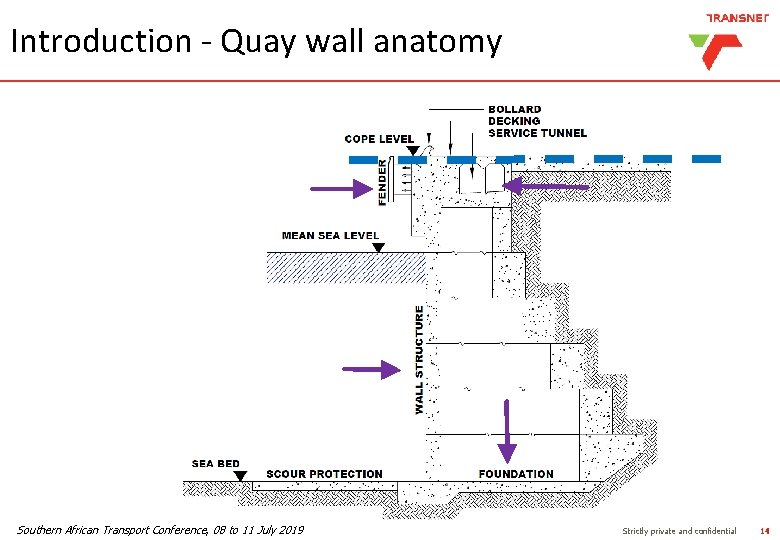
Introduction - Quay wall anatomy Southern African Transport Conference, 08 to 11 July 2019 Strictly private and confidential 14
COPE LEVEL DETERMINATION ELEMENTS
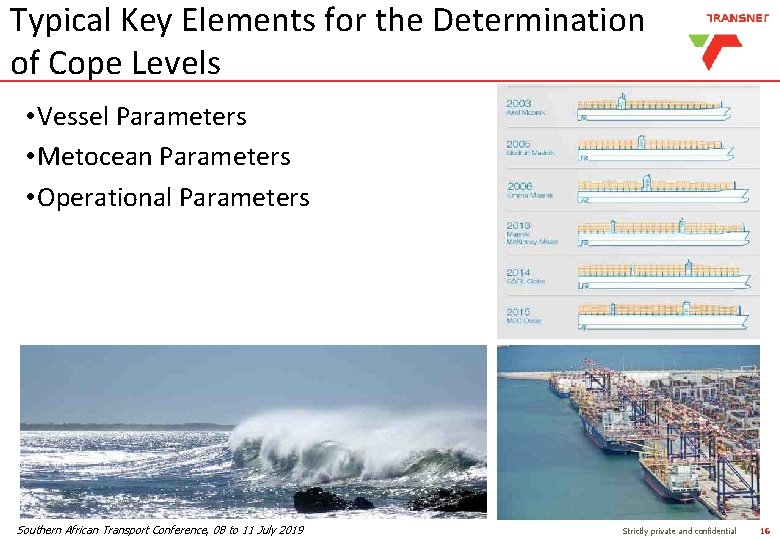
Typical Key Elements for the Determination of Cope Levels • Vessel Parameters • Metocean Parameters • Operational Parameters Southern African Transport Conference, 08 to 11 July 2019 Strictly private and confidential 16
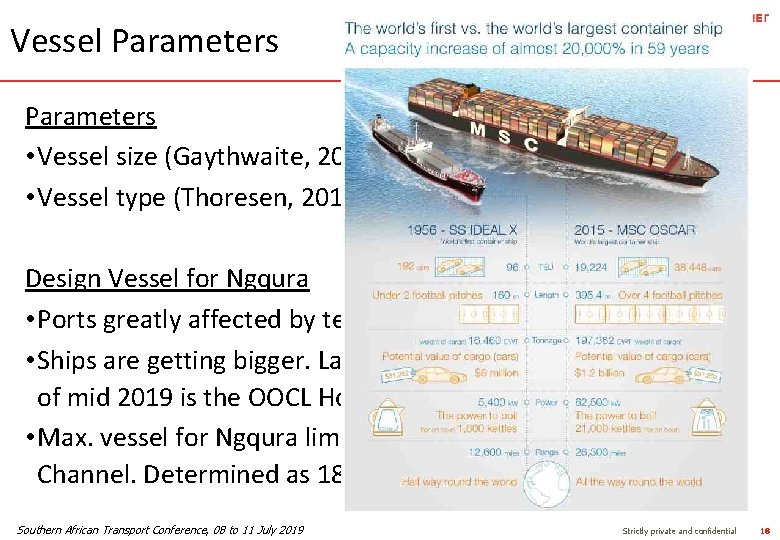
Vessel Parameters • Vessel size (Gaythwaite, 2004), • Vessel type (Thoresen, 2014). Design Vessel for Ngqura • Ports greatly affected by technological advances in ship design. • Ships are getting bigger. Largest container vessel produced as of mid 2019 is the OOCL Hong Kong at 21, 413 TEU. • Max. vessel for Ngqura limited to width of future Coega River Channel. Determined as 18, 000 TEU. Southern African Transport Conference, 08 to 11 July 2019 Strictly private and confidential 17
Vessel Parameters • Vessel size (Gaythwaite, 2004), • Vessel type (Thoresen, 2014). Design Vessel for Ngqura • Ports greatly affected by technological advances in ship design. • Ships are getting bigger. Largest container vessel produced as of mid 2019 is the OOCL Hong Kong at 21, 413 TEU. • Max. vessel for Ngqura limited to width of future Coega River Channel. Determined as 18, 000 TEU. Southern African Transport Conference, 08 to 11 July 2019 Strictly private and confidential 18
Metocean (wind & wave) Parameters • Astronomical tidal range (GHK, 2004), • Highest observed tidal (Thoresen, 2014) • Wind-raised water level in the harbour (Thoresen, 2014), • Wave action in the harbour (Mutombo & Olcer, 2016), • Wave crest heights (Gaythwaite, 2004), • Surging in the harbour (Gaythwaite, 2004) • Extreme water levels (GHK, 2004) • Sea level rise to be expected (Mutombo, 2014) • Normal and extreme wind conditions (Mutombo, 2014), • Frequency and probability of storm conditions (TRB, 2008), • Fluvial impacts of river floods (ROM 3. 1 -99, 2007). Southern African Transport Conference, 08 to 11 July 2019 Strictly private and confidential 19
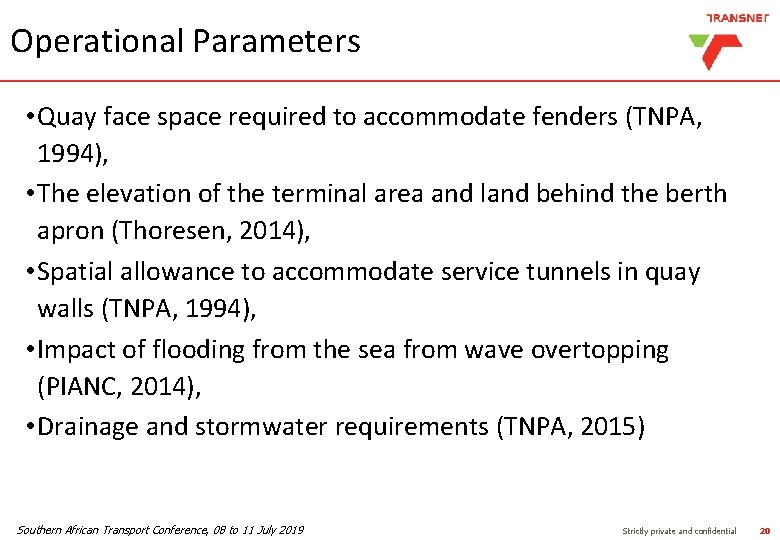
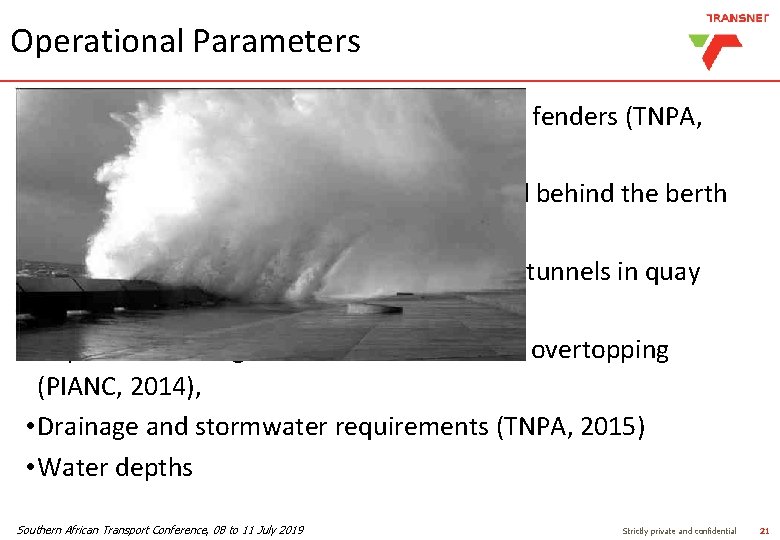
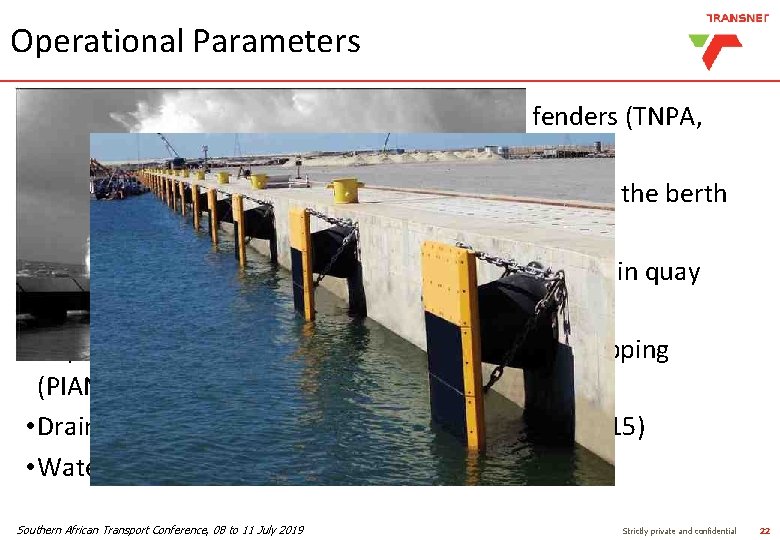
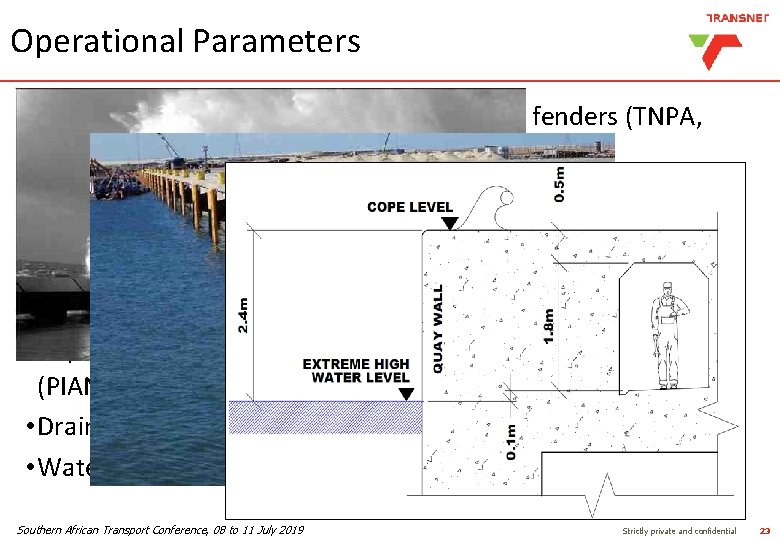
Operational Parameters • Quay face space required to accommodate fenders (TNPA, 1994), • The elevation of the terminal area and land behind the berth apron (Thoresen, 2014), • Spatial allowance to accommodate service tunnels in quay walls (TNPA, 1994), • Impact of flooding from the sea from wave overtopping (PIANC, 2014), • Drainage and stormwater requirements (TNPA, 2015) Southern African Transport Conference, 08 to 11 July 2019 Strictly private and confidential 20
Operational Parameters • Quay face space required to accommodate fenders (TNPA, 1994), • The elevation of the terminal area and land behind the berth apron (Thoresen, 2014), • Spatial allowance to accommodate service tunnels in quay walls (TNPA, 1994), • Impact of flooding from the sea from wave overtopping (PIANC, 2014), • Drainage and stormwater requirements (TNPA, 2015) • Water depths Southern African Transport Conference, 08 to 11 July 2019 Strictly private and confidential 21
Operational Parameters • Quay face space required to accommodate fenders (TNPA, 1994), • The elevation of the terminal area and land behind the berth apron (Thoresen, 2014), • Spatial allowance to accommodate service tunnels in quay walls (TNPA, 1994), • Impact of flooding from the sea from wave overtopping (PIANC, 2014), • Drainage and stormwater requirements (TNPA, 2015) • Water depths Southern African Transport Conference, 08 to 11 July 2019 Strictly private and confidential 22
Operational Parameters • Quay face space required to accommodate fenders (TNPA, 1994), • The elevation of the terminal area and land behind the berth apron (Thoresen, 2014), • Spatial allowance to accommodate service tunnels in quay walls (TNPA, 1994), • Impact of flooding from the sea from wave overtopping (PIANC, 2014), • Drainage and stormwater requirements (TNPA, 2015) • Water depths Southern African Transport Conference, 08 to 11 July 2019 Strictly private and confidential 23
CLIMATE CHANGE
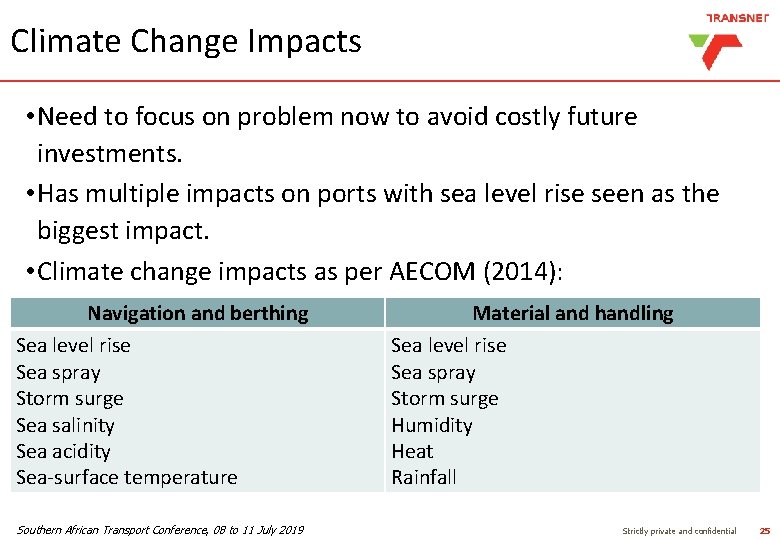
Climate Change Impacts • Need to focus on problem now to avoid costly future investments. • Has multiple impacts on ports with sea level rise seen as the biggest impact. • Climate change impacts as per AECOM (2014): Navigation and berthing Sea level rise Sea spray Storm surge Sea salinity Sea acidity Sea-surface temperature Southern African Transport Conference, 08 to 11 July 2019 Material and handling Sea level rise Sea spray Storm surge Humidity Heat Rainfall Strictly private and confidential 25
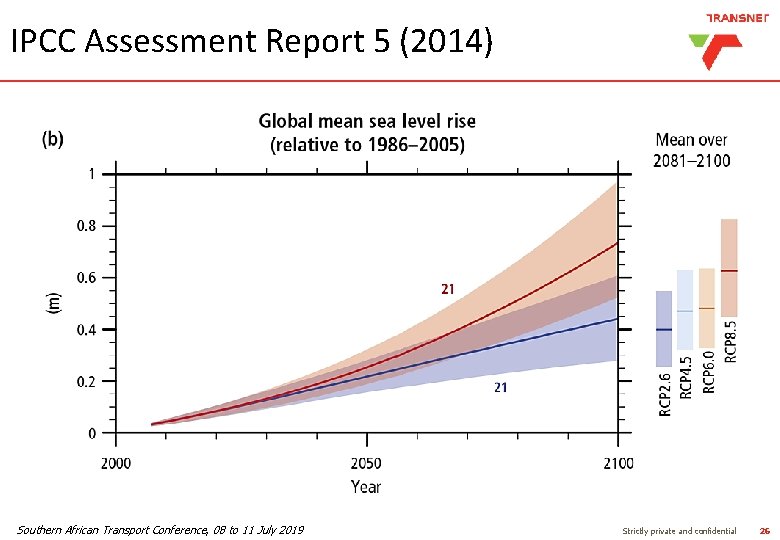
IPCC Assessment Report 5 (2014) Southern African Transport Conference, 08 to 11 July 2019 Strictly private and confidential 26
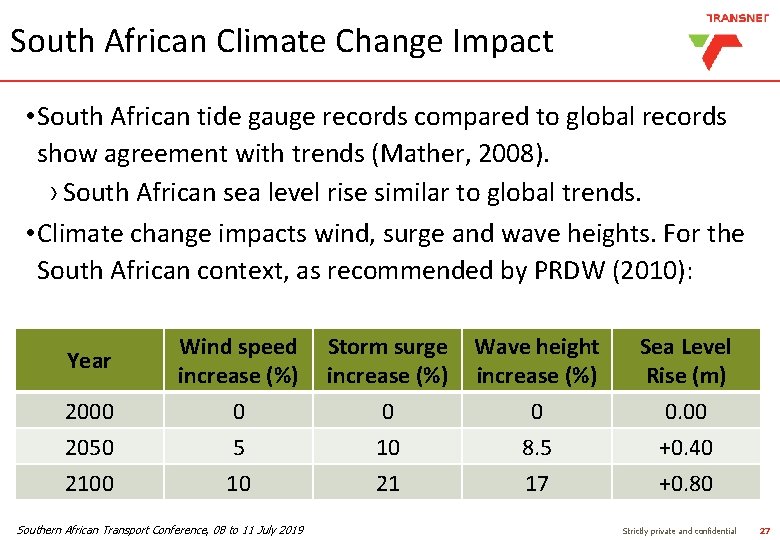
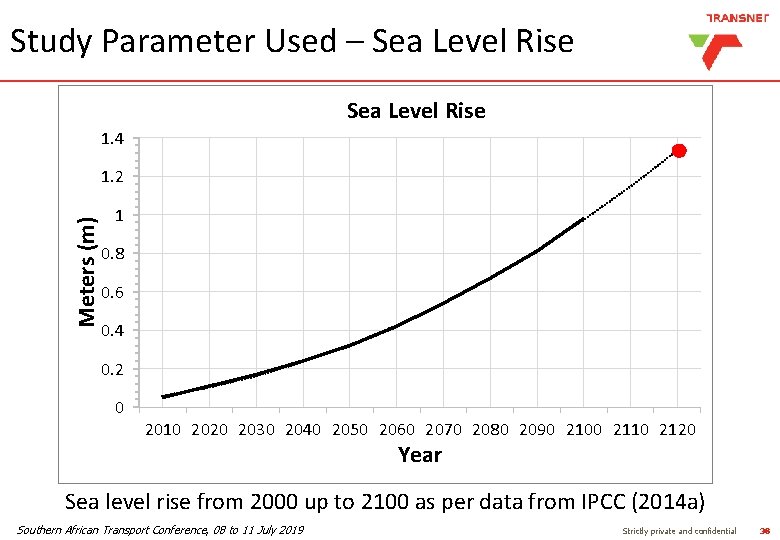
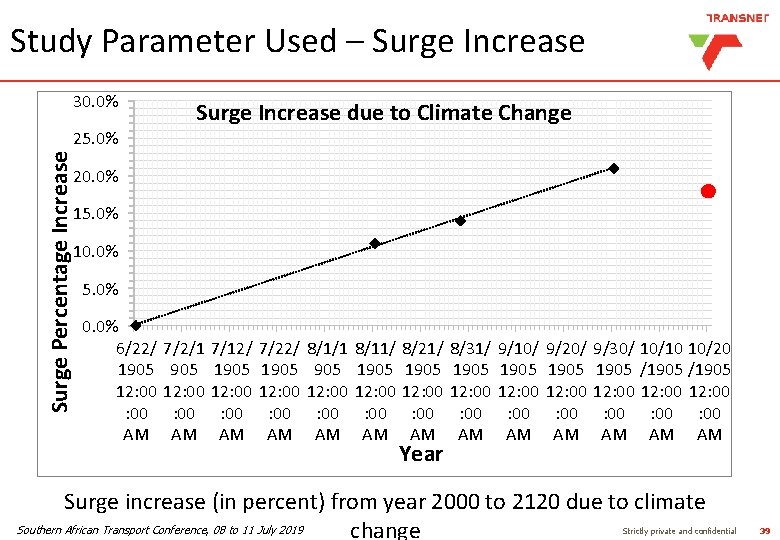
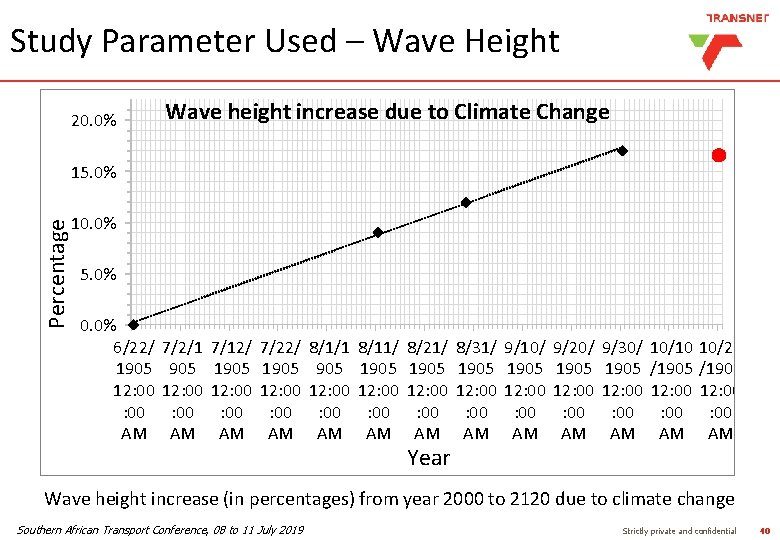
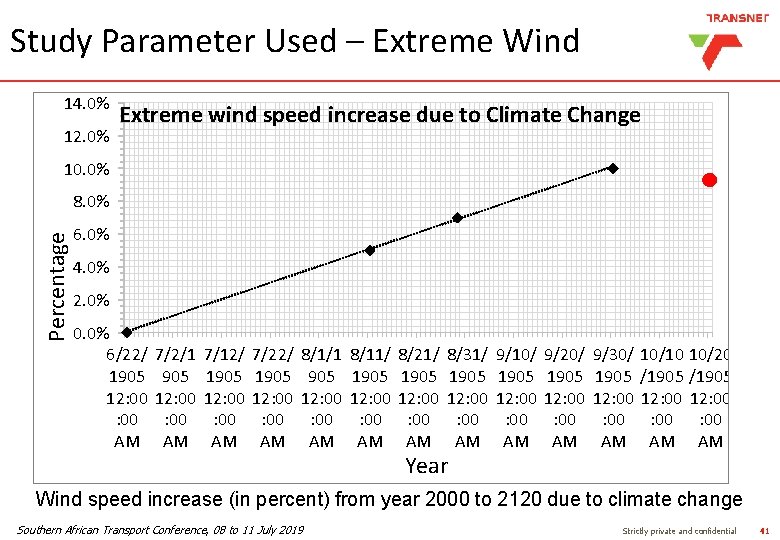
South African Climate Change Impact • South African tide gauge records compared to global records show agreement with trends (Mather, 2008). › South African sea level rise similar to global trends. • Climate change impacts wind, surge and wave heights. For the South African context, as recommended by PRDW (2010): Year Wind speed increase (%) Storm surge increase (%) Wave height increase (%) Sea Level Rise (m) 2000 2050 2100 0 5 10 0 10 21 0 8. 5 17 0. 00 +0. 40 +0. 80 Southern African Transport Conference, 08 to 11 July 2019 Strictly private and confidential 27
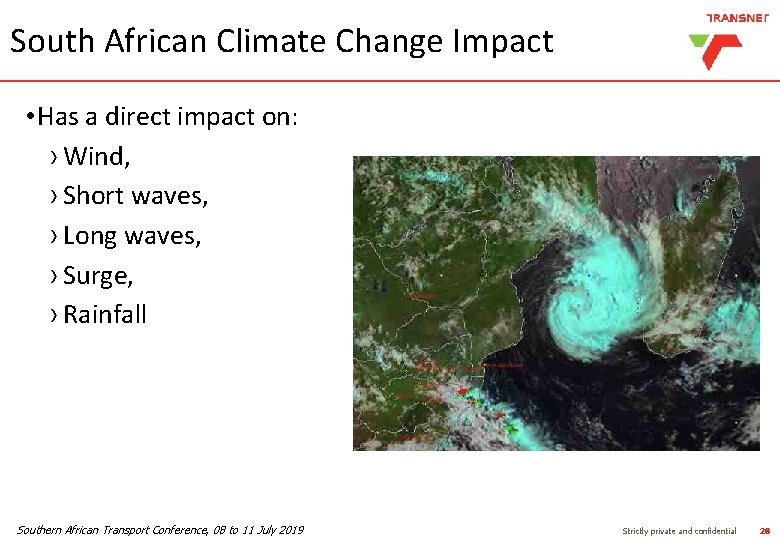
South African Climate Change Impact • Has a direct impact on: › Wind, › Short waves, › Long waves, › Surge, › Rainfall Southern African Transport Conference, 08 to 11 July 2019 Strictly private and confidential 28
WATER LEVEL DESIGN
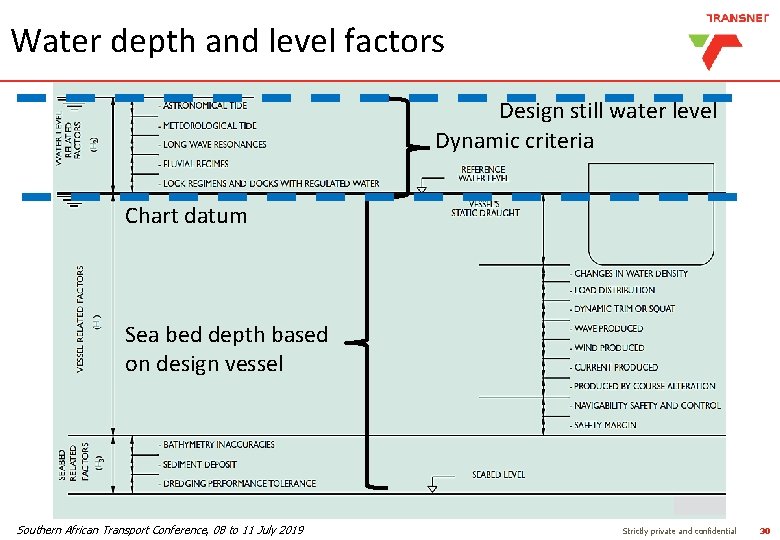
Water depth and level factors Design still water level Dynamic criteria Chart datum Sea bed depth based on design vessel Southern African Transport Conference, 08 to 11 July 2019 Strictly private and confidential 30
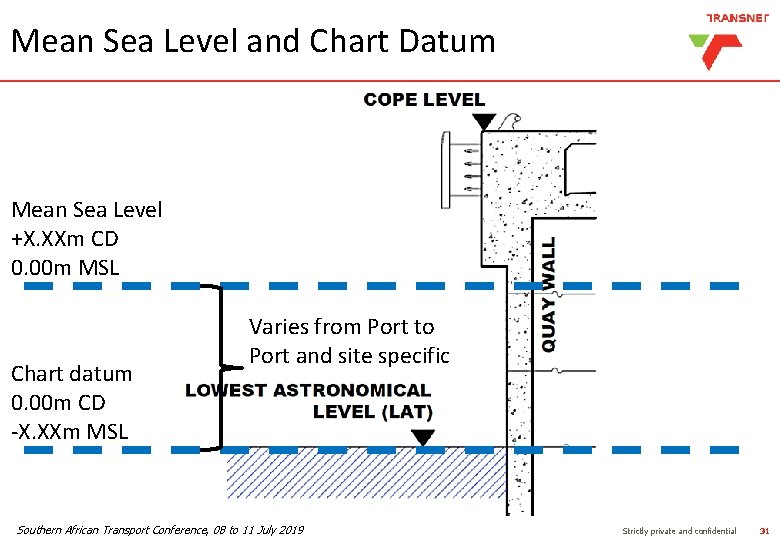
Mean Sea Level and Chart Datum Mean Sea Level +X. XXm CD 0. 00 m MSL Chart datum 0. 00 m CD -X. XXm MSL Varies from Port to Port and site specific Southern African Transport Conference, 08 to 11 July 2019 Strictly private and confidential 31
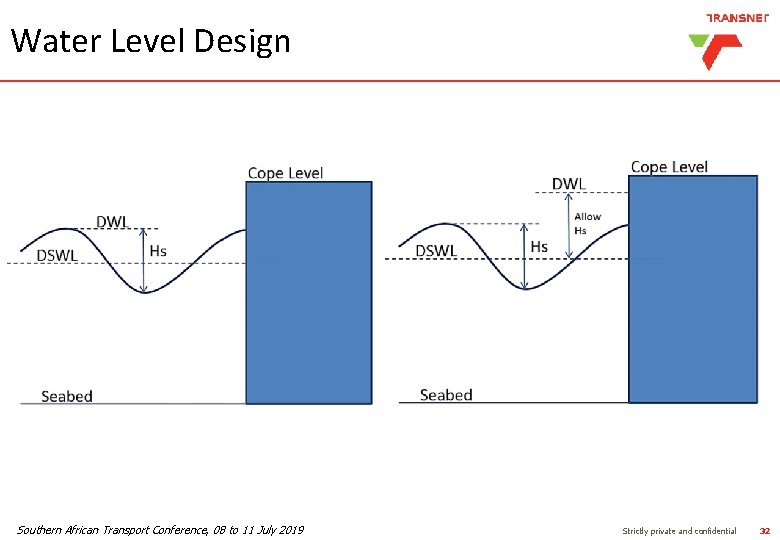
Water Level Design Southern African Transport Conference, 08 to 11 July 2019 Strictly private and confidential 32
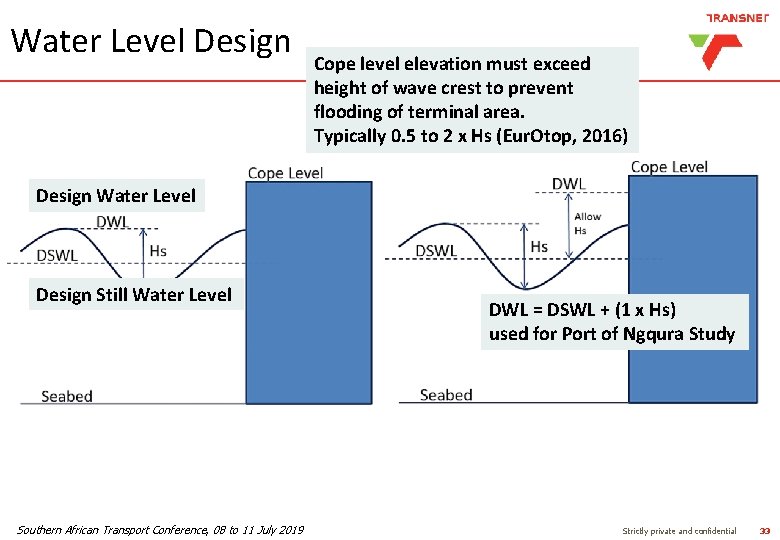
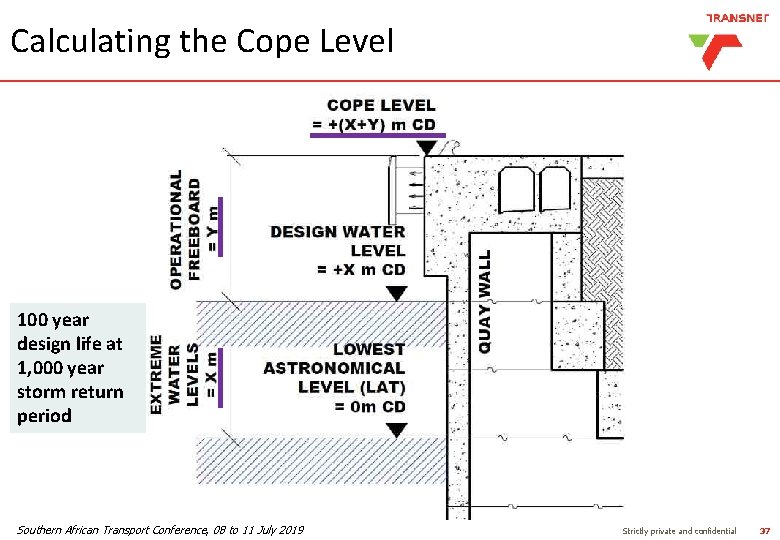
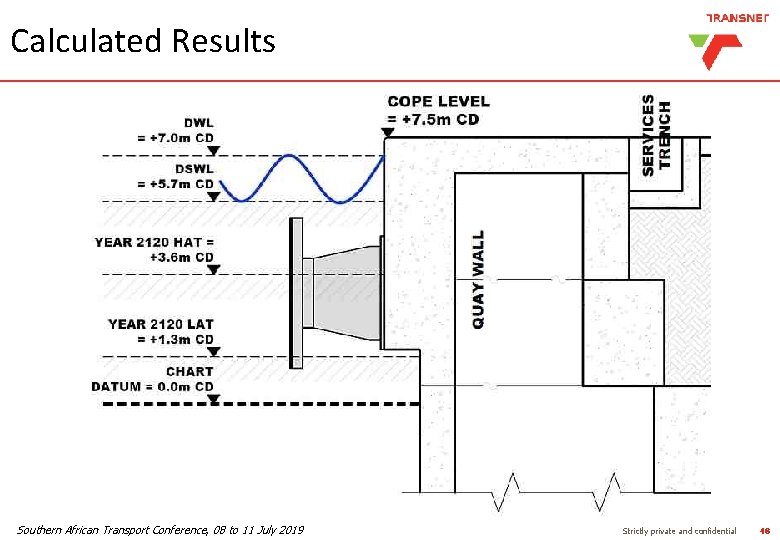
Water Level Design Cope level elevation must exceed height of wave crest to prevent flooding of terminal area. Typically 0. 5 to 2 x Hs (Eur. Otop, 2016) Design Water Level Design Still Water Level Southern African Transport Conference, 08 to 11 July 2019 DWL = DSWL + (1 x Hs) used for Port of Ngqura Study Strictly private and confidential 33
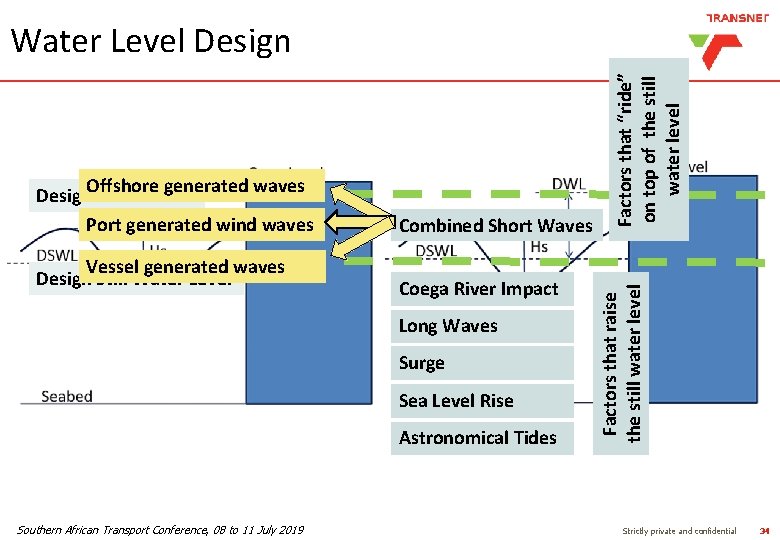
Vessel generated waves Design Still Water Level Combined Short Waves Coega River Impact Long Waves Surge Sea Level Rise Astronomical Tides Southern African Transport Conference, 08 to 11 July 2019 Factors that raise the still water level Offshore generated waves Design Water Level Port generated wind waves Factors that “ride” on top of the still water level Water Level Design Strictly private and confidential 34
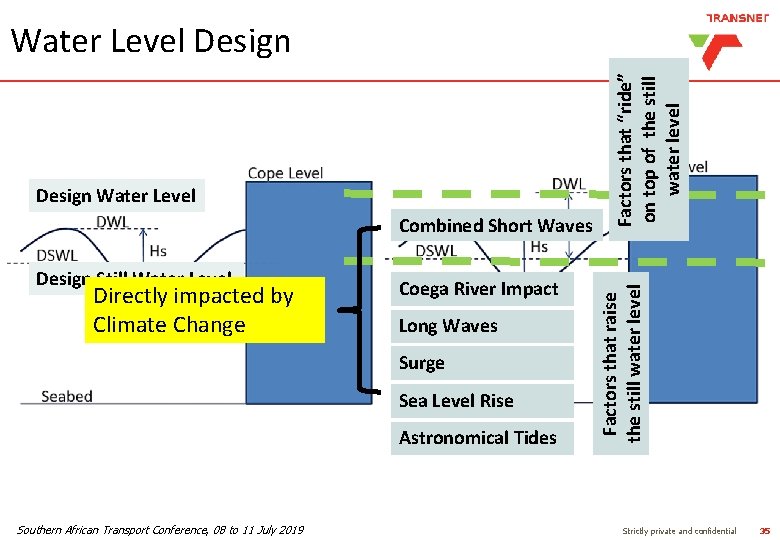
Combined Short Waves Design Still Water Level Directly impacted by Climate Change Coega River Impact Long Waves Surge Sea Level Rise Astronomical Tides Southern African Transport Conference, 08 to 11 July 2019 Factors that raise the still water level Design Water Level Factors that “ride” on top of the still water level Water Level Design Strictly private and confidential 35
CALCULATING THE COPE LEVEL
Calculating the Cope Level 100 year design life at 1, 000 year storm return period Southern African Transport Conference, 08 to 11 July 2019 Strictly private and confidential 37
Study Parameter Used – Sea Level Rise 1. 4 Meters (m) 1. 2 1 0. 8 0. 6 0. 4 0. 2 0 2010 2020 2030 2040 2050 2060 2070 2080 2090 2100 2110 2120 Year Sea level rise from 2000 up to 2100 as per data from IPCC (2014 a) Southern African Transport Conference, 08 to 11 July 2019 Strictly private and confidential 38
Study Parameter Used – Surge Increase 30. 0% Surge Increase due to Climate Change Surge Percentage Increase 25. 0% 20. 0% 15. 0% 10. 0% 5. 0% 0. 0% 6/22/ 1905 12: 00 AM 7/2/1 905 12: 00 AM 7/12/ 1905 12: 00 AM 7/22/ 1905 12: 00 AM 8/1/1 905 12: 00 AM 8/11/ 1905 12: 00 AM 8/21/ 1905 12: 00 AM Year 8/31/ 1905 12: 00 AM 9/10/ 1905 12: 00 AM 9/20/ 1905 12: 00 AM 9/30/ 10/10 10/20 1905 /1905 12: 00 : 00 AM AM AM Surge increase (in percent) from year 2000 to 2120 due to climate Southern African Transport Conference, 08 to 11 July 2019 change Strictly private and confidential 39
Study Parameter Used – Wave Height 20. 0% Wave height increase due to Climate Change Percentage 15. 0% 10. 0% 5. 0% 0. 0% 6/22/ 1905 12: 00 AM 7/2/1 905 12: 00 AM 7/12/ 1905 12: 00 AM 7/22/ 1905 12: 00 AM 8/1/1 905 12: 00 AM 8/11/ 1905 12: 00 AM 8/21/ 1905 12: 00 AM Year 8/31/ 1905 12: 00 AM 9/10/ 1905 12: 00 AM 9/20/ 1905 12: 00 AM 9/30/ 1905 12: 00 AM 10/10 /1905 12: 00 AM 10/20 /1905 12: 00 AM Wave height increase (in percentages) from year 2000 to 2120 due to climate change Southern African Transport Conference, 08 to 11 July 2019 Strictly private and confidential 40
Study Parameter Used – Extreme Wind 14. 0% 12. 0% Extreme wind speed increase due to Climate Change 10. 0% Percentage 8. 0% 6. 0% 4. 0% 2. 0% 0. 0% 6/22/ 1905 12: 00 AM 7/2/1 905 12: 00 AM 7/12/ 1905 12: 00 AM 7/22/ 1905 12: 00 AM 8/1/1 905 12: 00 AM 8/11/ 1905 12: 00 AM 8/21/ 1905 12: 00 AM 8/31/ 1905 12: 00 AM Year 9/10/ 1905 12: 00 AM 9/20/ 1905 12: 00 AM 9/30/ 1905 12: 00 AM 10/10 10/20 /1905 12: 00 AM AM Wind speed increase (in percent) from year 2000 to 2120 due to climate change Southern African Transport Conference, 08 to 11 July 2019 Strictly private and confidential 41
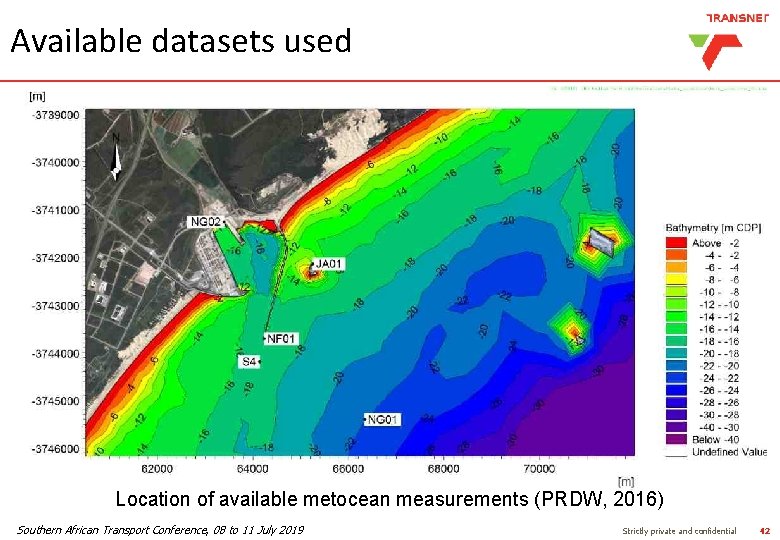
Available datasets used Location of available metocean measurements (PRDW, 2016) Southern African Transport Conference, 08 to 11 July 2019 Strictly private and confidential 42
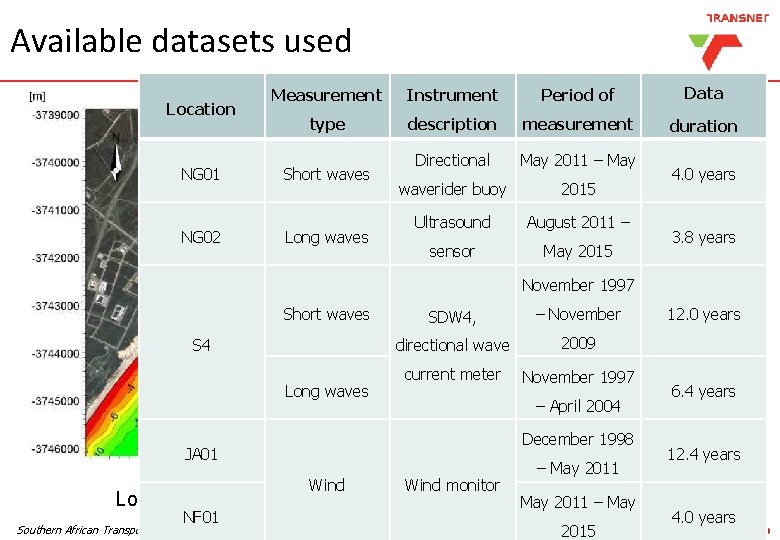
Available datasets used Location Measurement Instrument Period of Data type description measurement duration Directional May 2011 – May waverider buoy 2015 Ultrasound August 2011 – sensor May 2015 NG 01 Short waves NG 02 Long waves 4. 0 years 3. 8 years November 1997 Short waves S 4 Long waves SDW 4, – November directional wave 2009 current meter November 1997 – April 2004 December 1998 JA 01 Wind monitor – May 2011 Location of available metocean measurements. May 2011 – May (PRDW, 2016) NF 01 Southern African Transport Conference, 08 to 11 July 2019 2015 12. 0 years 6. 4 years 12. 4 years 4. 0 years Strictly private and confidential 43
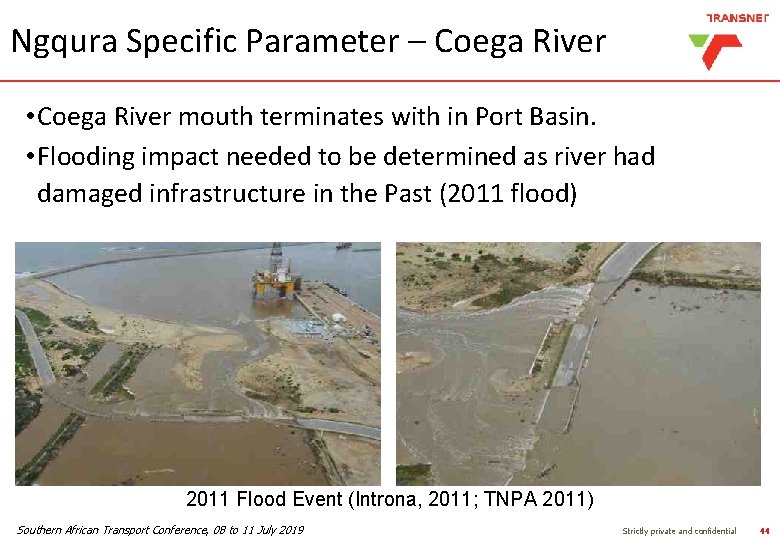
Ngqura Specific Parameter – Coega River • Coega River mouth terminates with in Port Basin. • Flooding impact needed to be determined as river had damaged infrastructure in the Past (2011 flood) 2011 Flood Event (Introna, 2011; TNPA 2011) Southern African Transport Conference, 08 to 11 July 2019 Strictly private and confidential 44
RESULTS
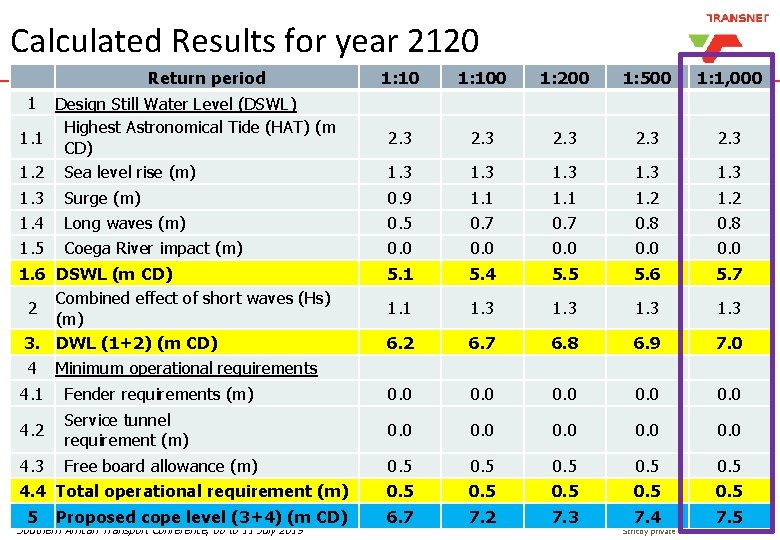
Calculated Results for year 2120 Return period 1 1. 2 1. 3 1. 4 1. 5 1. 6 2 3. 4 4. 1 4. 2 Design Still Water Level (DSWL) Highest Astronomical Tide (HAT) (m CD) Sea level rise (m) Surge (m) Long waves (m) Coega River impact (m) DSWL (m CD) Combined effect of short waves (Hs) (m) DWL (1+2) (m CD) Minimum operational requirements Fender requirements (m) Service tunnel requirement (m) 4. 3 Free board allowance (m) 4. 4 Total operational requirement (m) 5 Proposed cope level (3+4) (m CD) Southern African Transport Conference, 08 to 11 July 2019 1: 100 1: 200 1: 500 1: 1, 000 2. 3 2. 3 1. 3 0. 9 0. 5 0. 0 5. 1 1. 3 1. 1 0. 7 0. 0 5. 4 1. 3 1. 1 0. 7 0. 0 5. 5 1. 3 1. 2 0. 8 0. 0 5. 6 1. 3 1. 2 0. 8 0. 0 5. 7 1. 1 1. 3 6. 2 0. 0 6. 7 0. 0 6. 8 0. 0 6. 9 0. 0 7. 0 0. 0 0. 5 6. 7 0. 5 7. 2 0. 5 7. 3 0. 5 7. 4 0. 5 7. 5 Strictly private and confidential 46
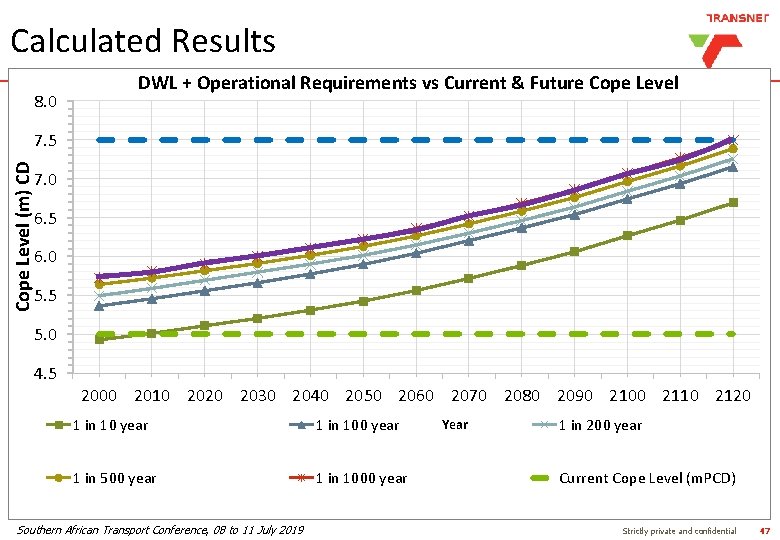
Calculated Results 8. 0 DWL + Operational Requirements vs Current & Future Cope Level (m) CD 7. 5 7. 0 6. 5 6. 0 5. 5 5. 0 4. 5 2000 2010 2020 2030 2040 2050 2060 2070 2080 2090 2100 2110 2120 1 in 10 year 1 in 100 year 1 in 500 year 1 in 1000 year Southern African Transport Conference, 08 to 11 July 2019 Year 1 in 200 year Current Cope Level (m. PCD) Strictly private and confidential 47
Calculated Results Southern African Transport Conference, 08 to 11 July 2019 Strictly private and confidential 48
CASE STUDY FINDINGS AND CONCLUSION
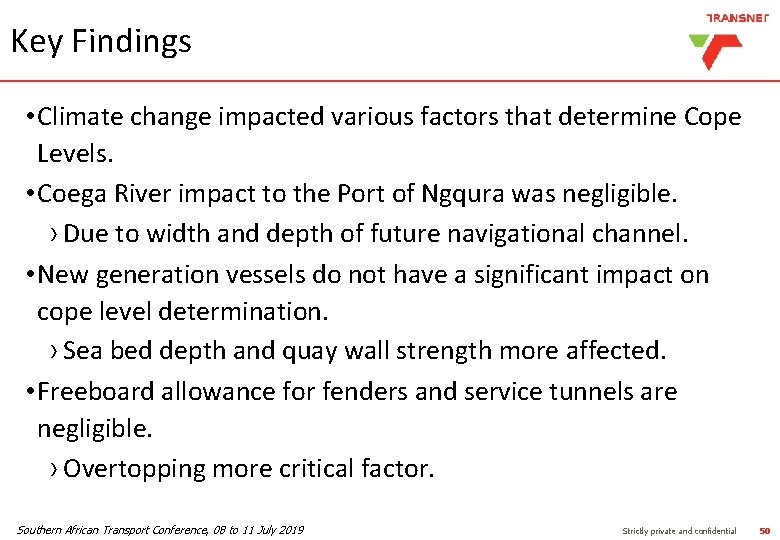
Key Findings • Climate change impacted various factors that determine Cope Levels. • Coega River impact to the Port of Ngqura was negligible. › Due to width and depth of future navigational channel. • New generation vessels do not have a significant impact on cope level determination. › Sea bed depth and quay wall strength more affected. • Freeboard allowance for fenders and service tunnels are negligible. › Overtopping more critical factor. Southern African Transport Conference, 08 to 11 July 2019 Strictly private and confidential 50
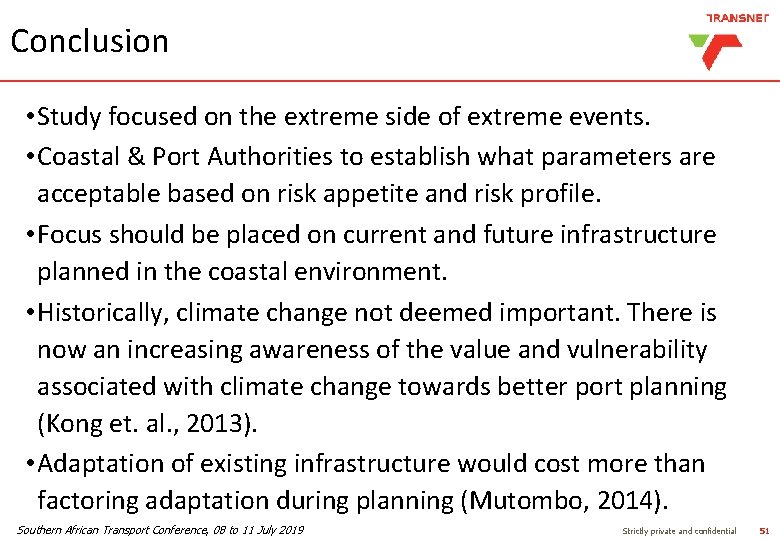
Conclusion • Study focused on the extreme side of extreme events. • Coastal & Port Authorities to establish what parameters are acceptable based on risk appetite and risk profile. • Focus should be placed on current and future infrastructure planned in the coastal environment. • Historically, climate change not deemed important. There is now an increasing awareness of the value and vulnerability associated with climate change towards better port planning (Kong et. al. , 2013). • Adaptation of existing infrastructure would cost more than factoring adaptation during planning (Mutombo, 2014). Southern African Transport Conference, 08 to 11 July 2019 Strictly private and confidential 51
Thank You Questions Tauqeer Ahmed Tauqeer. Ahmed@Transnet. net 072 392 0548 041 507 8525