Comparison of Aircraft and Radiosonde Data with Implications


 • Vertical temperature bias profiles for different AMDAR aircraft types • Wind")


 on the next")


 • Experiment I 64 used the operational 64 sigma levels")


- Slides: 71
Comparison of Aircraft and Radiosonde Data with Implications for Bias Correction Dr. Bradley Ballish NCEP/NCO/PMB 21 November 2006 “Where America’s Climate and Weather Services Begin”
Overview • • • Introduction Temperature bias time series Saha web site Stages of bias differences Aircraft temperature bias factors Aircraft temperature scatter plot Possible subgroup evidence Aircraft to aircraft collocation stats Sonde aircraft collocation stats Vertical temperature bias profiles for different ACARS aircraft types
Overview (Continued) • Vertical temperature bias profiles for different AMDAR aircraft types • Wind speed biases for ACARS and sonde data • RMS wind differences for different ACARS types • Wind speed biases for European AMDAR data • Vertical interpolation experiments • Bias correction issues • Draft plan for bias correction testing • Acknowledgements • Summary • Extra examples
Introduction • At the January 2006 AMS meeting, it was shown that aircraft classes (ACARS, AMDAR and AIREPS) are warm near the jet and sondes cold, see http: //ams. confex. com/ams/Annual 2006/techprogram/p aper_103076. htm for more information • New information on temperatures is provided here along with wind statistics • Analysis is made on the cause of some of the biases along with discussion on bias correction and possible improvement in model vertical resolution
Temperature Bias Time Series • The next 4 slides show temperature biases versus time for all non gross data for sondes, AIREPS, ACARS and AMDAR types from 300 to 200 h. Pa
Monthly Average Temperature Biases 300 to 200 h. Pa 00 Z
Monthly Average Temperature Biases 300 to 200 h. Pa 12 Z
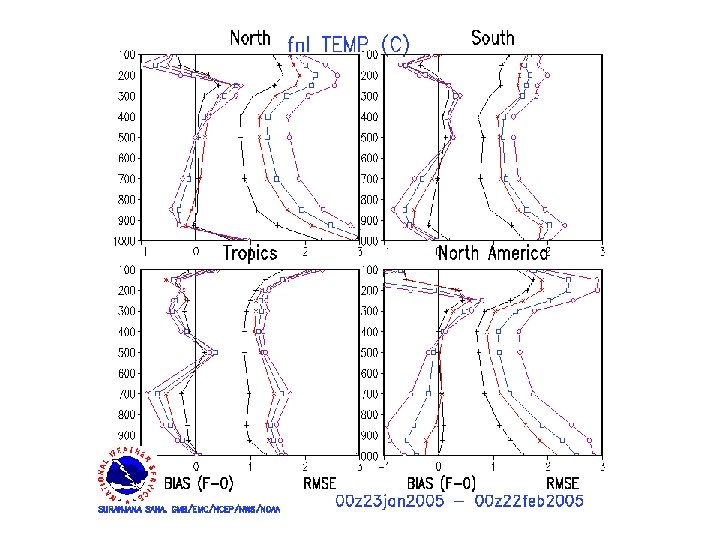
Saha Web Site • It is useful to look at temperature bias profiles in Suru Saha’s web site http: //wwwt. emc. ncep. noaa. gov/gmb/ssaha/ • Note that the cold bias around 250 h. Pa has been there for a long time and is biggest in winter and varies with location • The warm bias around 150 h. Pa is small as of June 2005, which has implications for bias correction • Bias correction could decrease beneficial analysis correction of guess • An example from January and February 2005 is shown on the next slide, with stats for the analysis and 6, 24 and 48 hour forecasts
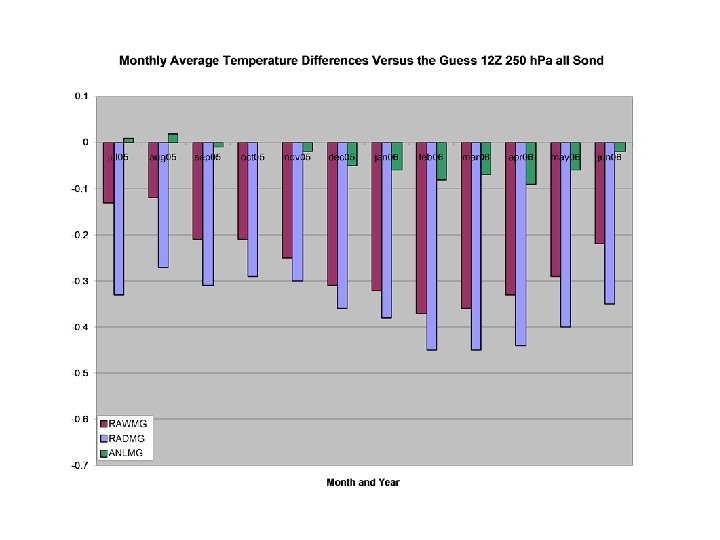
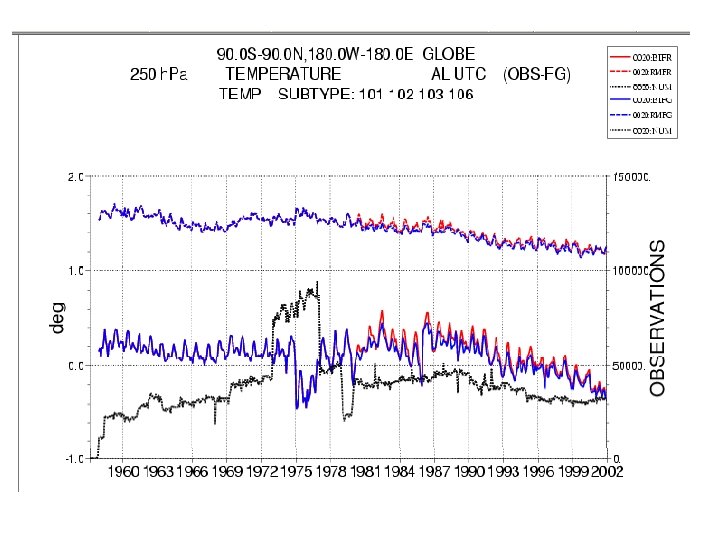
Stages of Bias Differences • The next 4 slides show stages of global biases versus passing radiosonde data as a function of time • These include raw data minus guess (RAWMG) with no NCEP RADCOR, NCEP RADCOR corrected data minus guess (RADMG) and analysis minus guess (ANLMG) • Note the improvement as of June 2005 when the Chinese RADCOR was corrected
Monthly Average Temperature Differences Versus the Guess 00 Z 250 h. Pa all Sondes
Monthly Average Temperature Differences Versus the Guess 12 Z 250 h. Pa all Sondes
Radiation Correction Stopped on Chinese Sondes
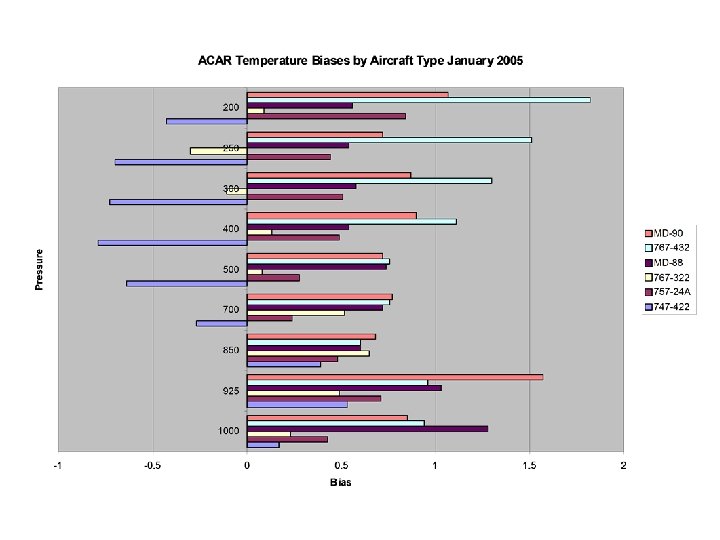
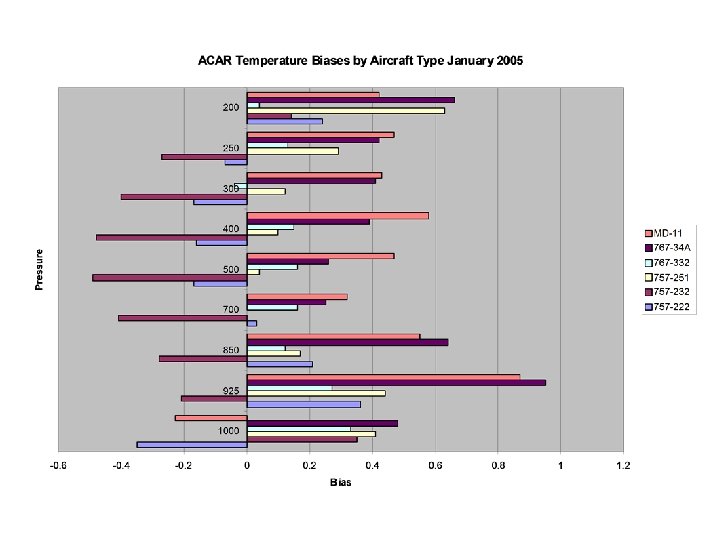
Aircraft Temperature Bias Factors • Many factors affect aircraft biases • These include aircraft type, influence of past data on the guess, airlines, pressure level, software, temperature sensors and Phase of Flight (POF) • Specific aircraft type seems to be most important such as 767 -432 versus 767 -322 • The following 2 slides do not include units whose bias is beyond 3 STD from mean
Aircraft Temperature Biases by Aircraft Types 300 h. Pa and up all Times of Day
Aircraft Temperature Biases by Aircraft Types 300 h. Pa and up all Times of Day
Aircraft Temperature Bias Scatter Plot • The next slide shows a scatter diagram of aircraft bias counts to the tenth of a degree for July 2006 300 h. Pa and up • Only aircraft with at least 50 observations in the month were used • The warmer colors indicate more aircraft with that bias • It is not obvious that any aircraft type shows a pattern of 2 or more bias subgroups yet two subgroups will later be shown to exist
May be due to 2 subgroups
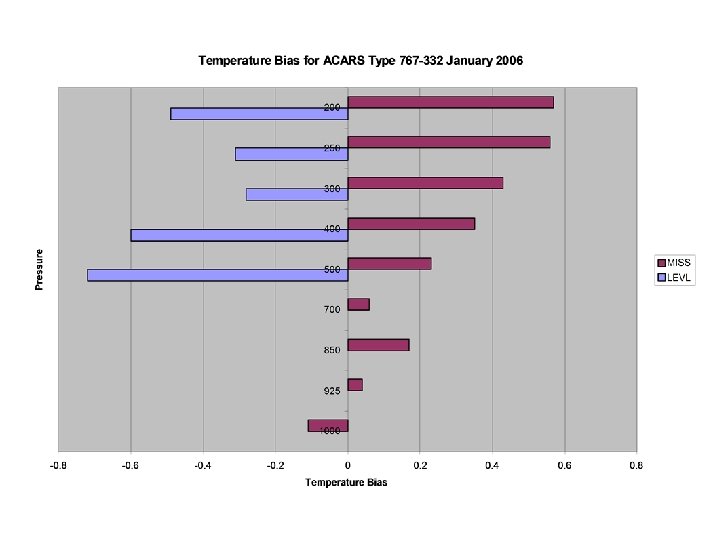
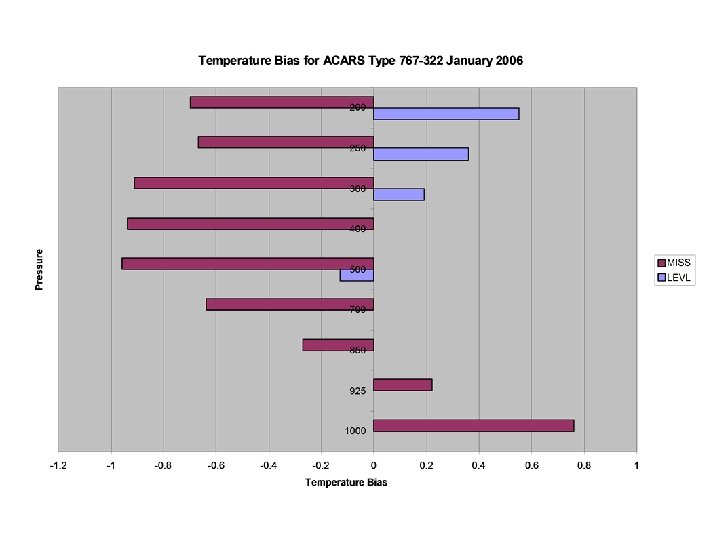
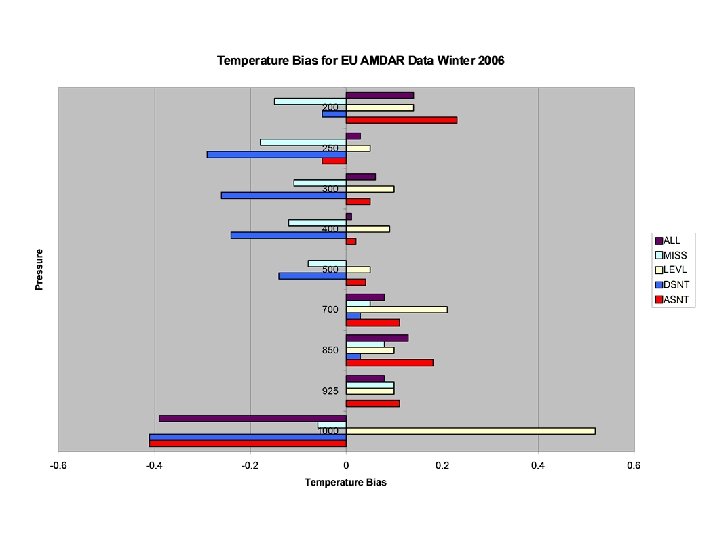
Possible Subgroup Evidence • The next 2 slides show temperature biases for 2 aircraft types where missing and level POF data have unexpected very different biases • These different biases may be due to software differences or some other unknown factor • One may want to treat these subgroups separately
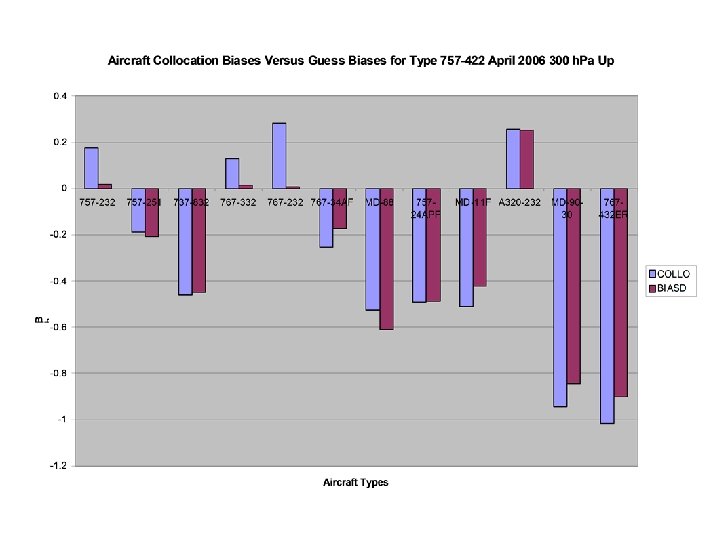
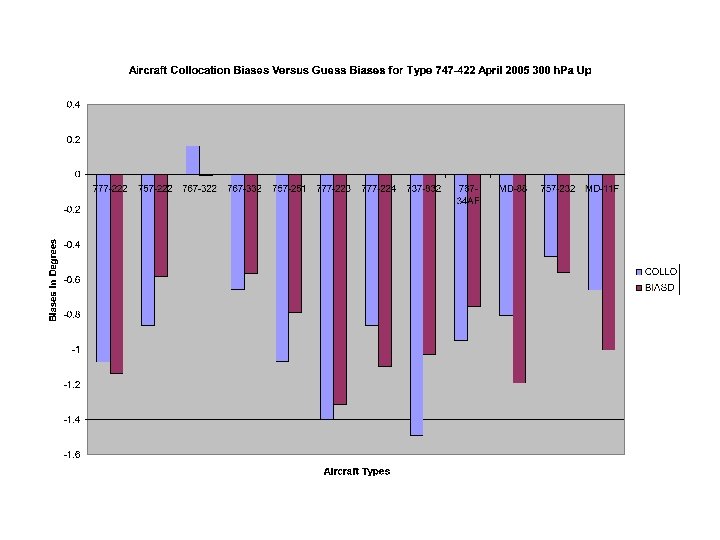
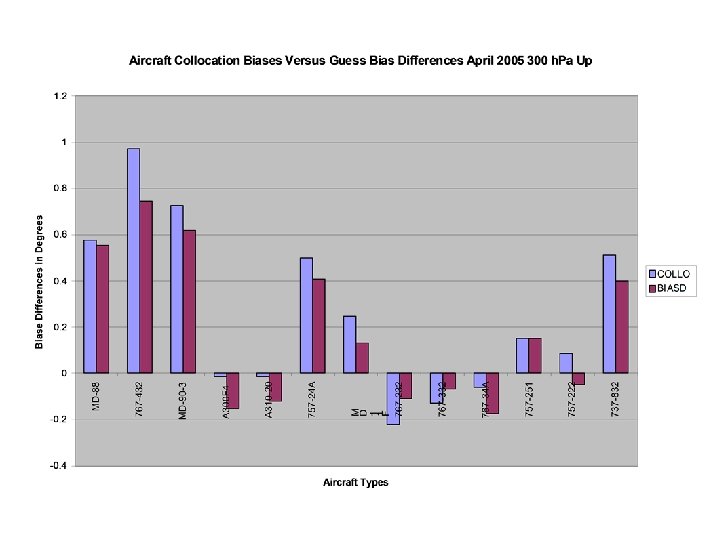
Aircraft to Aircraft Collocation Stats • Collocation stats are useful as they do not use the guess directly • Aircraft to aircraft collocations stats (blue) on the next 2 slides are consistent with biases to the guess (brown) • This consistency is similar for most types of aircraft • Collocation limits are: 1 h. Pa, 150 Km and 1 hour using non gross temperatures not on reject-list
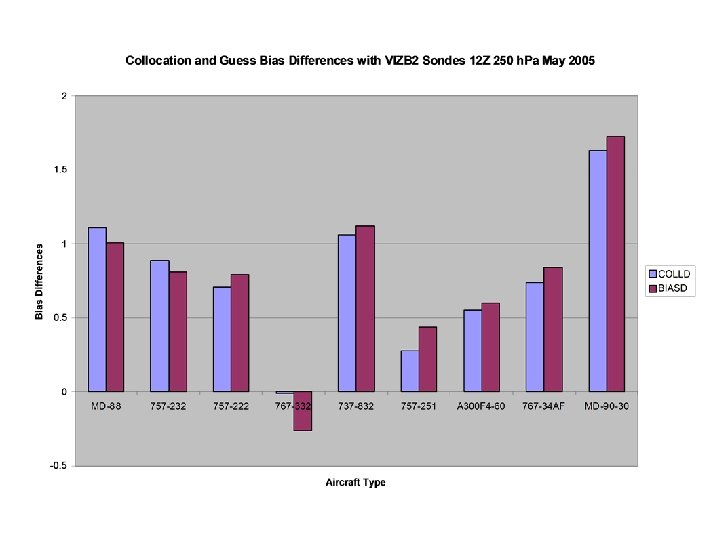
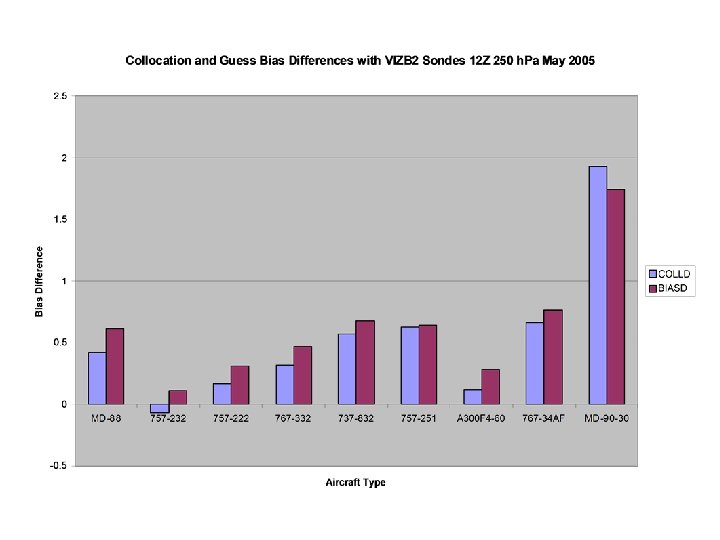
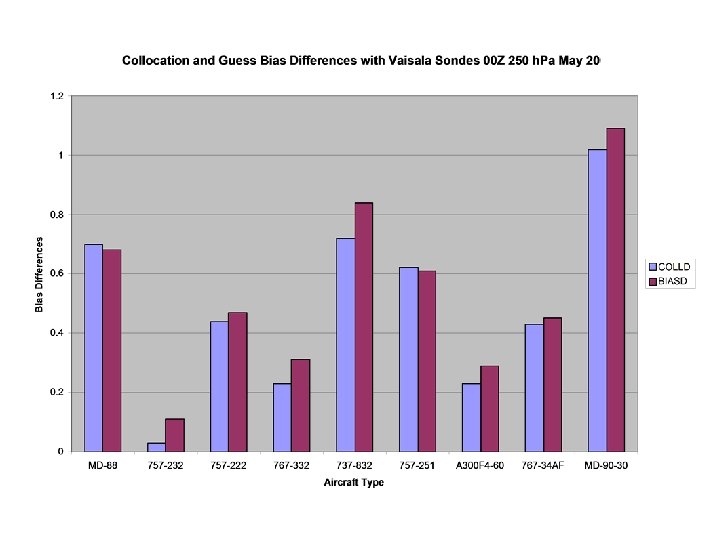
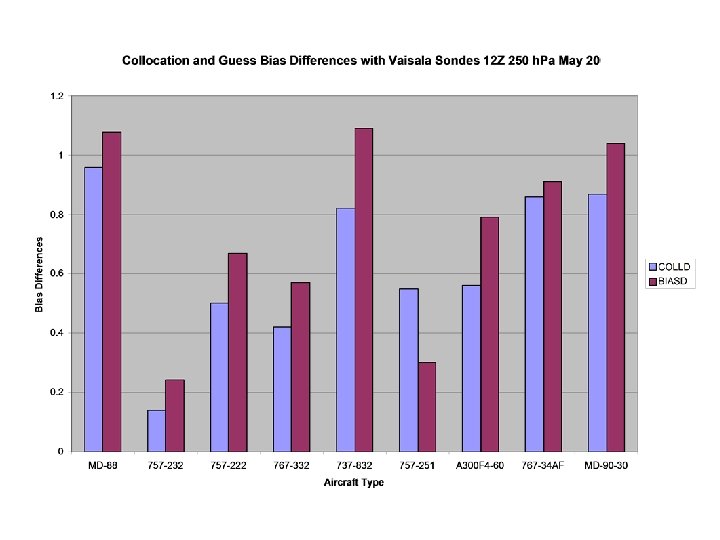
Sonde Aircraft Collocation Stats • Sonde to aircraft collocations stats (blue) on the next slide are consistent with biases to the guess (brown) • Similar results for other US sondes and times are not shown • Radiosonde to aircraft collocations are derived using linear in log(P) interpolation with sonde data to the ACARS observation averaged at the nearest mandatory pressure level • Only data passing QC are used • Collocation limits: &Time=1. 5 hours, &P=25 h. Pa, &Dist=200 Km
Vertical Temperature Bias Profiles for Different ACARS Aircraft Types • The next 2 slides show vertical biases profiles for different ACARS aircraft types • Note these slides include all POF in the stats • Stats are interpolated to nearest mandatory pressure level for non gross data
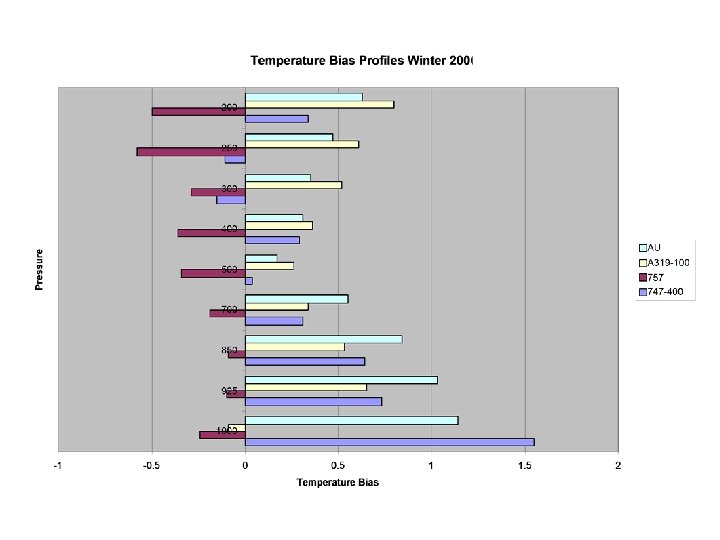
Vertical Temperature Bias Profiles for Different AMDAR Aircraft Types • Different types of aircraft have different total biases to the guess shown on next slide for winter 2006 (December 2005 through February 2006) • Biases are shown for Australian (AU), Airbus A 319 -100 and Boeing 757 and 747 -400 AMDAR types • Stats are interpolated to nearest mandatory pressure level for non gross data
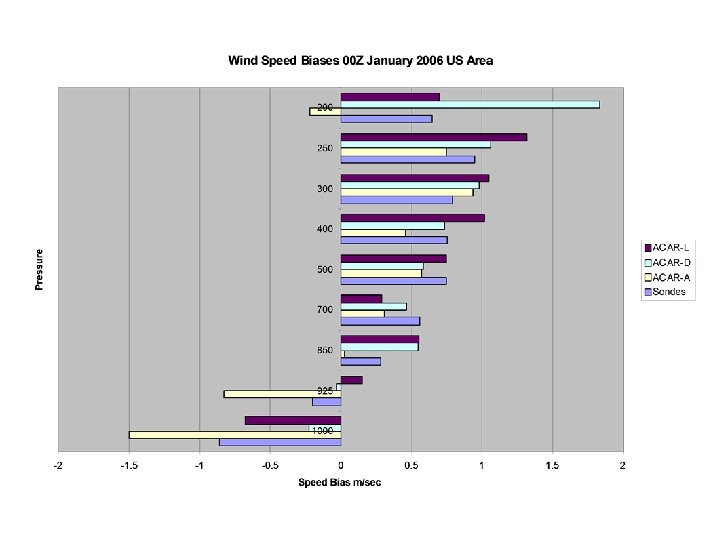
Wind Speed Biases for ACARS and Sonde Data • The next slide shows speed biases for January 2006 versus the guess in the US area • Note ACARS speed biases vary with the POF, with ascent low and descent higher • POF L is level, A is ascent, D is descent and M is missing • Stats are interpolated to nearest mandatory pressure level for non gross data
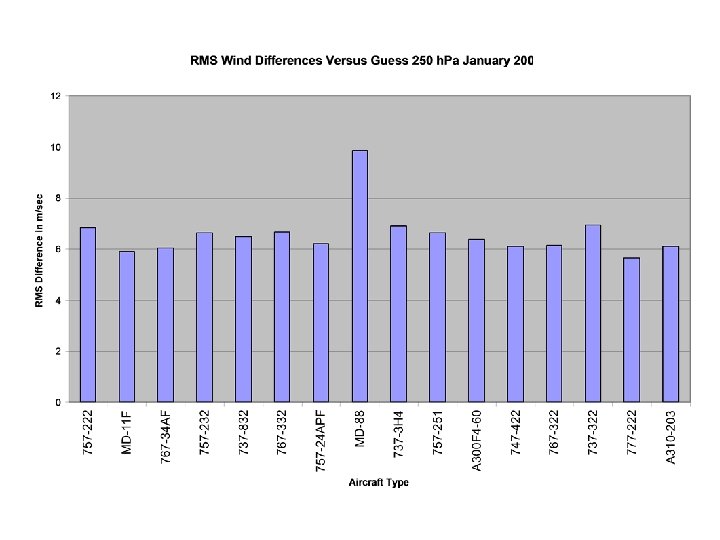
RMS Wind Differences for Different ACARS Types • The next slide shows RMS wind differences to the guess for different aircraft types for January 2006 versus the guess near 250 h. Pa • Note the MD-88 difference is typically large and others similar • FSL has these MD-88 units on the reject-list for the FSL RUC – we do not – better to let analysis know they are less accurate • Stats are interpolated to nearest mandatory pressure level for non gross data
Wind Speed Biases for Different ACARS Types • The next slide shows speed biases for January 2006 versus the guess near 250 h. Pa • Note ACARS speed biases vary some with the different types but have the same sign • Stats are interpolated to nearest mandatory pressure level for non gross data
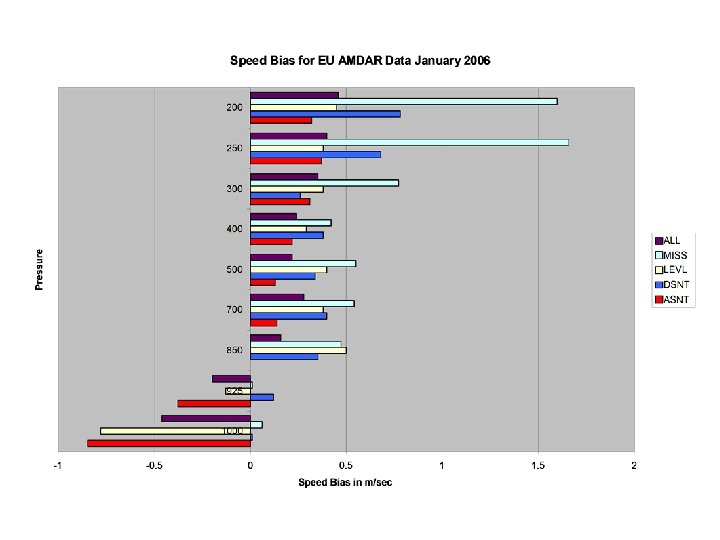
Wind Speed Biases for European AMDAR Data • The next slide shows speed biases for January 2006 versus the guess for European AMDAR data • Note AMDAR speed biases vary with the POF, with ascent low and descent higher • POF L is level, A is ascent, D is descent and M is missing • Stats are interpolated to nearest mandatory pressure level for non gross data
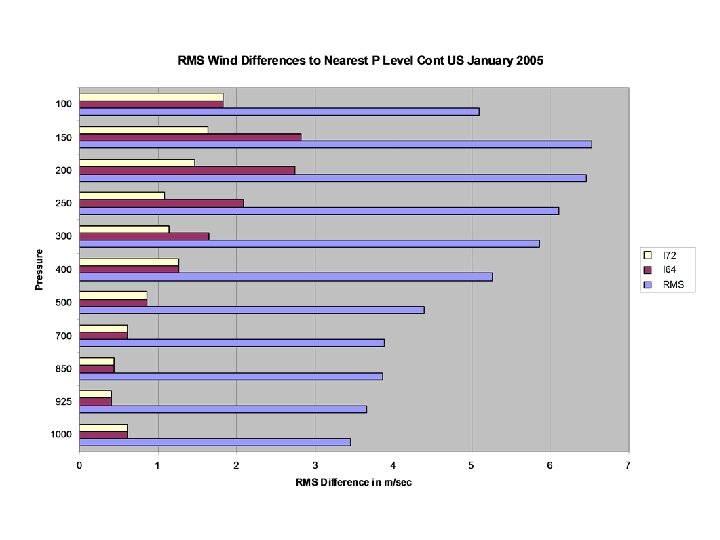
Vertical Interpolation Experiments • Vertical interpolation experiments were done using US sonde data over the 48 states • Since radiosonde data temperatures and winds are roughly linear in log(p) between reported levels, use that as truth for tests • Only data passing QC were used, and used linear in log(p) to interpolate to model sigma levels • The model now has perfect values which are then interpolated linear in log(p) back to the observations which are taken as truth • The resulting biases are similar to guess biases, see the next 4 slides
Vertical Interpolation Experiments (Continued) • Experiment I 64 used the operational 64 sigma levels • Experiment I 72 has 72 levels with 8 extra levels from sigma levels. 3297 to. 1382 • NTRP shows operational guess biases with no tropopause data • Tropopause data from 300 to 175 h. Pa have biases close to 2 degrees • Adding more sigma levels decreases the interpolation error
Trop Skewt Plot for Site 72476 12 Z 17 Jan 2006
Bias Correction Issues • Collocations with good sondes may be best for deriving bias corrections if possible – will use guess differences if not • Plan for low count problems • Develop consistent procedures for outliers • Plan to adjust to changes in biases • Study optimal pressure categories • Develop vertical interpolation of corrections – question near ground • Do we need better model vertical resolution? • Testing
Draft Plan for Bias Correction Testing • Review comments from giving seminar • Draft bias correction procedures • Ask for feedback on procedures and revise • Run experiments when time permits • Evaluate experiments • Take further actions as warranted
Acknowledgements • Thanks to Krishna Kumar for help in many areas • Thanks to Jeff Stickland for many suggestions • Thanks to Stewart Taylor for AMDAR types • Thanks to Louis Krivanek of the FAA for help with aircraft types • Thanks to John Ward for supporting the work
Summary • Aircraft data have been shown to have different biases and accuracy than sondes with stats varying primarily by aircraft type and POF • Since the guess appears to have biases, bias correction of aircraft data will need to be anchored to sonde data such as by collocation or some other solution • Bias correction has some problems, such as low data counts for some data, that need to be addressed • Some bias in the model maybe improved by more model vertical resolution • Tests need to be done to access the value of bias correction
Extra Examples Follow
Aircraft Temperature Biases 250 +/- 25 h. Pa 00 Z on 2. 5 by 2. 5 degree grid January 2005
Radiosonde Temperature Biases 250 +/- 25 h. Pa 00 Z January 2005
Average Analysis minus Guess Temperature 250 h. Pa January 2005
Aircraft Temperature Biases 250 +/- 25 h. Pa 00 Z on 2. 5 by 2. 5 degree grid July 2005
Radiosonde Temperature Biases 250 +/- 25 h. Pa 00 Z July 2005
Average Analysis minus Guess Temperature 250 h. Pa July 2005
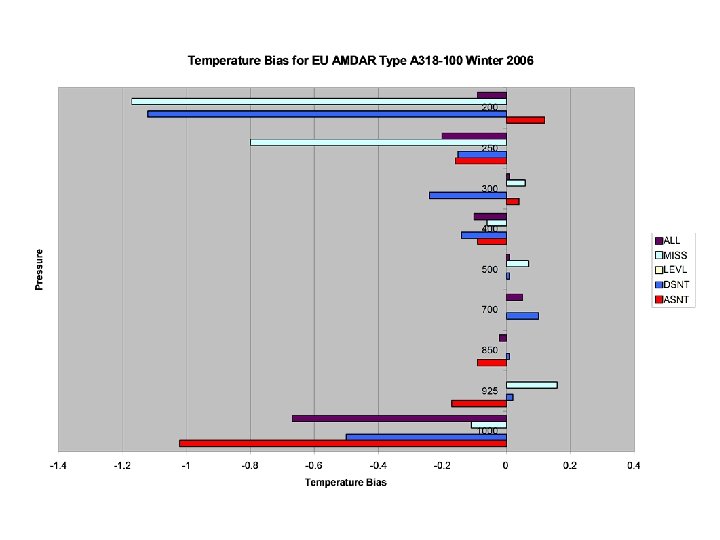
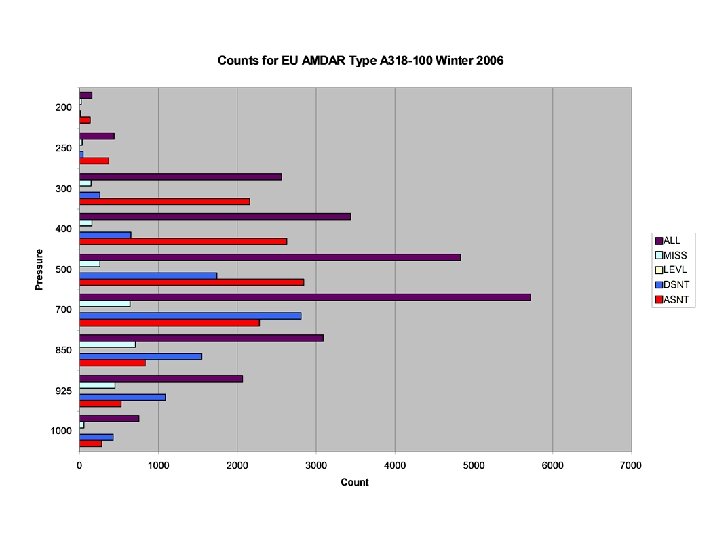
Temperature Bias Profiles can be Atypical • The next slide shows temperature biases for Airbus type A 318 -100 data for winter 2006 (December 2005 through February 2006) • Note that the ascent mode (red) is atypically colder than the descent mode (blue) • The following slide has counts for these data and shows an example of where low counts have to be dealt with