Climates on a Rotating Earth We can divide


 – • On June 21 the solar")


 occurs in descending air moving toward more extreme latitudes.")


- Slides: 38
Climates on a Rotating Earth We can divide the study of climate into a number of sub-areas. 1. The global pattern of penetration and absorption of solar energy. That energy is the driving force for most of what follows. 2. The Input: Solar Radiant Fluxes over the Globe 3. The solar energy flux which reaches the outer limit of the atmosphere is 2 calories/cm 2/minute. That's called the solar constant. Due to the elliptical orbit of the earth, the solar ‘constant’ varies by about 15% from season to season.
Only about 1/2 the energy striking the outer surface of the earth's atmosphere actually reaches ground level; the remainder is reflected, re-radiated, or absorbed within the atmosphere. Here’s what happens to the other half: 21% is reflected by clouds back into space 5% is reflected by dusts and aerosols 6% is reflected by the earth's surface 3% is absorbed by clouds 15% is absorbed by dust, water vapour and CO 2
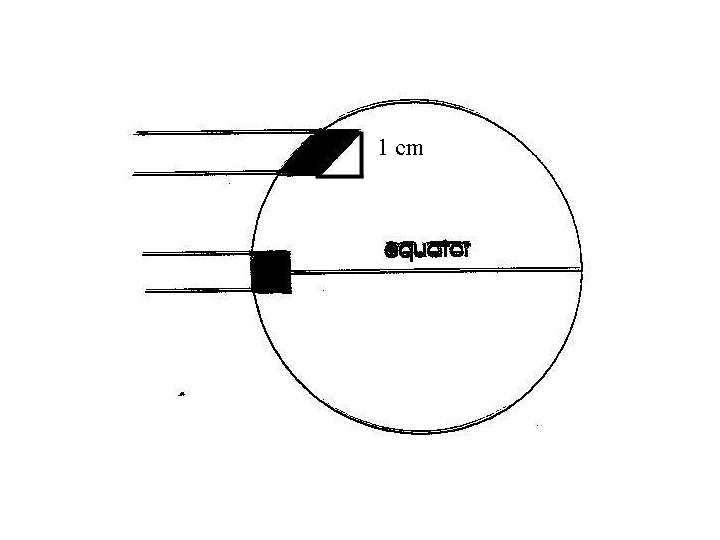
Why are the tropics, i. e. the low latitudes, warmer than the poles? It isn’t duration of sunlight. The total number of daylight hours in a year is constant for all points on earth; over the year every site averages 12 hours of daylight and 12 hours of night per day. It is input intensity. The input of solar energy, measured in calories, is not evenly distributed over latitude; the rate of input, and total input, are both higher in the tropics. It is also atmospheric thickness. At high latitudes, where the surface is 'tilted away' from the sun, the effective thickness of the atmosphere is greater.
The intensity of sunlight, measured as calories/unit area, differs with latitude because a sunbeam covering an area of 1 cm 2 at the upper surface of the atmosphere is spread over a differing surface area on earth at differing latitudes. It’s simple trig… At the equator, the 1 cm 2 sunbeam is absorbed by an area which also measures 1 cm 2. Anywhere else the surface of the earth is at a tilt with respect to the beam. Its angle of incidence is (90 - L). Representation really requires spherical geometry. Simplifying, at 45°, energy input is spread over an area 1 cm wide, but 1. 414 cm long. For every calorie/cm 2 at the equator, only 0. 707 calories/cm 2 are available at 45 o latitude.
Because the earth's axis is at a 23 o tilt with respect to the plane of the earth's orbit around the sun, the solar equator moves seasonally. Solar intensity varies with “solar latitude”. North of the Arctic Circle and south of the Antarctic Circle (each at approximately 67 o latitude) there are 'days' and 'nights' 24 hours long. The circles mark the map latitude where the 'solar latitude' reaches 90 o on at least 1 day of the year. A fair part of seasonal temperature variation is explained by considering seasonal patterns in solar latitudes.
Consider Windsor (~ 42 o N latitude) – • On June 21 the solar equator is at 23 o. N. Our effective solar latitude is not what the map says (42 o), but 42 - 23, or ~ 20 o. N. • Our effective solar latitude on December 21 is 42 + 23, or about 65 o. N, and our days are shorter. Both the energy input per unit area per unit time and the duration during which we receive that input are reduced.
Atmospheric heating results from 2 energy inputs: 1. absorption of incoming radiation, which accounts for 18% of incoming energy, and is unlikely to change much over geological time scales on earth; However, changing the albedo (reflectance) of the earth's surface (e. g. asphalt parking lots) increases both absorption and re-radiation as infra-red. 2. re-radiation of infra-red energy from the earth's surface, and its absorption by CO 2 in the atmosphere. Absorption by increased concentration of CO 2 is the ‘enhanced greenhouse effect', and adds significantly to the heat load of the atmosphere.
Global Patterns of Air Circulation Begin at the equator, forgetting that the earth’s surface is covered by irregular land masses as well as water, and that the earth rotates on its axis. Begin by considering the pattern at an equinox, when the solar equator and the map equator coincide. Consider the flow as if it were two-dimensional, rising and falling on a plane in the atmosphere. At the equator the intensity of solar energy input is at its maximum, and the atmosphere is warmed most. Hot air rises. As the hot air rises it expands in the more rarefied atmosphere of higher altitude. To expand, the air does work, spends energy.
That energy has to come from the parcel's own energy supply. Spending it means the parcel cools. Cooling occurs at a characteristic rate, called the adiabatic lapse rate. Rising creates a low pressure area at the equator; it's occurring continuously, thus forcing a flow in the upper atmosphere away from the equator. Cooling caused by rising in the atmosphere and additional cooling caused by displacement from the equator causes a gradual increase in the density of the air mass we're following. If hot air rises, then cold air sinks.
By the time the air mass has reached about 30 o solar latitude (N or S), its density is higher than that of the atmosphere beneath, and the air mass sinks back to the surface. That produces a band of consistently high pressure at what are termed the 'horse latitudes'. The reverse of what happened when the air rose happens when it falls. The parcel of air is compressed by parcels surrounding it, which are at higher pressure at lower elevation; work is done upon the falling air; that energy input warms the falling air at the adiabatic lapse rate.
As the descending parcels approach the earth’s surface, a portion of the descending air is deflected toward the equator (by earth’s rotation), and completes a circulation cell. That air produces what we call 'trade-winds‘. The remainder of the descending air mass is deflected poleward. In the general neighbourhood of 45 -50 o latitude, the warmer air from equatorial circulation meets air masses from a cold, polar circulation cell. The polar cell results from the descent of very cold, dense air masses near the poles, and their spread to lower latitudes. The poles are thus another zone of fairly steady high pressure.
Where polar and deflected equatorial air meet, there is a zone of unstable pressure. Unstable pressure leads this region to be characterized by storms. We live about there.
Global Rainfall Patterns As hot air rises, it cools at the adiabatic lapse rate. We are assuming no further input of energy (i. e. absorption of solar energy) as the air mass rises. The adiabatic lapse rate for dry air is 10 o. C/km. We must specify dry air because water vapour has a higher thermal capacity than the gases of dry air. As a rising air mass cools, it may become saturated. If it cools further, water vapour will condense on particulate matter in the atmosphere. Should condensation occur, the heat of vaporization of the condensing water vapour (approximately 585 cal/gm) is released into the air mass, slowing the rate of cooling to 6 o. C/km.
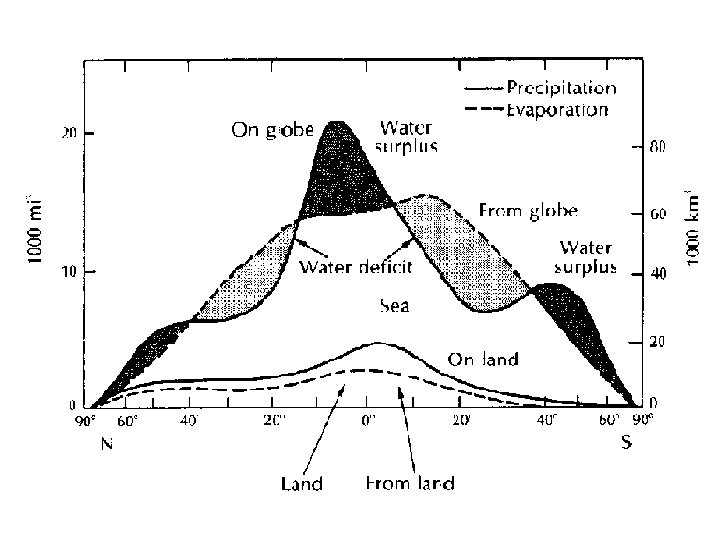
As our air mass rises at the equator, it reaches 100% relative humidity, and further rise and cooling causes water to condense out on particulates in the air (dust), forming clouds. As the water droplets get bigger, they fall as rain. We can now explain the large scale global latitudinal 'bands' of high rainfall and deserts. In the tropics, at very low solar latitudes, say 5 o on either side of the solar equator, there is a low pressure zone where solar heating causes a rising flow of air. As this air rises and cools adiabatically, water vapour condenses. The result is almost daily rainfall, usually in the evening.
The next latitudinal zone where weather pattern is determined by the global pattern of air circulation is the zones surrounding 30 o. N and S latitude. There cold air masses descend toward the surface, warming adiabatically as they descend. As air warms, its relative humidity decreases. The air mass will only rarely reach 100% relative humidity, only rarely will condensation produce clouds, and rain is unlikely. Instead, the warm air at the land surface will 'absorb' evaporation from the warm surface into the unsaturated atmosphere. The result is the world's great deserts.
In the southern hemisphere these are the Atacama desert in Chile, the Kalihari desert of southern Africa, and the Central Desert of Australia. In the northern hemisphere they are the Gobi desert of Manchuria, the Sonoran desert of the southwestern U. S. and Mexico, and the Sahara of Africa.
Sonoran Atacama Sahara Kalahari Gobi Central desert
At both the northern and southern latitudinal boundaries of the desert zones are fairly narrow zones in which precipitation shows consistent patterns of seasonal variation. On the equatorial side is a zone which receives most of its precipitation in the summer and little precipitation during its winter. At the high latitude margins of deserts, the pattern is exactly the opposite. Rain (or precipitation, whatever its form) falls principally during the winter season; during the summer their solar latitudes produce a moderate, desert-like climate.
Where warm equatorial and cold polar air masses meet, the meeting of the air masses causes a general rising flow. Adiabatic cooling during the rise leads to rainfall, but this is a diffuse belt, and rainfall is not predictable at any specific location or time. Finally, at extreme latitudes we find Arctic and Antarctic polar deserts. These areas receive extremely low amounts of precipitation annually; they are zones of stable high pressure where cold air descends back toward the surface, and where rainfall (or snowfall) is therefore unlikely. These areas cover latitudinal zones from around the polar circles (65 o or so) to the poles.
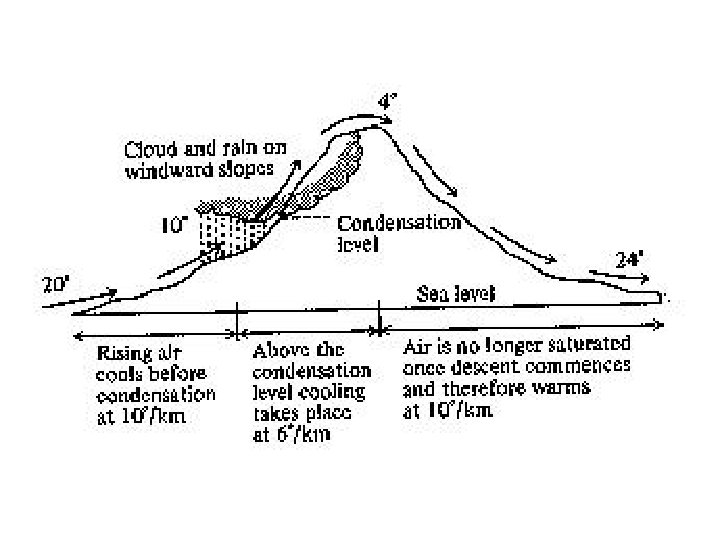
Surface Topography and Precipitation Patterns As surface winds pass over terrestrial topography, the air masses comprising them necessarily must rise and fall. Those upward and downward movements subject air masses to the same adiabatic changes in temperature, and therefore also of great importance in determining precipitation patterns. On the leeward side of every mountain chain there is a 'rain shadow', a region of low rainfall; and on the windward side, particularly along mountain slopes, there is typically a fairly 'wet' climate
Follow an air mass which begins at the western edge of the Rockies at a comfortable 20 o. C, and a moderately high relative humidity. As the air rises up the western slope, it cools adiabatically, initially at the 'dry' adiabatic lapse rate of 10 o. C per km. Assume that the air reaches saturation (100% relative humidity) at 10 o. C. When the air has risen halfway (1 km) up the mountain, it is saturated. As it continues to rise and cool from 1 to 2 km elevation, clouds will form and rain will fall. Condensation releases the heat of vaporization, so that cooling occurs at the lower, saturated adiabatic rate of 6 o. C/km.
Air which had cooled to 10 o at 1 km cools to 4 o at the peak of the mountain. As the air descends on the leeward side, it warms adiabatically. As it warms, the relative humidity drops. Since the air is now unsaturated, the rate of warming is the 10 o. C unsaturated rate. When this air has descended to 1 km, its temperature is 14 o. C, and at the eastern base of the mountains it is 24 o. C. The leeward side is warmer, and since the air is unsaturated, rainfall is an uncommon occurrence. The rain shadow phenomenon and adiabatic temperature changes which affect likelihood of rainfall are important in many areas.
Regions in the middle of continents typically undergo seasonal extremes in climate – hot summers and cold winters. There are 2 parts to explanation of extreme seasonal fluctuations at mid-continent: 1. Water has a high thermal capacity. The presence of 2. large bodies of water nearby (e. g. oceans, the Great Lakes) tends to moderate temperature fluctuations. 3. 2. Temperatures can fluctuate more rapidly and to wider extremes when air is 'dry' (i. e. unsaturated) than when air is at or very near saturation. Climatologists use a measure called 'continentality‘ 1. to indicate the combination of variation in
Climate Resulting From the Earth's Rotation The last factor to add is the daily rotation of the earth on its axis, and effects on air and water circulation. Rotation produces what is called the Coriolis effect. The Coriolis force represents conservation of momentum for objects moving over the surface of a rotating earth. Air masses moving latitudinally deflect from the simple N-S patterns indicated previously in global air circulation.
Think of yourself as standing at the equator. At the equator the earth is approximately 40, 000 km in circumference. Standing still for 24 hours at the equator, the rotation of the earth will have caused you to ‘move’ 40, 000 km. The air which surrounds you moves at the same 40, 000 km per day, assuming you feel no wind. Now consider air descending at 30 o latitude. The earth’s circumference is about 34, 600 km at 30 o. Equatorial air descending at 30 o is moving faster than that, even including friction, which would decrease its actual velocity from ~40, 000 km/day. The descending air spreads northward and southward.
Rotation of the earth is from west to east (that's why the sun rises in the east and sets in the west, in case you've lost track). Therefore, that's the direction of deflection of winds in the air mass moving away from the equator (towards higher latitude) at 30 o from west to east, or westerly winds. Frictional drag as air spreads from the solar equator is important. Otherwise the difference in velocity (167. 7 km/hr) would produce continuous hurricane force winds.
A westerly deflection (west east) occurs in descending air moving toward more extreme latitudes. In the southern hemisphere, this deflection produces the 'roaring 40's'. The same forces produce cyclonic storms (hurricanes, tornados, monsoon winds).
What about the air that deflects back toward the solar equator? Frictional drag near the surface (in the 1 km nearest the surface) has slowed this air mass to within a few km/hour of the rotational velocity at 30 o, i. e. wind speed is only a few km/hr. As this air moves toward the equator, it now has a horizontal velocity lower than the rotational velocity of the earth's surface over which it is passing. Frictional drag tends to accelerate this air, but it is nevertheless deflected from east to west. These northeasterly winds (north south as a result of Hadley cell circulation, east west from Coriolis deflection) are called the trade winds
Near the equator frictional drag has caused surface winds to catch up with surface velocity; there is little N-S velocity; air movements are dominated by the Hadley cell vertical circulation. As a result surface winds are usually weak near the equator, and result in a zone known as the doldrums. Ocean currents are also directed by Coriolis forces. Generally the direction of ocean currents is determined by the effects of surface winds moving surface waters, effects of land masses (blocking/redirecting), and Coriolis forces deflecting water movement.
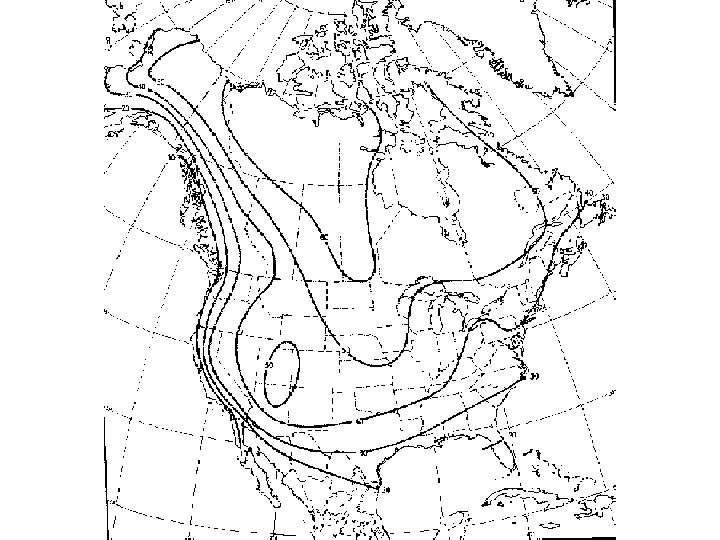
Where Coriolis forces draw surface waters away from continental margins, that water must be replaced. The replacement water is cold, nutrient-rich upwelling. These waters are the world's great fishing grounds. Off Newfoundland the Gulf Stream is deflected towards Europe by its northward movement. The upwelling produces the Grand Banks. Off California and northern Mexico the Japan Current is deflected westward across the Pacific by southward movement. Off Peru, where a southern Pacific cell has a return flow deflection, is the third major Western hemisphere fishing grounds.
These upwellings and coastal flows also have a major impact on the rainfall patterns over nearby continental areas. Patterns of rainfall along the west coast of North America in winter and summer result from westerly winds and the relative temperature of water and land. Water has a high thermal capacity, and water temperature results from the Coriolis force driven Japan current.
The same “relative temperature” explains ‘lakeeffect’ snowbelts in the Great Lakes region and many other local climate features around the world.
References and Readings: Hughes, L. 2000. Biological consequences of global warming: is the signal already apparent? TREE 15: 56 -61. *Mac. Arthur, R. H. 1972. Geographical Ecology: patterns in the Distribution of Species. Harper & Row, New York. Chapter 1 - Climates on a Rotating Earth. Post, W. M. , T. -H. Peng, W. R. Emanuel, A. W. King, V. H. Dale and D. L. De. Angeles. 1990. The global carbon cycle. American Scientist 78: 310 -26. *Smith, R. 1990. Ecology and Field Biology 4 th ed. Harper & Row, NY. Ch. 4. Climate. Thomas, C. D. et al. 2004. Extinction risk from climate change. Nature 427: 145 -148. * = good basic chapters on climate - the forces and results of solar input, atmospheric circulation, and topography.