Class 3 Post Grad Gross Domestic Product Measuring


: – The spending by households on goods")
: – The spending on goods and")


 is a measure of")


 contribute to the aggregate")


- Slides: 60
Class 3 – Post Grad! Gross Domestic Product
Measuring a nation’s income • Macroeconomics answers questions like the following: – Why is average income high in some countries and low in others? – Why do prices rise rapidly in some periods of time while they are more stable in other periods? – Why do production and employment expand in some years and contract in others?
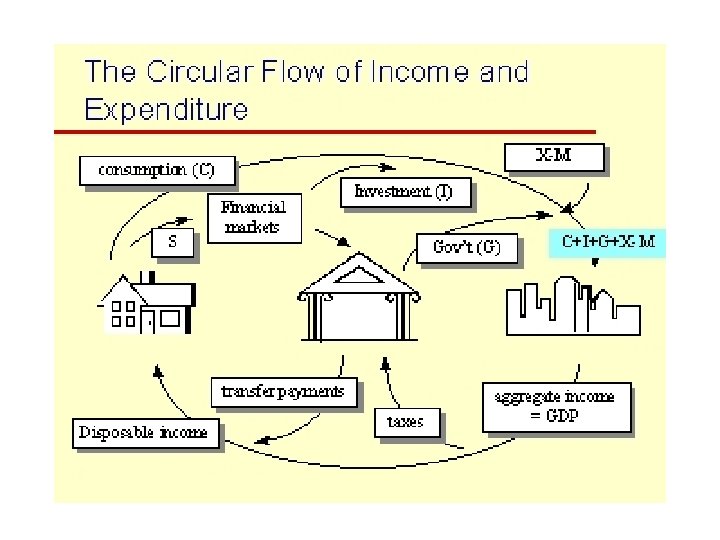
The economy’s income and expenditure • For an economy as a whole, income must equal expenditure because: – Every transaction has a buyer and a seller. – Every dollar of spending by some buyer is a dollar of income for some seller.
The measurement of GDP “GDP is the market value of all final goods and services produces within a country in a given period of time” Y = C + I + G + NX Y = GDP C – Consumption I – Investment G – Government Purchases NX – Net Exports
The measurement of GDP is the Market Value Since market prices measure the amount people are willing to pay for different goods they accurately reflect their value If a price of an apple is twice that of an orange, the apple contributes twice as much to GDP as the orange Of All GDP tries to be comprehensive. Includes all items produced in the economy and sold legally in the market GDP also includes the market value of housing services. If people own their houses the govt estimates rent. GDP excludes illegal items (drugs) GDP excludes items that are produced and consumed at home (Vegetable Gardens) Within a country GDP measures the value of production within the geographic confines of a country. In a given period of time GDP measures the value of production that takes place within a specific interval of time
The components of GDP • Consumption (C): – The spending by households on goods and services, with the exception of purchases of new housing. • Investment (I): – The spending on capital equipment, inventories and structures, including household purchases of new housing.
The components of GDP • Government purchases (G): – The spending on goods and services by local, state and federal governments. – Does not include transfer payments because they are not made in exchange for currently produced goods or services. • Net exports (NX): – Exports minus imports.
GDP and its components
Real versus nominal GDP • Nominal GDP values the production of goods and services at current prices. • Real GDP values the production of goods and services at constant prices.
GDP and economic wellbeing • GDP is the best single measure of the economic well being of a society. • GDP person tells us the income and expenditure of the average person in the economy.
GDP and economic wellbeing • Higher GDP person indicates a higher standard of living. • However, GDP is not a perfect measure of the happiness or quality of life.
GDP and economic wellbeing • Some things that contribute to wellbeing are not included in GDP. – The value of leisure. – The value of a clean environment. – The value of almost all activity that takes place outside of markets, such as the value of the time parents spend with their children and the value of volunteer work.
Inflation
Inflation • Inflation refers to a situation in which the economy’s overall price level is rising. • The inflation rate is the percentage change in the price level from the previous period.
The consumer price index • The consumer price index (CPI) is a measure of the overall cost of the goods and services bought by a typical consumer.
How the CPI is calculated 1. Fix the basket: Determine which prices are most important to the typical consumer. 2. Find the prices: Find the prices of each of the goods and services in the basket for each point in time. 3. Calculate the basket’s cost: Use the data on prices to calculate the cost of the basket of goods and services at different times. 4. Choose a base year and compute the index: Designate one year as the base year, making it the benchmark against which other years are compared. 5. Compute the inflation rate: The inflation rate is the percentage change in the price index from the preceding period
How the CPI is calculated • The inflation rate is calculated as follows:
What’s in the CPI’s basket? Copyright© 2004 South-Western
Correcting economic variables • Price indexes are used to correct for the effects of inflation when comparing dollar figures from different times.
Dollar figures from different times
Real and nominal interest rates • The nominal interest rate is the interest rate usually reported and not corrected for inflation. – It is the interest rate that a bank pays. • The real interest rate is the nominal interest rate that is corrected for the effects of inflation.
Real and nominal interest rates • • You borrowed $1, 000 for one year. Nominal interest rate was 15%. During the year inflation was 10%. Real interest rate = Nominal interest rate – Inflation • = 15 per cent − 10 per cent = 5 per cent
Revisiting Demand Supply And the Role of Governments
Short-run economic fluctuations • A recession is a period of declining real incomes and rising unemployment. • A depression is a severe recession.
Three key facts about economic fluctuations 1. Economic fluctuations are irregular and unpredictable. – Fluctuations in the economy are often called the business cycle.
Three key facts about economic fluctuations 1. Most macroeconomic quantities fluctuate together. – – Most macroeconomic variables that measure some type of income or production fluctuate closely together. Although many macroeconomic variables fluctuate together, they fluctuate by different amounts.
Three key facts about economic fluctuations 1. As output falls, unemployment rises. – – Changes in real GDP are inversely related to changes in the unemployment rate. During times of recession, unemployment rises substantially.
The basic model of economic fluctuations • The basic model of aggregate demand aggregate supply – The aggregate-demand curve shows the quantity of goods and services that households, firms and the government want to buy at each price level. demand • The basic model of aggregate and aggregate supply – The aggregate-supply curve shows the quantity of goods and services that firms choose to produce and sell at each price level.
Aggregate demand aggregate supply Price level Aggregate supply Equilibrium price level Aggregate demand 0 Equilibrium output Quantity of output
The aggregate-demand curve • The four components of GDP (Y) contribute to the aggregate demand for goods and services. Y = C + I + G + NX
The aggregate-demand curve Price level P P 2 1. A decrease in the price level. . . 0 Aggregate demand Y Y 2 2. . increases the quantity of goods and services demanded. Quantity of output
Why the aggregate-demand curve is downward sloping • The The • The price level and consumption: wealth effect price level and investment: interest-rate effect price level and net exports: exchange-rate effect
Why the aggregate-demand curve is downward sloping • The price level and consumption − The wealth effect: – A decrease in the price level makes consumers feel more wealthy, which in turn encourages them to spend more. – This increase in consumer spending means larger quantities of goods and services are demanded.
Why the aggregate-demand curve is downward sloping • The price level and investment − The interest-rate effect: – A lower price level reduces the interest rate, which encourages greater spending on investment goods. – This increase in investment spending means a larger quantity of goods and services demanded.
Why the aggregate-demand curve is downward sloping • The price level and net exports − The exchange-rate effect: – When a fall in the Sri-Lankan price level causes Sri-Lankan interest rates to fall, the real exchange rate depreciates, which stimulates Sri-Lankan net exports. – The increase in net export spending means a larger quantity of goods and services demanded.
Why the aggregate-demand curve might shift • Shifts arising from: – consumption – investment – government purchases – net exports
Price level Shifts in the aggregate demand curve P 1 D 2 Aggregate demand, D 1 0 Y 1 Y 2 Quantity of output
The aggregate-supply curve • In the long run, the aggregate-supply curve is vertical. • In the short run, the aggregate-supply curve is upward-sloping.
The long-run aggregatesupply curve Price level Long-run aggregate supply P P 2 2. . does not affect the quantity of goods and services supplied in the long run. 1. A change in the price level. . . 0 Natural rate of output Quantity of output
Why the long-run aggregatesupply curve might shift • Shifts arise due to: – labour – capital – natural resources – technological knowledge
Long-run growth and inflation 2. . and growth in the money supply shifts aggregate demand … Long-run aggregate supply, LRAS 1980 LRAS 1990 LRAS 2000 Price level 1. In the long run, technological progress shifts long-run aggregate supply. . . P 2000 4. . and ongoing inflation. P 1990 Aggregate Demand, AD 2000 P 1980 AD 1990 AD 1980 0 Y 1980 Y 1990 Quantity of output 3. . leading to growth in output. . . Y 2000 Copyright © 2004 South-Western
How fiscal policy influences aggregate demand • Fiscal policy refers to the government’s choices regarding the overall level of government purchases or taxes. • Fiscal policy influences saving, investment, and growth in the long run. • In the short run, fiscal policy primarily affects the aggregate demand.
Changes in government purchases • When policymakers change the money supply or taxes, the effect on aggregate demand is indirect — through the spending decisions of firms or households. • When the government alters its own purchases of goods or services, it shifts the aggregate-demand curve directly.
Changes in government purchases • There are two macroeconomic effects from the change in government purchases: – The multiplier effect – The crowding-out effect
The multiplier effect • Government purchases are said to have a multiplier effect on aggregate demand. – Each dollar spent by the government can raise the aggregate demand for goods and services by more than a dollar.
The multiplier effect • The multiplier effect refers to the additional shifts in aggregate demand that result when expansionary fiscal policy increases income and thereby increases consumer spending.
A formula for the spending multiplier • The formula for the multiplier is: Multiplier = 1/(1 − MPC) • An important number in this formula is the marginal propensity to consume (MPC). – It is the fraction of extra income that a household consumes rather than saves.
A formula for the spending multiplier • If the MPC is 3/4, then the multiplier will be: Multiplier = 1/(1 − 3/4) = 4 • In this case, a $20 billion increase in government spending generates $80 billion of increased demand for goods and services.
The crowding-out effect • Fiscal policy may not affect the economy as strongly as predicted by the multiplier. • An increase in government purchases causes the interest rate to rise. • A higher interest rate reduces investment spending.
The crowding-out effect • This reduction in demand that results when a fiscal expansion raises the interest rate is called the crowding-out effect. • The crowding-out effect tends to dampen the effects of fiscal policy on aggregate demand.
Changes in taxes • When the government cuts personal income taxes, it increases households’ take-home pay. – Households save some of this additional income. – Households also spend some of it on consumer goods. – Increased household spending shifts the aggregate-demand curve to the right.
Automatic stabilisers • Automatic stabilisers are changes in fiscal policy that stimulate aggregate demand when the economy goes into a recession without policymakers having to take any deliberate action. • Automatic stabilisers include the tax system and some forms of government spending.
Market Failure – “A condition that arises when unrestrained operations in the markets yield socially undesirable outcomes” What do governments do to prevent market failure? Establishing and Enforcing the Rules of the game Market efficiency depends on people using your resources to maximize your utility. Promoting Competition Preventing firms from colluding. Regulating Natural Monopolies Natural monopolies – when one first serves the market at a lower cost than other firms. (and charges a higher price than socially optimal) Providing Public Goods
What is a Public Good A public good is a good that is non-rival and non excludable. Non-Rival – Means consumption of the good by one person does not reduce the availability of the good for others. Non Excludable – means that no one can effectively be excluded from using the product Examples: Air, Mp 3 Songs, Youtube Excludable Non-Excludable Rivalries Private goods – Food, Clothing Cars Common Goods – Fish Stocks, timber Non-Rivalries Club Goods – Cinema, Private parks, satellite television Public goods – National TV, Defense Taxes are used to pay for public goods!
Externalities Dealing with Externalities Externality – a cost or benefit that falls on a third party and therefore ignored by the two parties to the market transaction. ‘ Negative externalities - pollution Positive externalities – beautification of the neighborhood Market prices do not reflect externalities Governments use the items below to discourage negative externalities and promote positive positions Taxes Subsidies Regulations
What do governments do to prevent market failure? A more equal distribution of wealth Resource markets does not guarantee a minimum level of income. TRANSFER PAYMENTS – Reflect societies attempts to provide a basic standard of living. This is also called welfare economics Minimum Wages Price Floors Price Ceilings (Rent Control) Taxes Subsidies
Minimum Wage This is relatively prevalent in Western Countries
Price Floors A price floor is a government or group imposed limit on how low a price can be charged for a product Effective Price floors are when the price floor is greater than the equilibrium price.
Price Ceiling A imposed limit of the price charged for a product Only if the price ceiling is below the equilibrium price will it be effective. Consequences of Price Ceilings Black Markets Reduction in Quality Discrimination