Gross Domestic Product Gross Net Gross Domestic Product


 2011 $15. 08 trillion $79. 39")


 o local, state, and federal levels of spending")
 o local, state, and federal levels of spending o")
 o local, state, and federal levels of spending o")


 o Used to deflate… …or inflate NGDP")
 o What is it? *** o Usually, the")


 • Qualified workers with transferable skills who")
 • U due to structural economic changes or wage disequilibrium o")
 • U due to structural economic changes or wage disequilibrium o")
 • U due to structural economic changes or wage disequilibrium o")


 • During recessions or times of low macroeconomic demand")
 • NRU = UF + US • UC")
 • NRU = UF + US • UC")
 • NRU = UF + US • UC")
 • NRU = UF + US • UC")


 • What a bank")
 • What a bank")


 15 12 Nominal interest rate 9")


 • Average number of times")
 • Average number of times")
 • Average number of times")


- Slides: 72
Gross Domestic Product Gross Net
Gross Domestic Product Domestic
Gross Domestic Product
Gross Domestic Product Gross within our borders Domestic produced or provided. Product Total amount
Gross Domestic Product I. Gross Domestic Product A. GDP*** B. Measures two things at once: • total income of all • total spending on goods, services How does GDP do it? Mr. GDP
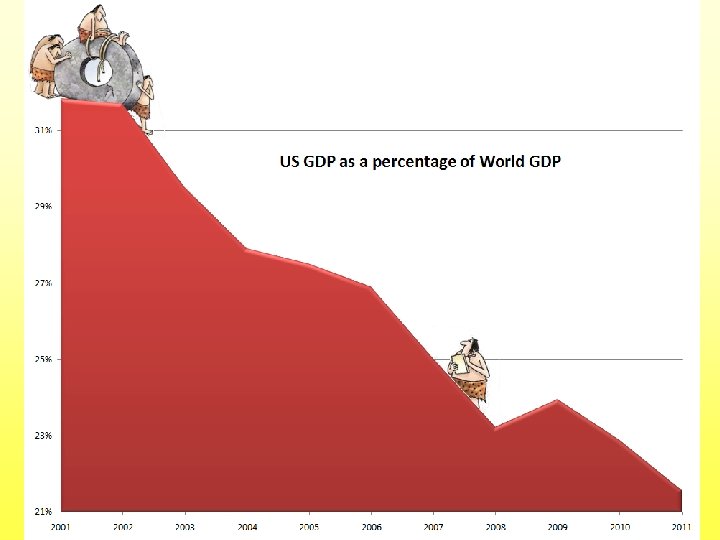
U. S. GDP 2011 GWP (Gross World Product) 2011 $15. 08 trillion $79. 39 trillion U. S. share of 2011 GWP 19% Mr. GDP
Gross Domestic Product NO C. Only final goods and services are counted NO NO YES! NO
Gross Domestic Product C. Only final goods and services are counted. • Intermediate goods are not counted. o For example***
Gross Domestic Product C. Only final goods and services are counted. • Intermediate goods are not counted. o For example*** D. Only currently produced items are counted. • No stocks or transfer payments • No secondhand sales
Gross Domestic Product C. Only final goods and services are counted. • Intermediate goods are not counted. o For example*** D. Only currently produced items are counted. • No stocks or transfer payments • No secondhand sales E. We count all production within our borders
Canadian GDP U. S. GDP
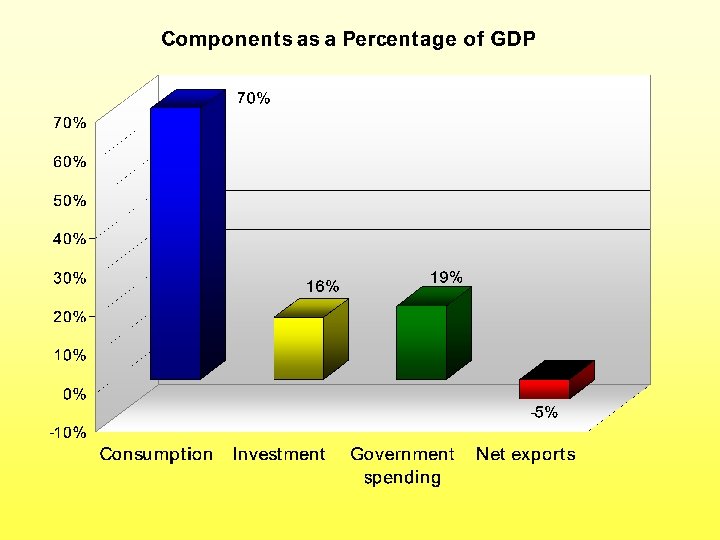
II. Components of GDP • Y = C + I + G + NX • Consumption (C) o household spending o largest portion
II. Components of GDP • Y = C + I + G + NX • Consumption (C) o household spending o largest portion • Investment (I) o capital goods o all construction o changes in inventories…
• Gov. Purchases (G) o local, state, and federal levels of spending
• Gov. Purchases (G) o local, state, and federal levels of spending o public works, goods/services, salaries, etc. o not transfer payments
• Gov. Purchases (G) o local, state, and federal levels of spending o public works, goods/services, salaries, etc. o not transfer payments • Net Exports (NX) o NX = EX − IM o Will buying an import increase or decrease GDP? ***
C + I Mr. GDP + G + NX
In the tiny country of Einwinzigesland… GDP Year 1: $100 Some GDP math… GDP Yearsimple 2: $150 In which year did Einwinzigesland produce more?
Total production in the tiny country of Einwinzigesland Year 1 Item Quantity Price Total Pizza 2 $10. 00 $20. 00 Scooter 4 $20. 00 $80. 00 Year 2 Item GDP: $100. 00 Quantity Price Total Pizza 1 $30. 00 Scooter 2 $60. 00 $120. 00 In which year did Einwinzigesland produce more? GDP: $150. 00
IV. Nominal vs. Real GDP A. If GDP rises, it could be due to… • more production, or • higher prices 1.
IV. Nominal vs. Real GDP A. If GDP rises, it could be due to… • more production, or • higher prices B. Nominal GDP*** • current dollars C. Real GDP*** • constant dollars 2008 $10 2012 Calculate real GDP for Einwinzigesland in Year 2 based on prices in Year 1. *** $12 $10* *in 2008 dollars
IV. Nominal vs. Real GDP A. If GDP rises, it could be due to… • more production, or • higher prices B. Nominal GDP*** • current dollars C. Real GDP*** • constant dollars D. Price Indexes • Measure the price of a market basket (mb) in a given period to same mb in a base period
Price index price of mb in year z = × 100 in year z price of mb in base year Calculate the price index for Einwinzigesland in Year 2 using Year 1 as the base year. ***
• GDP Price Index (GDP deflator) o Used to deflate… …or inflate NGDP to find RGDP nominal GDP × 100 Real GDP = GDP price index Calculate real GDP for. Mr. Einwinzigesland in Year 2 GDP using the price index for Year 2. ***
• Consumer Price Index (CPI) o What is it? *** o Usually, the “inflation rate” is based on CPI o Calculated monthly (1982 -1984 is base period) o Samples some 80, 000 items in 8 major categories…
Macroeconomic Fluctuations I. The Business Cycle A. Irregular fluctuations in real GDP B. Phases • Peak • Recession o RGDP falls o U rises o Consumer durables and capital goods are hit the hardest. Why***
• Trough o RGDP at lowest levels o U at highest levels • Recovery / Expansion o RGDP rising o U falling o Prices may rise
The Business Cycle Peak Recovery and Expansion Peak ine L nd e r T Output, employment, and prices rising REAL GDP Output and employment at highest levels Recession Output and employment begin to fall Trough Output and employment hit their lowest levels TIME
II. Unemployment A. Labor force — must be willing and able to work
II. Unemployment A. Labor force — must be willing and able to work B. Unemployment rate (U) • % of jobless in labor force U = jobless × 100 labor force • [Example: If there are 50 people in the labor force and 3 of them are unemployed…] • Understated due to part-time / discouraged workers
C. Types of unemployment 1. Frictional (UF) • Qualified workers with transferable skills who change jobs • New entrants
2. Structural (US) • U due to structural economic changes or wage disequilibrium o Geographic industry shifts
2. Structural (US) • U due to structural economic changes or wage disequilibrium o Geographic industry shifts o Workers’ lack of required skills
2. Structural (US) • U due to structural economic changes or wage disequilibrium o Geographic industry shifts o Workers’ lack of required skills o Technological innovation and consumer preferences
3. Seasonal • Workers laid off annually during slow months • Unemployment rates are “seasonally adjusted”
4. Cyclical (UC) • During recessions or times of low macroeconomic demand
D. Natural rate of unemployment (NRU) • NRU = UF + US • UC = U – NRU • If UC is zero, we are at NRU o Full employment NRU: 4. 5% to 5. 0%
D. Natural rate of unemployment (NRU) • NRU = UF + US • UC = U – NRU • If UC is zero, we are at NRU o Full employment Guns Producing at the NRU Does this mean UC is negative recession? UC is positive Butter
D. Natural rate of unemployment (NRU) • NRU = UF + US • UC = U – NRU • If UC is zero, we are at NRU o Full employment U. S. Unemployment Rate D G C E F A B
D. Natural rate of unemployment (NRU) • NRU = UF + US • UC = U – NRU • If UC is zero, we are at NRU o Full employment October 09: 10. 1%
Fun with… Types of Unemployment 1. A computer programmer is laid off because of a recession. cyclical 2. A literary editor leaves her job in New York to look for a new job in San Francisco. frictional 3. An unemployed college graduate is looking for his first job. frictional 4. Advances in technology make the assembly-line worker’s job obsolete. structural
5. Slumping sales lead to the cashier being laid off. cyclical 6. An individual refuses to work for minimum wage. frictional 7. A high school graduate lacks the skills necessary for a particular job. structural 8. A local farmer lets his workers go after the crops have been harvested. seasonal 9. A skilled glass blower becomes unemployed when a new machine does her job faster. structural
III. Price Changes A. Inflation*** Inflation B. Disinflation*** Disinflation C. Deflation*** Deflation 2007 2012 $200 $150
III. Price Changes A. Inflation*** Inflation B. Disinflation*** Disinflation C. Deflation*** Deflation
III. Price Changes I n fl a ti o n r a te % A. Inflation*** Inflation B. Disinflation*** Disinflation C. Deflation*** Deflation A B A A B B 0 Time C A C
IV. Inflation and Interest Rates A. Nominal interest rate (NI) • What a bank pays you for your savings • What a bank charges you on a loan
IV. Inflation and Interest Rates A. Nominal interest rate (NI) • What a bank pays you for your savings • What a bank charges you on a loan B. Real interest rate (RI) • NI adjusted for inflation RI = NI – Inflation rate
According to the CPI, from July ’ 07 to July ’ 08, inflation was: 5. 0% RI = 3. 50% -- 5. 0% RI = -- 1. 5%
According to the CPI, from July ’ 07 to July ’ 08, inflation was: 5. 0% RI = 3. 50% -- 5. 0% RI = -- 1. 5% Savings rate: 0. 2%
According to the CPI, from July ’ 07 to July ’ 08, inflation was: 5. 0% RI = 7. 50% -- 5. 0% RI = 2. 5%
Nominal Interest Rate and Inflation Percent (per year) 15 12 Nominal interest rate 9 6 Inflation 3 0 1965 1970 1975 1980 1985 1990 1995 2000
Suppose NI is 5% with no expected inflation… 1. What is the RI? Suppose that inflation is expected to rise to 3%. 2. What is the new RI? 3. What is the new NI?
Suppose NI is 5% with no expected inflation… 1. What is the RI? Suppose that inflation is expected to rise to 3%. 2. What is the new RI? 3. What is the new NI? RI = NI – Inflation RI = 5% – 0% RI = 5% 5% RI = NI – 3% Inflation 5% = 8% – 3%
V. Winners and losers of unanticipated inflation A. Losers • Inflation robs real purchasing power from: o Those on fixed incomes Mr. Inflation
V. Winners and losers of unanticipated inflation A. Losers • Inflation robs real purchasing power from: o Those on fixed incomes o Savers earning no interest
V. Winners and losers of unanticipated inflation A. Losers • Inflation robs real purchasing power from: o Those on fixed incomes o Savers earning no interest o Savers / creditors earning less interest than inflation < PRICE S
B. Winners • Debtors*** Paid in fu ll
B. Winners • Debtors*** Today $500 K = Tomorrow $500 K =
VI. The Quantity Equation A. Velocity of money (V) • Average number of times per year a dollar is spent on final goods and services Spending Count: 2 3 4 5 1 Velocity = 5
VI. The Quantity Equation A. Velocity of money (V) • Average number of times per year a dollar is spent on final goods and services B. Multiplying V by the supply of money (M) tells us total spending in an economy. C. The Quantity Equation is… M×V=P×Y Amount of goods Amount of and services money in an produced Average economy How often it changes price of all hands items sold
VI. The Quantity Equation A. Velocity of money (V) • Average number of times per year a dollar is spent on final goods and services B. Multiplying V by the supply of money (M) tells us total spending in an economy. C. The Quantity Equation is… MV = PY • Where… o P is the average price at which each unit of physical output is sold o Y is the physical volume of all goods and services produced
Suppose there is only one five dollar bill in the economy… M = $5 $5
Suppose there is only one five dollar bill in the economy… M = $5 $5 V=3 P $5 P == ? $5 Y=? Pizza, Troll, Sunglasse s $5
Suppose there is only one five dollar bill in the economy… M = $5 $5 $5 V=3 × 3 P = $5 $5 Y = P, T, S × 3 $5
M = $5 V=3 P = $5 Y = P, T, PY is Nominal. SGDP Real GDP = ?
Real GDP = Nominal GDP ÷ Price Level Real GDP = PY / P Real GDP = Y
C. The Quantity Equation is… MV = PY • Where… o P is the average price at which each unit of physical output is sold o Y is the physical volume of all goods and services produced • PY is nominal GDP • Y is real GDP
D. Any change in M must be offset by a change in one of the other three variables. • But, V is generally thought of as constant (stable)… • And M (a nominal variable) does not affect Y (a real variable). • Thus… MV = PY o Increases in M cause increases in P (inflation)
Nominal GDP, the Quantity of Money, and the Velocity of Money Indexes (1960 = 100) 2, 000 Nominal GDP 1, 500 M 2 1, 000 500 Velocity 0 1965 1970 1975 1980 1985 1990 1995 2000 2005