Gross Domestic Product Gross domestic product the market


 because")


- Slides: 24
Gross Domestic Product • Gross domestic product – the market value of all final goods and services produced annually. • Example 1: Cindy’s Cinnamon Rolls produced and sold 100, 000 cinnamon rolls in 2017 and had sales revenue (including sales tax) of $300, 000. Cindy’s production had a market value of $300, 000 and thus added $300, 000 to GDP in 2017. In 2018, Cindy’s produced and sold 110, 000 cinnamon rolls and had sales revenue (including sales tax) of $357, 500. Thus, Cindy’s production added $357, 500 to GDP in 2018.
Exclusions from GDP • 1. Intermediate Goods • An intermediate good has not yet reached its final user, but rather is an input in the production of another good or has been purchased for resale. • See Examples 2 A and 2 B in the textbook.
Exclusions from GDP • • 2. Nonproduction transactions a. Used goods See Example 3 on page 5 -2. b. Financial transactions See Example 4 on page 5 -2. c. Transfer payments See Example 5 on page 5 -2.
Exclusions from GDP • 3. Nonmarket production • Do-it-yourself production is an example of nonmarket production. • See Example 6 on page 5 -2.
Exclusions from GDP • 4. Underground production • Production may be underground (unreported) because it is illegal or because the producer is evading taxation. • See Example 7 on page 5 -2.
Exclusions from GDP • 5. Leisure • An increase or a decrease in leisure time affects the quality of life, but does not directly affect production. • See Example 8 on page 5 -3.
Exclusions from GDP • 6. Economic bads • No adjustment is made to GDP for pollution or for unwanted destruction of property. • See Example 9 on page 5 -3. • An economic bad could increase GDP.
Two Measures of Total Output • Total Output can be measured as the sum of Total Expenditures (Gross Domestic Product). • Total Output can be measured as the sum of all payments to resource owners (National Income).
Total Expenditures • • 1. Consumption 2. Investment a. new capital goods b. changes in business inventories c. new residential housing 3. Government purchases 4. Net exports
Net Exports • Net exports equals exports minus imports. • Exports – total foreign purchases of domestic goods. • Exports need to be added to GDP since they will not be included as part of domestic consumption, investment, or government purchases. • See Example 12 on page 5 -4.
Net Exports • Imports – total domestic purchases of foreign goods. • Imports need to be subtracted from GDP since they will be included as part of domestic consumption, investment, or government purchases. • See Example 13 on page 5 -4.
Total Expenditures for 2017 • Total Expenditures: • Consumption $13, 321 billion • Investment 3, 368 billion • Government Purchases 3, 374 billion • Net Exports - 578 billion • Gross Domestic Product $19, 485 billion
National Income • • • 1. Employee compensation 2. Proprietors’ income 3. Corporate profits 4. Rental income 5. Net interest income
Per Capita Output • When comparing different economies, per capita output numbers may be more informative than total output numbers. • e. g. India’s total output is much greater than Switzerland’s, but Switzerland’s per capita GDP is much higher than India’s.
Per Capita Personal Income • There is significant variation in the per capita personal income in the different states. • See Example 15 on page 5 -5.
Real GDP – GDP adjusted for changes in the price level. • Example 16 A: GDP was $5, 963 billion in 1990 and was $6, 158 billion in 1991. What was Real GDP in 1991, adjusted to the 1990 price level? The GDP deflator was 66. 2 in 1990 and was 68. 5 in 1991. • Real GDP (1991) = Nominal GDP for 1991 ÷ (Deflator for 1991 ÷ Deflator for 1990) = $6, 158 B ÷ (68. 5 ÷ 66. 2) = $6, 158 B ÷ 1. 0347 = $5, 951 B
Real GDP • Example 16 B: GDP was $6, 158 billion in 1991 and was $6, 520 billion in 1992. What was Real GDP in 1992, adjusted to the 1991 price level? The GDP deflator was 68. 5 in 1991 and was 70. 0 in 1992. • Real GDP (1992) = $6, 520 B ÷ (70. 0 ÷ 68. 5) = $6, 520 B ÷ 1. 0219 = $6, 380 B
Real GDP • Example 16 C: GDP was $14, 452 billion in 2007 and was 14, 713 billion in 2008. What was Real GDP in 2008, adjusted to the 2007 price level? The GDP deflator was 96. 2 in 2007 and was 98. 1 in 2008. • Real GDP (2008) = $14, 713 B ÷ (98. 1 ÷ 96. 2) = $14, 713 B ÷ 1. 0198 = $14, 427 B
The Business Cycle • 1. Expansion – when Real GDP is increasing. • 2. Peak – the highest phase of the business cycle. • 3. Contraction – when Real GDP is decreasing. • 4. Trough – the lowest phase of the business cycle.
GDP and Standard of Living • As a measure of standard of living, GDP contains a number of flaws, including: • 1. GDP does not include nonmarket production. • 2. GDP does not include underground unreported) production. • 3. GDP does not include differences in leisure time. • 4. GDP does not adjust for economic bads.
Historical Data on Nominal and Real GDP • From 1978 to 2017, U. S. nominal GDP increased by over 8 -fold. • From 1978 to 2017, U. S. Real GDP increased by almost 3 -fold.
U. S. Nominal and Real GDP Year 2010 Nominal GDP $14, 992 billion Real GDP (2012 Base) $15, 599 billion 2011 15, 543 billion 15, 841 billion 2012 16, 197 billion 2013 16, 785 billion 16, 495 billion 2014 17, 522 billion 16, 900 billion 2015 18, 219 billion 17, 387 billion 2016 18, 707 billion 17, 659 billion 2017 19, 485 billion 18, 051 billion
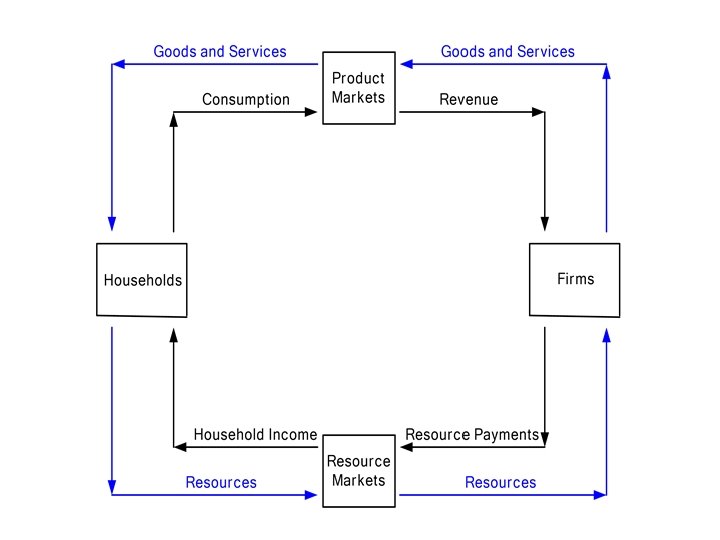
Circular Flow Diagram • A simple circular flow diagram illustrates the flow of goods and services through product markets and the flow of resources through resource markets. • See next slide.