Childrens Savings Underserved Studies and Policy and Project


 November 16,")


 are a potentially untapped market,")


 § Among the Banked, a majority of persons use")
 § Among the Unbanked, the most common financial transaction")
 of all Banked have experienced an")


 50%")
 50% 40%")


 100% 21%")


. • Generally prohibits")


- Slides: 135
Children's Savings, Underserved Studies, and Policy and Project Updates November 16, 2010
Opening Remarks Diana L. Taylor Chairman, Advisory Committee on Economic Inclusion Sheila C. Bair Chairman, FDIC
Children's Savings Accounts Moderator: Peter Tufano, Sylvan C. Coleman Professor of Financial Management, Harvard Business School, Founder and CEO of D 2 D Fund, Savings Work Group Chairman José Cisneros, Treasurer for the City and County of San Francisco Robert A. Annibale, Global Director, Citi Microfinance and Community Development Katryn Gabrielson, Deputy General Counsel, Finance Authority of Maine Robert Friedman, General Counsel, Founder, and Chairman of the Board, CFED
Listening to Consumers: Informing the Regulatory Agenda Peter Tufano Harvard Business School and Doorways to Dreams Fund, Inc. Study done in conjunction with TNS , a WPP Company
A critical time • New sense of importance and urgency around consumer finance businesses • Re-examination of many consumer financial regulations • New Bureau of Consumer Financial Protection
What should be the agenda? • First principles: Market failures and consumer decision making as basis for regulation. Campbell, Jackson, Madrian and Tufano (2010) • Politics: Whose voice is the loudest? Most persistent?
A revolutionary concept • Polling informs political campaigns • Market research informs product design • Why not ask Americans about their regulatory “pain points? ” • Sufficient cross sectional data to see which problems bother which consumers
First look, first study • National study of Americans • Internet-administered survey – Weighted to be representative, up to a point – Need follow up survey to probe deeper and certain groups – N = 2276 • Administered October 2010
Overall Satisfaction with Financial Regulations • “To what degree do you think that your household’s financial interests are appropriately protected today by laws and regulations? ” – Appropriately protected – Neither – Not appropriately protected 46% 27% 28%
Segments that feel less well protected Category Indebted Americans – Carry some debt – Overindebted Financially fragile ($2 K/30 days): Users of certain financial products – Mortgages – Credit card carrying balances – AFS User D % Inapprop. 6 – 11 16 -25 11 -12 7 -8 Pct 5 -9 7 -8
Identification of Pain points • “The financial landscape is likely to change over the coming years. Independent regulators and businesses will be carefully examining many issues to determine where they should focus attention. Suppose you could talk directly to them about how satisfied you are with the current financial landscape, as it relates to credit cards, personal loans, mortgages, banking, credit scores, debt management, investments, retirement accounts and financial skills and advice. For each of the following (45) choices, identify how satisfied you are…”
Dis-Satisfaction with Current Financial Landscape Total Population, aged 18 -64
Only first peek • Preliminary results: Perhaps can inform regulatory agenda by listening to consumers – How to weigh disatisfaction? • More cross sectional analysis to come • Hopefully augment sample
Starting Young: Childrens’ Savings Accounts
Basic Statistics on American Children • Approximately 4. 3 million children were born in 2007. • Children and poverty (2008) – 20. 7 percent of all children are in poor families (vs. 14. 3% of all Americans) – Among Blacks and Hispanics, the fraction of children in poverty is 35. 4% and 33. 1% respectively. Sources: CDC Nataional Vital Statistics System (http: //www. cdc. gov/nchs/births. htm); National Poverty Center (http: //www. npc. umich. edu/poverty/#2)
The Logic of CSAs • Start early: power of compound interest • Support asset building: better pay for educational expenses (and other investments) at age of majority • Universal: address intergenerational transmission of poverty/opportunity. • Plumbing: makes child part of financial system • Jump-starting: Encourages financial literacy and other savings
Global Child and Youth Savings Accounts • Programs in Canada, South Korea, Singapore and the United Kingdom; pilots in developing countries. • Most feature accounts opened by or with the government with government matches. • A few statistics – Canada opened over 3 million accounts since 1998 – UK reported participation rate of 74% with £ 289 average annual contribution – Singapore matches can reach up to U. S. $18, 000
Children’s Savings Programs in the United States • The most prominent children’s savings program in the U. S. is the taxadvantaged Section 529 plan, which tends to benefit higher income families. • There is no federal program to establish children’s savings accounts, although legislation with match dollars has been proposed several times (ASPIRE Act). • Some nonprofits, states and municipalities have launched or planned youth and children’s savings programs. • A few statistics: – SEED, the oldest program, had average balances of more than$1, 800 after 4 years – Maine’s Alfond Challenge - about 40% participation in year one – KIPP, pilot to provide 50, 000 low-income students with seeded account and college prep services – San Francisco and San Antonio programs are starting up with match funds; promotional efforts are targeted to LMI children
Today’s Speakers • Jose Cisneros, Treasurer of the City and County of San Francisco • Robert A. Annibale, Global Director, Citi Microfinance and Community Development • Katryn Gabrielson, Harold Alfond College Challenge • Bob Friedman, Founder and Chairman of CFED
KINDERGARTEN TO COLLEGE LOCAL INNOVATION, NATIONAL IMPACT José Cisneros San Francisco Treasurer’s Office of Financial Empowerment City and County of San Francisco
TODAY IS THE FIRST DAY OF COLLEGE. IT JUST LOOKS LIKE KINDERGARTEN. In fall 2010, the City and County of San Francisco will launch the first universal matched Children’s Savings Account (CSA) program in a public school system in the country. San Francisco’s Kindergarten to College initiative will open a savings account for all children entering kindergarten in the City’s public schools, putting San Francisco at the forefront of efforts to model how a national Child Savings Account policy could be implemented in the United States.
WHY SAN FRANCISCO? • We have the lowest number of children per capita of any major City in the nation – 14%, down from 25% in 1960 • Despite a median household income of $70, 000: • almost 14% of children live in poverty • over half of all students enrolled in San Francisco’s public schools enroll in free and reduced lunch • San Francisco public schools are incredibly diverse: • 32% identifying as Chinese, 23% as Latino and 12% as African American. • Almost 30% of our students are learning English as a second language. • In the 2008 -2009 school year, 69. 5% of SFUSD graduates enrolled in postsecondary education. • Significantly lower for African-American (54. 6%) and Latino (52%) students.
PROGRAM GOALS Create a college going culture. A child with a college savings account in any amount is seven times more likely to attend college than one without, regardless of income, race or academic achievement. K 2 C will increase academic aspirations for every child by making college a reality from the first day of school. Reduce financial exclusion. Low-income and minority families are overwhelmingly excluded from mainstream financial products that build wealth. One in three San Francisco children are born into families with no savings or assets of any kind, one in two for African American and Latino children. K 2 C will help parents begin saving by simplifying the process for opening a college savings account and incentivizing deposits.
PROGRAM GOALS Increase Financial Literacy. K 2 C will be the vehicle that incorporates financial education into our school classrooms, as part of the math curriculum. With K 2 C, our schools can create a culture of savings, improve financial literacy, increase assets, and bring more children and families into the financial mainstream. Leverage private investment in San Francisco families. K 2 C will leverage private funds for savings matches, create behavioral incentives, and help families earn money for college at significantly higher rates than they can earn by saving on their own.
PROGRAM DESIGN Designed to reach the main success factors identified for CSAs: • Auto-enrollment • Universality • Publicly funded seed deposit • Matched savings opportunities • Range of deposit options • Financial education
THE BASICS • Every child entering a kindergarten class in a San Francisco public school will automatically receive a college savings account with an opening deposit of $50 from the City of San Francisco. • An additional $50 deposit is provided to the accounts of children eligible for free and reduced lunch • Seed funding estimated at $100 k for year one • Families will be able to contribute to the accounts by mail, in-branch, by ACH or online • Matched savings and incentives are available to all families. • Culturally and developmentally appropriate financial education will be provided to parents/caregivers and children.
MATCHES AND INCENTIVES • Limited to activities linked to financial or academic behavior, and verifiable by the school district or financial partner • All matches and incentives provided through philanthropy • Every family is eligible for a $1: $1 match for the first $100 in savings. • Families signing up for auto-deposit will receive a $50 bonus after 6 months • Parents will receive funds to the account for attending financial education • Children will receive a monthly incentive for on-time daily attendance of 95%
CHALLENGES 1. Auto-enrollment creates significant issues related to account ownership, patriot act and tax reporting • K 2 C cannot require parent signatures for account opening, creating significant regulatory and legal hurdles • Need to open accounts with very little information • Working within the school district mitigates some of these challenges 2. Universality means opening accounts without social security numbers, adding to account challenges. • Public schools mitigates some criticisms about high-wealth families 3. Unattractive to financial providers due to reluctance to administer large numbers of small dollar accounts for primarily LMI market 4. Political challenges especially in the current budget climate. CSAs can also be complicated to explain and results won’t be seen for some years
ACCOUNT STRUCTURE Began by looking at 529 s and other products, and issuing an RFI • City of San Francisco will open all accounts using our tax ID number, with sub accounts for each child • City will provide basic information, obtained from SFUSD, to financial partner to open sub accounts • Signed consent form will allow SFUSD to release additional information to the City • Parents will receive an account number to make deposits. No withdrawals will be allowed unless for an emergency • Money will be held in trust in the child’s name until use for postsecondary education • City will track incentives and matches • Parents and children will be able to view accounts online
ROLL-OUT • Launching in 2010 with 18 schools throughout San Francisco; represents 25% of students • Public launch occurred in San Francisco in October and student accounts open in December. • Engaged in community and family outreach to to sign consent forms and prepare for account opening. • Number of enrolled schools will double in 2011, and we will reach full roll out in 2012 – approximately 5, 000 students
KEY PARTNERSHIPS • City partners include Mayor’s Office, Treasurer’s Office, Department of Children Youth and Families, SFUSD • Bulk of program design, implementation and administration through Office of Financial Empowerment • SFUSD responsible for school site administration, classroom financial education, data transfer • DCYF and grantees participate in outreach and support • Citibank will open and maintain accounts • Key non-profit partners: EARN, CFED, New America Foundation • Evaluation and research partners from Stanford University
SAVE STEADY. DREAM HUGE. Leigh Phillips Anee Brar Manager Office of Financial Empowerment City and County of San Francisco (415) 554 -4320 Leigh. phillips@sfgov. org K 2 C Program Manager Office of Financial Empowerment City and County of San Francisco (415)554 -4453 Anee. brar@sfgov. org
Students’ Savings: Building a Banking Platform Reaching Scale through Partnerships Bob Annibale Global Director, Citi Community Development and Citi Microfinance November 16, 2010
Citi’s Historic Role in Matched Savings • Over the past decade Citi has been the leading philanthropic investor in matched savings programs. • Our efforts go back to 1997 when the Citi Foundation provided a $1 MM grant to CFED to establish the American Dream Demonstration. We renewed this support for the SEED Children's Savings Demonstration and in 2010 funded a new effort – Partnership for College Completion. • Citibank serves 4, 000 of the 15, 000 active IDA accounts. ¹ • While many of these efforts have produced positive outcomes for low-income households, these efforts are not financially sustainable and have not attained the projected level of scale required to result in systemic change. • After a decade of work in this arena, we stepped back to understand how could we build a matched savings effort that was both effective and efficient? Our objective now is to develop a students’ savings initiative that is both scalable and financially sustainable, and ensures the next generation of consumers enter adulthood with their feet firmly planted on the path to economic success Strictly Private and Confidential 34 1. CFED, 2009 -2010 IDA Program Survey, http: //cfed. org/assets/pdfs/2009 -2010_IDAProgram. Survey. pdf
Sustainable and Scalable Programs • Reaching scale through savings banking relationships with nonprofits, schools, and municipalities that administer the students’ savings account program across several schools or networks. • Efficiencies and simple account opening through custodial account model. Students’ Accounts are deposit-only, with no fees or minimum balances, and paperless, delivered through a custodial account relationship that allows for streamlined account opening. • Easy and engaging access to promote usage. Students and their families can make deposits easily and view account activity, including incentives, through the Program Website. The Program incorporates financial education and incentives to make saving a routine habit. Citi Platform supports efficient savings programs to reach scale through private and public partnerships Strictly Private and Confidential 35
Features and Benefits of the New Platform • Enables universal enrollment. Custodial Account structure allows for all participants, as determined by the Program Sponsor, to be eligible for enrollment and for enrollment to be handled by the Program Administrator. • Simple account management and incentive tracking. Administrative Portal facilitates management of students’ accounts and administering of program matches and incentives by providing online tools and the ability to create a variety of reports. • Easy to build savings. Students and their families can make deposits at Citibank branches, through direct deposit, wire transfers, and via the mail. • Engaging students. Students will be able to view both savings they deposited and incentives they earned via a customized website. We are exploring additional ways to make goal setting and program experiences more interactive and fun. Key enhancements for easy program administration and to engage students Strictly Private and Confidential 36
Students’ Development Account Program Model Provides product and platform, which houses no fee, deposit-only accounts with easy deposit procedures for students and their families, and account viewing via a customized website Encourages parents and students to participate in the Program through: Bank • Classroom financial education • Incentives and Matches School Greater financial resources to facilitate higher education Administrator Owns accounts and ensures all are funded according to the specific program guidelines Opens and manages accounts for the benefit of the students and oversees program guidelines *Roles Strictly and responsibilities are defined and documented for each individual program Private and Confidential Custodian 37
Student-facing Account Process Enroll & Save As part of school enrollment, students are offered an incentivized, deposit-only College Savings Account to help them on their path to college graduation Learn & Save Students learn to save through incentive programs, online and classroom education, and progress updates on innovative Program Website College Success At the time of enrollment in college, students will have access to their savings and financial skills to successfully complete college This Student Savings Program complements a student’s academic preparation for college by building parallel savings behaviors and knowledge Strictly Private and Confidential 38
The Harold Alfond College Challenge Katryn Gabrielson Finance Authority of Maine (FAME) November 16, 2010
The Harold Alfond College Challenge • A legacy gift of higher education through the Alfond Scholarship Foundation for every Maine resident baby, regardless of family income • A commitment to award $500 to a college investing plan account • An opportunity to change the way Mainers think about and plan for higher education
Transform Lives with Education $7, 000 14, 000 Babies Each and Every Year
Harold Alfond’s Dream • Mr. Alfond – Was passionate about Maine and its people – Encouraged teamwork by creating community challenges – Knew education was the key to success – Believed every Maine child deserved an opportunity to pursue higher education
$500 Alfond Grant • Invested in Maine’s Section 529 Plan • Must open account by first birthday • Funds available for qualified higher education expenses up to age 28 • No additional investment required, but encouraged
Challenges • Complete and timely account applications • Complex for those with literacy and financial literacy challenges • Timing: after baby is born, must wait for social security number (and sometimes name) • New parents already facing struggles • Costs of administration • Creating aspirations • Encouraging additional contributions
Meeting the Challenges • Partners: hospitals, physicians groups, financial advisors, employers, banks • Outreach Staff • Direct Marketing using vital statistics data • Casting Calls • Consumer Education • Health, Numeracy, Literacy, and Financial Literacy Brochures • Quarterly account summaries
How Banks Help Accessible and familiar, trusted financial experts • Display posters and brochures • Distribute enrollment material • Assist with applications • Expanded customer service opportunities – Advise, help budget, assist with preparing for costs of college – Give employees with new baby “matching gift” – Give bank customers $50 towards college investing accounts
Early Signs of Success • • Over 7, 000 Maine babies enrolled in two years 40% of all babies enroll by their first birthday Over 25% make additional contributions “Sibling” accounts
Children's Savings Accounts Moderator: Peter Tufano, Sylvan C. Coleman Professor of Financial Management, Harvard Business School, Founder and CEO of D 2 D Fund, Savings Work Group Chairman José Cisneros, Treasurer for the City and County of San Francisco Robert A. Annibale, Global Director, Citi Microfinance and Community Development Katryn Gabrielson, Deputy General Counsel, Finance Authority of Maine Robert Friedman, General Counsel, Founder, and Chairman of the Board, CFED
Break
Underserved Studies Moderator: Barbara A. Ryan, Deputy to the Vice Chairman Eleni Constantine, Director Financial Security Portfolio, Pew Charitable Trusts Tammy Edwards, Community Affairs Officer, Federal Reserve Bank of Kansas City Betsy Costle, Director of Consumer and State Affairs, AARP Public Policy Institute
Los Angeles Banking Study Wave One Results Revised 10 November 2010
Study’s Purpose } Identify and measure the financial service needs, perceptions and behaviors of low-and moderate-income households in eight neighborhoods of Los Angeles } Inform and evaluate the efficacy of publicly-led programs, which aim to connect qualified unbanked households to specific banking opportunities, especially Los Angeles’ Bank On programs } Determine the effects of being or becoming banked on specific health outcomes } Provide a basis for policy solutions on a local, state or national scale 52
Survey Methodology } Customized random location sampling to ensure inclusion and representation } Two waves – July – September 2009 – July – September 2010 } Door-to-Door approach with bilingual surveyors to address sensitivity of subject matter, ensure accuracy and maintain contact with a transient population } Panel of 2021 households from eight targeted neighborhoods – Boyle Heights: 298 households – South Figueroa Corridor: 177 households 53
Topline Findings 54
Segmentation of Research Panel § The panel of 2, 021 respondents was nearly evenly divided between Banked respondents (N = 1000) and Unbanked respondents (N = 1021). Banked Unbanked Banked only 37% 29% Unbanked AFS Unbanked Cash only Banked and AFS 63% N = 1, 000 71% N = 1, 021 B 1. When it comes to financial services, which of the following types of establishments do you use? Financial services can include depositing checks, cashing checks, managing your money in an account, borrowing money, sending money, paying bills, and others. Please select all that apply. BASE: Total banked respondents, N = 1, 000; Total unbanked respondents, N = 1, 021 55
Segmentation of Banked Population § 63% of the Banked population exclusively use banks, while the remaining 37% use a combination of banks and alternative financial service (AFS) providers like check cashers, supermarkets, and liquor stores for financial services. Of these “underbanked” users, 78% use AFS providers at least once a month. In the FDIC study, the ratio of banked-underbanked is 80/20. Pew Study (8 target neighborhoods) FDIC Study (LA-Long Beach MSA 20% 37% Banked only 63% Banked and AFS 80% B 1. When it comes to financial services, which of the following types of establishments do you use? Financial services can include depositing checks, cashing checks, managing your money in an account, borrowing money, sending money, paying bills, and others. Please select all that apply. BASE: Total banked respondents, N = 1, 000 56
Segmentation of Unbanked Population – AFS Users vs. Cash § 71% of the Unbanked population solely use AFS providers, while the remaining 29% use no AFS providers at all, choosing to transact exclusively in cash. For the FDIC study, one-quarter of the unbanked are cash-only users, while the remaining use AFS providers. FDIC Study (LA-Long Beach MSA Pew Study (8 target neighborhoods) 29% Unbanked AFS Unbanked Cash only 25% 71% B 1. When it comes to financial services, which of the following types of establishments do you use? Financial services can include depositing checks, cashing checks, managing your money in an account, borrowing money, sending money, paying bills, and others. Please select all that apply. BASE: Total unbanked respondents, N = 1, 021 57
Perceptions of Personal Financial Health § The Banked generally rate their financial health higher than the Unbanked. The Unbanked say they cannot make enough money to pay their bills at a higher rate than the Banked. § More than twice as many Banked (24%) are earning enough to pay their bills AND save for the future than the Unbanked (11%). About half of all surveyed, Banked or Unbanked, are making enough to pay bills but not save. 11% I'm making enough to pay bills and save for the future 24% 51% I'm making enough to pay bills but not to save for future 49% 38% I'm not making enough to pay regular bills 27% UNBANKED IE 1. Which of the following best characterizes your financial situation? BASE: Total Banked respondents, N = 1, 000, Total Unbanked respondents, N = 1, 021 58
Unbanked Segment Banking History § Newcomers: Most Unbanked (63%) are a potentially untapped market, having never had a bank account before anywhere. § Opting Out: Many Unbanked (22%) previously had an account, but voluntarily chose to close it and remain unbanked § Kicked-Out: Some Unbanked (9%) previously had an account, but can’t get one now § International: Few (3%) were banked in another country, but remain Unbanked here. 63% Never had an account (anywhere) 22% Had an account but chose to close it 9% Had an account but now can't get one Had an account in another country 3% M 1. You said you do not currently have any accounts at a bank or credit union. Which one of the following statements best describes you? BASE: Total unbanked respondents, N = 1, 021 59
Customer Satisfaction: Banked vs. Unbanked § Both the Banked and Unbanked express high satisfaction with their current financial service provider. The Banked do not express a higher level of satisfaction with their provider than the Unbanked. 7 pt. scale Banked Unbanked % Top 2 Box 72% 69% % Bottom 2 Box 4% 3% 6 5. 9 Mean Score A 5 a. In general, how satisfied are you with the experience you receive at the [financial institution] you mainly use? Please rate your experience on a scale of 1 to 7—where 1 is “not satisfied at all” and 7 is “very satisfied”. BASE: Total Banked respondents, N = 1, 000, Total Unbanked AFS respondents, N = 721 60
Primary Reason For Using Particular Financial Institution § Overwhelmingly, the main reason for selecting a bank is geographic proximity (i. e. located close to where I work or live) § 85% of the AFS Users use a provider because it’s nearby. 63% of these users patronize a check cashing service within walking distance § 60% of the Banked use a provider because it’s nearby. 33% patronize a bank or credit union within walking distance, 82% within a 10 -minute drive Banked Total Un. Banked (AFS) Total Located close to where I live / work 60% Close to where I live / work 85% Has a lot of branches 27% Open at convenient hours 15% Has environment I feel comfortable in 19% Environment 14% Has bank reps that speak my native language 17% Close to where I shop 13% Recommended by family / friends 13% Reps native language 9% Bank offered me free checking 13% Better customer service 9% A 6. / CC 7. Thinking of the [financial institution] you are currently using, what were your reasons for selecting this [financial institution]? Select all that apply BASE: Total Banked respondents, N = 1, 000, Total Unbanked AFS respondents, N = 721 61
Trustworthiness of Financial Institutions § Generally, the Banked trust banks at a high level (mean score 5. 6 – 7 pt scale). However, they do not trust credit unions, check cashers, supermarkets, or liquor stores. § Generally, the Unbanked trust check cashers at a high level (mean score 4. 8 – 7 pt scale). They also trust banks and supermarkets, but to a lesser extent. However, they do not trust credit unions or liquor stores. 57% Banks 38% 29% Credit Unions 25% Check Cashers 43% 28% Supermarkets Liquor Stores % Top 2 Box Scores (7 pt. scale) 25% 38% 8% 16% BANKED UNBANKED B 4. On a scale of 1 to 7, where 1 is “not at all trustworthy” and 7 is “very trustworthy”, how much do you trust the following types of establishments when it comes to using them for financial services? BASE: Total Banked respondents, N = 1, 000, Total Unbanked respondents, N = 1, 021 62
Product / Service Usage (Banked) § Among the Banked, a majority of persons use at least five (5) products or services, including the ATM (81%), Debit Cards (81%), Checking Accounts (79%), Check Cashing, either at a bank or AFS (67%), and Savings Accounts (60%). § Among the Unbanked, but previously banked, similar levels of usage were reported among basic banking products: ATM (71%), Debit Cards (62%), Checking Account (67%), Check Cashing (62%), Savings (55%). ATM 71% Debit Card 67% Check cashing 62% Savings account Money Order Remittance 81% 62% Checking account 55% 26% 25% 21% BANKED 31% 81% 79% 67% 60% Mean no. of products used: Banked = 5. 5 Previously Banked = 4. 5 PREVIOUSLY BANKED B 5 a. /b. Which of the following types of financial products or services do you currently have or use at a [bank or credit union/at any institution]? BASE: Total Banked respondents, N = 1, 000, Total Unbanked/Previous Banked respondents, N = 313 63
Product / Service Usage (Unbanked) § Among the Unbanked, the most common financial transaction is paying bills (74%). A much smaller group use AFS providers to cash checks (40%). Other primary transactions at an AFS provider include purchasing prepaid calling cards (56%) and money orders (51%). 74% Paying bills 56% Pre-paid calling card 51% Money order 40% Check cashing 33% Remittance 4% Pre-paid debit card Payday advance loan 1% B 6 a. Which, if any, of the following types of financial products or services did you use at any type of institution? BASE: Total Unbanked Respondents, N = 1, 021 64
Adverse Experiences At Bank § Nearly half (43%) of all Banked have experienced an NSF/OD fee. One quarter (25%) have been charged a fee they did not understand. At least one in ten have been denied an account (10%), denied a loan or credit (19%), had the interest rate unexpectedly raised on their credit cards (16%), or been treated rudely (11%). All of these rates of adverse experiences are higher among the previously banked, who now are unbanked. 43% Charged a fee for insufficient funds or overdraft 25% Charged a fee that I did not understand 38% 19% Denied a loan or credit 16% 15% Had the interest rate raised on credit card 11% Been treated rudely 10% Denied an account 7% Had private info given to other companies Sold a product you did not understand 46% 4% BANKED 17% 10% 7% PREVIOUSLY BANKED A 7. Have you ever encountered any of the following challenges at a bank or credit union? BASE: Total Banked respondents, N = 1, 000, Total Unbanked/Previous Banked respondents, N = 313 65
Reasons For Leaving A Bank § Among the Banked, the strongest justification for leaving one’s current bank is “being charged new fees without explanation”. The second strongest justification for leaving one’s current bank is a bank “stopping to support one’s culture or community”. The weakest justification for leaving one’s current bank is “a bank being bought or taken over by another bank” You were charged new fees without explanation 72% You were treated rudely by a bank employee 62% The bank stopped supporting your culture or community 56% Your fees were raised on your checking / savings accounts 54% You were charged overdraft fees without waiver 51% Your credit card interest was increased 48% You were denied a loan or additional credit 40% Your credit card limit was reduced 37% Lines at the bank / credit union became longer 34% Parking became more difficult 33% Bank employees only spoke English 33% Bank materials / signage were only in English The bank was taken over by another bank 30% 28% % Top 2 Box Scores (7 pt. scale) A 8. On a scale from 1 – 7, where 1 is “very unlikely’’ and 7 is “very likely”, how likely would you be to leave your bank or credit union due to the following issues? BASE: Total Banked respondents, N = 1, 000 66
Account Overdraws § Among the Banked, 56% have never overdrawn their account. Of those who have overdrawn their account, 72% “did not know they were out of money”. Only 15% knew they were out of money, but wrote the check anyway. . C 3. Three x or more Twice C 4. 18% Other 11% I did not know I was out of money Once Never 72% 15% 56% I knew I was out of money, but wrote check anyway 15% C 3. In the past year, about how many times would you say you have written a check or withdrawn money from an account, but did not have sufficient funds to cover it? C 4. Which one of the following best describes your reason for overdrawing your account in the past year? BASE: Total Banked respondents and have checking account, N = 786 (C 3), Respondents overdrawn, N = 342 (C 4) 67
Account Overdraws § A robust 29% felt that at the point-of-sale card swipe was the best place to alert a customer of a potential overdraft. Similarly, 29% also felt that a text message alert was the best means of sharing a warning. Trailing closely behind, 26% cited being alerted through their monthly bank statements. C 5. At a point of sale card swipe 29% Through text message alert 29% Through email message Through monthly bank statement 13% 26% C 5. Which one of the following would be the best way to alert you about possibly overdrawing your account? BASE: Respondents overdrawn, N = 342 68
Form of Household Income § Among the Unbanked, 41% get paid in cash from their jobs (60% on their secondary job). If earners are paid in cash, 88% will keep money in the household and spend with no intent to save. 21% Cash 41% 75% Check Direct Deposit Don't Know 60% 27% 1% 2% 1% BANKED UNBANKED IE 7. How are you paid in each job? Is it by cash, check or direct deposit to your bank? IE 8. When you get paid in cash, what do you do with it? Do you… BASE: Total Banked respondents, N = 1, 000, Total Unbanked respondents, N = 1, 021 69
Form of Household Income: Check § Among the Banked, 75% are paid by check. If earners are paid by check, 73% deposit the check into a bank account and spend from there. Even if paid in cash, 27% deposit their earnings into their account. If paid by check, 18% simply cash the check at a bank and keep the money. A few (4%) take it to a check casher. If Paid by Check…. Deposit it all in bank and spend it from there 73% 2% 18% Cash the check at the bank and spend as needed Cash the check at check casher and spend as needed 17% 4% 74% BANKED UNBANKED IE 9. When you get paid by check, what do you do with it? Do you… BASE: Total Banked respondents, N = 1, 000, Total Unbanked respondents, N = 1, 021 70
Form of Household Income: Cash § Among the Unbanked, 41% get paid in cash from their jobs (60% on their secondary job). If earners are paid in cash, 88% will keep money in the household and spend with no intent to save. If Paid by Cash…. 46% Keep it all and spend as you need it 88% 28% Deposit it all in bank and spend it from there 1% 15% Keep some and deposit the rest in bank 1% BANKED UNBANKED IE 8. When you get paid in cash, what do you do with it? Do you… BASE: Total Banked respondents, N = 1, 000, Total Unbanked respondents, N = 1, 021 71
Safeguarding Money § Among the Banked, 91% keep some of their savings in a bank. Nearly half (47%) keep all of their savings in a bank. § Among the Unbanked, 94% keep none of their savings in a bank. All Most Half Some None 47% 1% 10% 0% 5% 1% 29% 2% 6% 94% BANKED UNBANKED AL 9. Which of the following best describes the share of your money you keep within banks or financial institutions? BASE: Total Banked respondents, N = 1, 000, Total Unbanked respondents, N = 1, 021 72
Check Cashing Usage § 67% of the Banked use Check Cashing services, and of those 78% cash checks at least once a month. Speaks to a high level of individuals going outside the banking system for liquidity. § 40% of the Unbanked use Check Cashing services, and of those 93% cash checks at least once a month. § 13% of the Unbanked have used Check Cashing services for more than 10 years; 42% 5 years or more, 74% more than two years § The average relationship with a check casher if higher for the Banked (avg. 8 years) than the Unbanked (avg. 5. 9 years). 4 or more times per month 8 16% 6% 5. 8 53% 2, 3 times a month 37% 24% once a month Less than once per month 35% 7% 18% UNBANKED UNBANKED CC 1. About how often do you use the services of a check cashing operation in a typical month? CC 6. How long have you been using check cashing services in the U. S. in general? BASE: Total Banked check cashing users, N = 150, Total Unbanked check cashing users, N = 413 73
Remittance Usage § Among Remitters, 57% of the Banked population still remit through an independent money transfer chain (20% remit through the bank). Half (50%) of Banked Remitters send money at least once a month, an average of $210 each time. § Logically, 84% of the Unbanked remit through an independent money transfer chain (4% remit at a bank though not a customer). 59% of Unbanked Remitters send money at least once a month, an average of $199 each time 84% Once every 4 - 6 mos. 11% 57% 25% Once every 2 - 3 mos. 29% 47% Once a month 39% 20% 4% BANKED Wire through money transfer chains UNBANKED Wire through US bank At least once every 2 weeks UNBANKED 12% 11% Avg. $ / mo. : Banked = $210 Unbanked = $199 BANKED MR 1. What is the most frequent method you use to send money to family or friends? MR 2. About how often do you transfer money to family or friends? MR 3 a. Approximately how much money do you send to family or friends in a typical month? BASE: Total Banked remittance respondents, N = 250, Total Unbanked remittance respondents, N = 333 74
Credit Aspirations § Regardless of status, persons were interested in obtaining credit for classic reasons, overwhelmingly to afford a home or education. Among the Unbanked, the need for credit to purchase autos is also strong. Banked Unbanked Home 48% Auto 15% 20% Education 24% 25% Household Expenses 20% 18% Medical Expenses 14% 12% Business Investment 12% 14% Retirement 14% 10% Travel 13% 9% Other 3% 2% CR 1. Assuming that credit is available to you, which of the following items would you use it for? Would you…? BASE: Total respondents, N = 2, 000 75
Household Expenditures § Estimated household expenditures on five reasonably consistent services were asked, to establish a baseline of spending. Among the Banked, average monthly expenditures of $1, 712 were documented on five basic needs. Among the Unbanked, average monthly expenditures of $1, 329 were documented on the same five basic needs. Estimated Monthly HH Expenses Banked Unbanked Rent / mortgage $989 $731 Utilities $207 $138 Phone $100 $64 TV $63 $52 Groceries $354 $344 $1, 712 $1, 329 TOTAL IE 19. Please estimate your monthly household expenses in the following categories BASE: Total Banked respondents, N = 1, 000, Total Unbanked respondents, N = 1, 021 76
Respondent Profile § Among the banked population, 82% of the respondent base is Hispanic, 16% are African American. For the unbanked, 86% are Hispanic, 12% are African American. Banked 16% Unbanked 12% Asian Black Hispanic White 82% BASE: N = 1, 000 Other 86% BASE: N = 1, 021 S 2. Which of the following best describes your ethnic background? Please select all that apply 77
Respondent Demographics Mean Score, 7 pt. scale Banked Unbanked 41 years 34. 5 years 65% 69% 21. 2 years 14. 4 years 4. 4 pp 4. 7 pp Non Tech / Non Professional 31% Homemaker 24% 34% Unemployed 12% 13% 7% 4% Less than high school / some HS 39% 51% HS graduate 32% 33% vocational / community college /some college 20% 14% 8% $29. 4 K 1% $17. 3 K Use The Internet? Yes 43% 30% Voted in any U. S. election in the past? Yes 43% 20% Mean Age Percent Foreign Born Avg. Length of Time in the U. S. Avg. Household Size Occupation Technical Education College graduate and higher Mean Annual Household Income 78
The Unbanked and Underbanked Consumer in the 10 th District Summary Findings from a Consumer Focus Group Research Initiative Tammy Edwards Assistant Vice President & Community Affairs Officer November 16, 2010
Consumer Focus Group Overview § The research explored reasons why and how unbanked and underbanked individuals use non-bank entities for basic financial transactions § Definitions: § Unbanked: no banking accounts § Underbanked: have a banking account but use other providers for check cashing, money orders, remittances or credit § Conducted 24 small focus group sessions in December 2009 and January 2010 § 76 individuals of varying age, gender, and ethnicity participated § Sessions conducted in Kansas City, Denver, Oklahoma City, and Omaha § 18 sessions in English, 6 sessions in Spanish § Strong similarities across markets
Unbanked & Underbanked Characteristics Unbanked and underbanked individuals: § Have limited and unstable income § Had bad experiences with bank fees – NSF / OD § Encountered unexpected fees that reduced balances § Had inadequate record keeping § Received no or limited financial education § See value in having a relationship with a bank Debra, Age 55, Underbanked, Denver
Unbanked & Underbanked Demographics
Key Findings The research indicates that: § This population has financial desires similar to mainstream consumers § Family influence molds future financial behavior Leemaur, Age 31 , Underbanked, § Transparency and finality of transactions matter Oklahoma City § There is a strong desire to have physical control of money § Alternative Financial Service Providers are easier to use § Misunderstanding about fees and product functionality is common § Financial education should start early in life and stress asset and credit building § A savings account is the desired entry point into a bank relationship
Implications This research highlights the unbanked and underbanked’s complex financial lives based on their perceptions, needs and options. Regulated lenders and financial educators can transition a portion of this consumer segment by: § Addressing the 4 “Cs” – Cost, Clarity, Convenience & Comfort § Expanding product and service options – i. e. Small Dollar Loan Programs § Implementing clearly defined Second Chance & Problem Resolution processes § Linking financial education to specific life events – new job, home purchase, auto purchase, etc.
Outcomes The research findings from this project are being used to: § Launch “Bank On” programs throughout the Tenth District § Explore culturally relevant workforce development initiatives § Develop targeted financial education content § Expand product and service options Edaena, Age 32, Unbanked, Kansas City
Resources Visit unbanked. kcfed. org for the full report and additional resources. Tammy Edwards Assistant Vice President & Community Affairs Officer Federal Reserve Bank of Kansas City 1 Memorial Drive Kansas City, MO 64198 816 -881 -2123 tammy. edwards@kc. frb. org Steve Shepelwich Senior Community Affairs Advisor Federal Reserve Bank of Kansas City, Oklahoma City Branch 226 Dean A. Mc. Gee Avenue, Suite 300 Oklahoma City, OK 73102 405 -270 -8675 steven. shepelwich@kc. frb. org
Underbanked and Unbanked Consumers Elizabeth Costle AARP Public Policy Institute
The AARP Public Policy Institute AARP is a nonprofit, nonpartisan membership organization that helps people 50 and over improve the quality of their lives. The Public Policy Institute (PPI) is the focal point of public policy research, analysis and development at AARP. PPI worked with the AARP Foundation to learn more about the older unbanked and underbanked population. AARP 88
Methodology q AARP purchased a custom analysis of CFSI’s 2008 Survey data focused on respondents 45 and older. q There were 2, 799 respondents age 18 and older, all underbanked or unbanked o o 1, 054 respondents were ages 45 -64 485 respondents were age 65 and older q CFSI combined age ranges to permit comparisons and inferences from responses: age groupings were 18 -44, 45 -64, and 65 and over. q CFSI cross-tabulated responses for specific survey questions with the following groups: unbanked vs. underbanked race/ethnicity, income, and employment status q All percentages on slides are based on unbanked or underbanked respondents only AARP 89
Methodology q “Unbanked “is defined as having no current checking or savings account q “Underbanked” is defined as having a current checking or savings account but made one or more non-bank financial transactions in the past 30 days. See report, A Portrait of Older Underbanked and Unbanked Consumers: Findings from a National Survey at http: //assets. aarp. org/rgcenter/ppi/econ-sec/underbankeconomic-full-092110. pdf AARP 90
Older consumers are more likely than consumers in all age ranges to have a checking or savings account. 76% 80% checking 59% 57% 60% 49% 41% 40% savings 37% 32% 20% 0% All ages (18+) (n = 18 to 44 (n = 1260) 45 to 64 (n = 1054) 2799) AARP 65+ (n = 485) 91
The likelihood of having a checking or savings account by income 100% 92% 80% 69% 60% 49% 46% 40% 20% 67% 59% 27% 24% 47% 38% 23% 29% 0% 45 to 64 (n = 876) 65+ (n = 364) 45 to 64 (n = 876) Savings <$10, 000 AARP 65+ (n = 364) Checking $10 to $25, 000 $25 to $50, 000 92
Older Latinos and Blacks less likely to have accounts than their white counterparts 90% 80% 75% 60% 56% 45% 41% 42% 30% 66% 62% 39% 26% 24% 15% 43% 47% 25% 0% 45 to 64 (n = 1024) 65+ (n = 484) 45 to 64 (n = 1024) Savings Hispanic AARP 65+ (n = 484) Checking Black White 93
Reasons for not having a checking account q Cost most important reason o Don’t have enough money to be useful was chosen most often o Hidden fees and charges o Too expensive o Minimum balance too high q Substantial concern about misuse of personal information q Also concern about documentation AARP 94
Reasons for not having a checking account 45% 41% 39% 37% 35% 30% 26% 19% 18% 14%14% 15% 20% 17%16% 12%13%12% 13% 18% 13% 12% 11% 6% 0% 18+ (n = 2, 799) AARP 18 to 44(n = 1, 260) 45 to 64 (n = 1, 054) 65+ (n = 485) Don't have enough money to be useful Concern about misuse of personal info. Hidden fees and charges Too much documentation required Too expensive Minimum required balance too high 95
Reasons for not having an account vary by race and ethnicity HISPANICS BLACKS WHITES Concern about misuse of personal info = 23% Concern about misuse of personal info = 51% Don’t have enough money to be useful = 32% Too much documentation required = 19% Don’t have enough money to be useful = 43% Concern about misuse of personal info = 20% Don’t have enough money to be useful = 16% Hidden fees and charges = 30% Hidden fees and charges = 16% AARP 96
Older consumers show a preference for conducting financial transactions in a bank or credit union; supermarkets the 2 nd most-preferred venue. 100% 80% 11% 6% 6% 6% 8% 4% 7% 60% 8% 4% 5% 6% 9% 6% 3% 2% 19% 23% 24% 21% 40% 43% 20% 55% 50% 35% 0% 18+ (n = 2, 799) AARP 18 to 44 (n = 1, 260) 45 to 64 (n = 1054) 65+ (n = 485) Other Super center Convenience store Check cashing outlet Supermarket Bank or credit union 97
Black and Hispanic older consumers show far less of a preference for banks and credit unions than Whites AARP 98
Most underbanked and unbanked people were satisfied with their financial transactions 100% 80% 60% 78% 75% 13% 10% 8% 8% 81% 84% 40% 20% 0% 18+ (n = 2, 799) 9% 18 to 44 (n = 1, 260) 45 to 64 (n = 1, 054) very or somewhat satisfied very or somewhat dissatisfied AARP 10% 9% 6% 65+ (n = 485) neither satisfied or dissatisfied 99
Reasons for satisfaction with their financial transactions 50% 40% 30% 26% 18% 17% 28% 22% 21% 19% 30% 29% 26% 22% 21% 19% 18% 26% 23% 21% 18% 24% 15%14% 25%25% 19% 17% 15% 10% 0% 18+ (n = 2, 799) 18 to 44 (n = 1, 260) Fees are affordable Staff always helpful Always treated with respect Doesn't take much time AARP 45 -64 (n = 1, 054) 65+ (n = 485) No hidden costs Can get cash instantly Offers products and services I need 100
Reasons for satisfaction with financial transactions by Race and Ethnicity (Age 45 -64) 50% 40% 31% 30% 28% 29% 19% 20% 10% 32% 20% 27% 24% 14%14% 13% 10% 12% 14% 21%22% 16% 5% 0. 4% 0% Hispanic (n = 193) Fees are affordable Staff always helpful Always treated with respect Doesn't take much time AARP Black (n = 177) White (n = 536) No hidden costs Can get cash instantly Offers products and services I need 101
Reasons for satisfaction with financial transactions by Race and Ethnicity (Age 65+) 50% 40% 38% 40% 30% 29% 28% 26% 25% 24% 20% 18% 20% 10% 38% 8% 4% 15% 12% 11% 19% 13% 15% 6% 0% Hispanic (n = 56) Fees are affordable Staff always helpful Always treated with respect Doesn't take much time AARP Black (n = 89) White (n = 351) No hidden costs Can get cash instantly Offers products and services I need 102
Underbanked and unbanked borrowing AARP 103
Underbanked and unbanked borrowing: q Hispanic persons the most likely to borrow q Most borrowed one time q But 47 percent of age 65+ individuals with incomes under $10, 000 had borrowed more than 9 times q Half of Black and Hispanic persons who borrowed had borrowed more than 9 times q Most borrowed under $1, 000 although significant variations in amount based on age, income and employment status AARP 104
Underbanked and unbanked borrowing *It is unclear whether individuals selecting “Personal Loan” meant an unsecured loan from a bank or a loan from a person, for example a friend or relative. AARP 105
Individuals over age 45 preferred to borrow from banks and credit unions 100% 90% 80% 70% 60% 50% 40% 30% 20% 10% 0% 17% 18% 2% 1% 36% 2% 17% 22% 2% 2% 4% 2% 1% 26% 12% 43% 55% 9% 34% 18+ (n = 2, 799) 42% 8% 2% 24% 21% 18 to 44 (n = 1, 260) 45 to 64 (n = 1, 054) 65+ (n = 485) Other Payday lender Cash advance on credit card Bank/ credit union Friend Family/ relative AARP 106
Hispanics and blacks preferred to borrow first from family (Age 45 -64*) 100% 21% 80% 60% 40% 20% 14% 4% 31% 3% 5% 4% 32% 5% 37% 24% 9% 30% 2% 47% 9% 23% 0% Hispanic (n = 194) Black (n = 177) White (n = 536) 45 -64 Other Bank/ credit union Payday lender Friend Cash advance on credit card Family/ relative *Differences among age 65+ persons were not found to be statistically significant so this group is not shown. AARP 107
Why do we care? q If most unbanked and underbanked consumers are satisfied, why do we care? q Alternatives do not offer a pathway to savings o Rainy day or retirement q Alternatives do not facilitate borrowing on reasonable terms o Opens channels to payday and auto-title lenders o No banking relationships or credit history AARP 108
Issues for banks and credit unions q Need products that keep costs low and provide valued services o FDIC proposal for electronic basic accounts q Must understand how to deliver these services - variance by race and ethnicity q Should be embedded in bank/credit union business strategy q Failure will cede a growing share of the market to prepaid cards pushed by retailers and generally unregulated AARP 109
Lunch
Issues Update Ellen Lazar, Senior Advisor to the Chairman for Consumer Policy Michael H. Krimminger, Deputy to the Chairman George Alexander, Assistant Director, Structured Transactions James Watkins, Deputy Director, Supervisory Examinations, Division of Supervision and Consumer Protection Roberta K. Mc. Inerney, Deputy General Counsel
Status Report on Mortgage Work Stream and Other Strategic Plan Projects Barbara A. Ryan Michael Briggs, Supervisory Counsel Karyen Chu, Chief, Consumer Finance Research Section Ellen Lazar Luke Brown, Associate Director, Compliance Policy Branch, Division of Supervision and Consumer Protection Roberta Mc. Inerney Rae-Ann Miller, Special Advisor to the Director, Division of Insurance and Research Luke Reynolds, Chief, Outreach and Program Development Section, Division of Supervision and Consumer Protection
Report of Strategic Planning Subcommittee Mortgages Work Group FDIC Advisory Committee on Economic Inclusion November 16, 2010
Agenda • Mortgage work group update. • Recent legislative and regulatory developments affecting mortgages. • Trends in mortgage origination features and low- and moderate income (LMI) homeownership status. • Implications and next steps.
Mortgage work group update • Established Spring 2010. • Work group goals. – Document impact of Dodd-Frank Reform Act and state of LMI homeownership. – Think about potential “best practices” for LMI mortgage lending. • Progress to date.
Legislative and regulatory developments affecting mortgages • Dodd-Frank Wall Street Reform and Consumer Protection Act: – Title XIV (Mortgage Reform & Anti-Predatory Lending). – Title IX (Investor Protection). • Recent FRB and HUD proposed rules and regulations.
Dodd-Frank Title XIV • New consumer protections. • Incentives and compensation rules. • Ability to repay and the qualified mortgage standard.
Dodd Frank Title XIV: New Consumer Protections • • Improved adjustable rate reset notice. Broader HOEPA coverage. Escrows required for certain mortgages. Prepayment penalties prohibited. Duty of care requirements. New appraisal requirements. Improved mortgage loan disclosures to be required by CFPB.
Dodd Frank Title XIV: Incentives/Compensation • Prohibits yield spread premiums (YSPs). • Generally prohibits mortgage loan originator (MLO) compensation that varies based on the loan terms. • Prohibits MLOs from receiving fees from both consumers and a third party.
Dodd Frank Title XIV: Ability to Repay Qualified Mortgage Standard • Requires: – Verified and documented income and finances. – Full amortization. – Compliance with FRB guidance or regulations on debtto-income ratios. • Prohibits: – Negative amortization. – Deferral of repayment of principal. – Balloon payments. – Loan terms exceeding 30 years. – Points and fees exceeding 3 percent of the total loan amount.
Dodd Frank Title IX: Qualified Residential Mortgage Risk retention requirements under Dodd Frank. Safe harbor for “qualified residential mortgages”. Agencies must jointly issue regulations defining a “qualified residential mortgage” within 270 days of enactment.
Recent FRB Rulemakings • Proposed TILA Rules: – Reverse mortgages. – Right to rescind. – Loan modifications. • Rules on YSPs/MLO compensation (effective 04 -01 -2011) prohibit: – YSPs. – Double-dipping of fees. – Steering practices.
Recent HUD Rulemakings • Introduced credit score threshold for FHAinsured loans. • Reduced Loan-to-Value maximums for borrowers with credit scores under 580.
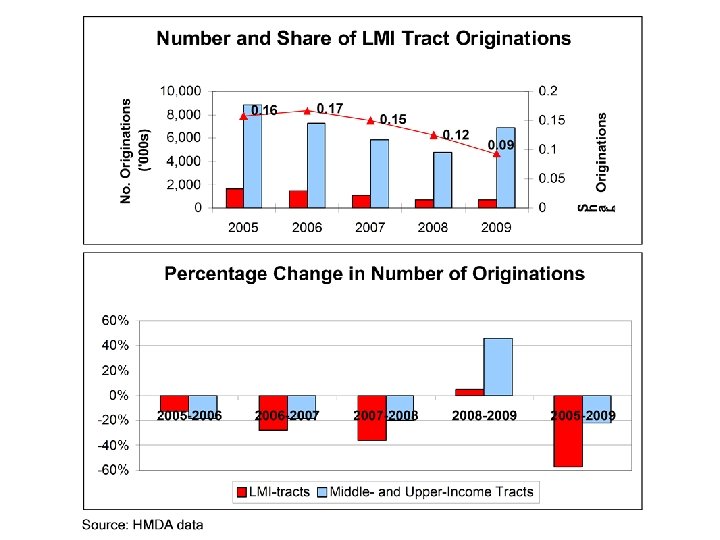
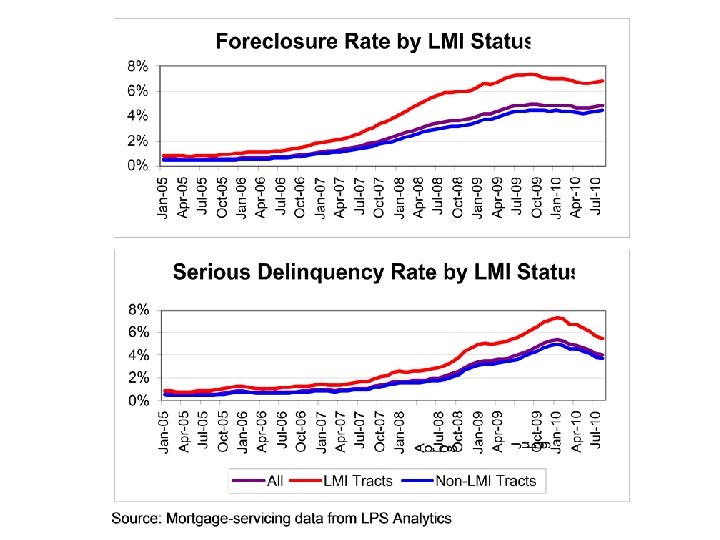
What Do the Data Show? • Analyses of: – Mortgage features and performance using mortgage servicing data from LPS Analytics (formerly Mc. Dash). – Originations using Home Mortgage Disclosure Act (HMDA) data. – Home ownership levels using Census Bureau’s Quarterly Vacancy Survey. • Some of the mortgage features addressed by Dodd-Frank are not currently being offered. • Share of originations in LMI-tracts dropped dramatically between 2005 and 2009.
Share of Loans that are Hybrid ARMs With Initial Rate Period of 1, 2, or 3 Years
Share of Loans with Prepayment Penalty
Share of Loans That Allow Negative Amortization Payments
Share of Loans That Allow Interest-Only Payments
Share of FHA Loans Source: HMDA data
• Percentage Change in Homeownership Rate Since Peak – – Non-Hispanic White: Black Only: Hispanic (Any Race): Other Races: - 1. 6% since 2004 - 5. 9% since 2004 - 2. 5% since 2007 - 3. 5% since 2006
Implications • Legislative and regulatory developments. • Trends in homeownership and mortgage features. • Safe mortgages vs. access. • Next steps.
Discussion
Conclusion Diana Taylor Sheila C. Bair Ellen Lazar