Advances and Controversies in Cardiovascular Risk Prediction Promises
![Advances and Controversies in Cardiovascular Risk Prediction Promises, Pitfalls and Progress Peter Brindle General Advances and Controversies in Cardiovascular Risk Prediction Promises, Pitfalls and Progress Peter Brindle General](https://slidetodoc.com/presentation_image/38a1ca14f78c07d41b2369ff437f4b43/image-1.jpg)
![Outline • Promises – Why do CVD risk estimation? – Background – Framingham • Outline • Promises – Why do CVD risk estimation? – Background – Framingham •](https://slidetodoc.com/presentation_image/38a1ca14f78c07d41b2369ff437f4b43/image-2.jpg)
![PROMISES PROMISES](https://slidetodoc.com/presentation_image/38a1ca14f78c07d41b2369ff437f4b43/image-3.jpg)
![Why do CVD risk estimation? • To identify high risk individuals • Prioritise treatment Why do CVD risk estimation? • To identify high risk individuals • Prioritise treatment](https://slidetodoc.com/presentation_image/38a1ca14f78c07d41b2369ff437f4b43/image-4.jpg)
![Background • Guidelines recommend preventive treatment in high risk patients • Population screening • Background • Guidelines recommend preventive treatment in high risk patients • Population screening •](https://slidetodoc.com/presentation_image/38a1ca14f78c07d41b2369ff437f4b43/image-5.jpg)
![The Framingham Heart Study • Data collection started in 1948 • Bi-annual follow up The Framingham Heart Study • Data collection started in 1948 • Bi-annual follow up](https://slidetodoc.com/presentation_image/38a1ca14f78c07d41b2369ff437f4b43/image-6.jpg)
![Framingham - Anderson • Data collected 1968 -75 • 5573 men and women followed Framingham - Anderson • Data collected 1968 -75 • 5573 men and women followed](https://slidetodoc.com/presentation_image/38a1ca14f78c07d41b2369ff437f4b43/image-7.jpg)
![Risk factors used to calculate the Anderson Framingham risk score -age and sex -diastolic Risk factors used to calculate the Anderson Framingham risk score -age and sex -diastolic](https://slidetodoc.com/presentation_image/38a1ca14f78c07d41b2369ff437f4b43/image-8.jpg)
![Different versions and coloured charts New Zealand cardiovascular risk prediction charts Different versions and coloured charts New Zealand cardiovascular risk prediction charts](https://slidetodoc.com/presentation_image/38a1ca14f78c07d41b2369ff437f4b43/image-9.jpg)
![Sheffield Tables Sheffield Tables](https://slidetodoc.com/presentation_image/38a1ca14f78c07d41b2369ff437f4b43/image-10.jpg)
![Joint British Societies 1998 Joint British Societies 1998](https://slidetodoc.com/presentation_image/38a1ca14f78c07d41b2369ff437f4b43/image-11.jpg)
![Joint British Societies(2) 2004 Joint British Societies(2) 2004](https://slidetodoc.com/presentation_image/38a1ca14f78c07d41b2369ff437f4b43/image-12.jpg)
![PITFALLS PITFALLS](https://slidetodoc.com/presentation_image/38a1ca14f78c07d41b2369ff437f4b43/image-13.jpg)
![Getting it wrong Over-prediction means. . . People with little to gain may become Getting it wrong Over-prediction means. . . People with little to gain may become](https://slidetodoc.com/presentation_image/38a1ca14f78c07d41b2369ff437f4b43/image-14.jpg)
![How well does Framingham perform? • Single UK population • One systematic review How well does Framingham perform? • Single UK population • One systematic review](https://slidetodoc.com/presentation_image/38a1ca14f78c07d41b2369ff437f4b43/image-15.jpg)
![Framingham in the Renfrew/Paisley study § 12, 300 men and women, aged 45 -64 Framingham in the Renfrew/Paisley study § 12, 300 men and women, aged 45 -64](https://slidetodoc.com/presentation_image/38a1ca14f78c07d41b2369ff437f4b43/image-16.jpg)
![Social deprivation 10 -year predicted versus observed CVD death rates by area deprivation and Social deprivation 10 -year predicted versus observed CVD death rates by area deprivation and](https://slidetodoc.com/presentation_image/38a1ca14f78c07d41b2369ff437f4b43/image-17.jpg)
![Predicted over observed ratios ordered by background risk of test population Predicted over observed ratios ordered by background risk of test population](https://slidetodoc.com/presentation_image/38a1ca14f78c07d41b2369ff437f4b43/image-18.jpg)
![Issues with Framingham • • BP treatment Family History Deprivation Ethnicity Generalisability Statistical validity Issues with Framingham • • BP treatment Family History Deprivation Ethnicity Generalisability Statistical validity](https://slidetodoc.com/presentation_image/38a1ca14f78c07d41b2369ff437f4b43/image-19.jpg)
![PROGRESS PROGRESS](https://slidetodoc.com/presentation_image/38a1ca14f78c07d41b2369ff437f4b43/image-20.jpg)
![SCORE Systematic Coronary Risk Evaluation 2003 • 205, 178 men and women from 12 SCORE Systematic Coronary Risk Evaluation 2003 • 205, 178 men and women from 12](https://slidetodoc.com/presentation_image/38a1ca14f78c07d41b2369ff437f4b43/image-21.jpg)
![](https://slidetodoc.com/presentation_image/38a1ca14f78c07d41b2369ff437f4b43/image-22.jpg)
![SCORE – better than Framingham? SCORE BP treatment Family History Deprivation Ethnicity Generalisability Statistical SCORE – better than Framingham? SCORE BP treatment Family History Deprivation Ethnicity Generalisability Statistical](https://slidetodoc.com/presentation_image/38a1ca14f78c07d41b2369ff437f4b43/image-23.jpg)
![ASSIGN - ASSessing cardiovascular risk, using SIGN guidelines • Scottish Heart and Health Extended ASSIGN - ASSessing cardiovascular risk, using SIGN guidelines • Scottish Heart and Health Extended](https://slidetodoc.com/presentation_image/38a1ca14f78c07d41b2369ff437f4b43/image-24.jpg)
![ASSIGN – better than Framingham? SCORE ASSIGN BP treatment No No Family History No ASSIGN – better than Framingham? SCORE ASSIGN BP treatment No No Family History No](https://slidetodoc.com/presentation_image/38a1ca14f78c07d41b2369ff437f4b43/image-25.jpg)
![QRISK 1 and QRISK 2 • Electronic patient record • Cohort analysis based on QRISK 1 and QRISK 2 • Electronic patient record • Cohort analysis based on](https://slidetodoc.com/presentation_image/38a1ca14f78c07d41b2369ff437f4b43/image-26.jpg)
![QRISK 1 - better than Framingham? BP treatment Family History Deprivation Ethnicity Generalisability Statistical QRISK 1 - better than Framingham? BP treatment Family History Deprivation Ethnicity Generalisability Statistical](https://slidetodoc.com/presentation_image/38a1ca14f78c07d41b2369ff437f4b43/image-27.jpg)
![QRISK 2 • • • Included ONS deaths linkage Included additional variables 2. 3 QRISK 2 • • • Included ONS deaths linkage Included additional variables 2. 3](https://slidetodoc.com/presentation_image/38a1ca14f78c07d41b2369ff437f4b43/image-28.jpg)
![Model performance QRISK 2 vs Modified Framingham QRISK 2 Framingham R squared 43. 4% Model performance QRISK 2 vs Modified Framingham QRISK 2 Framingham R squared 43. 4%](https://slidetodoc.com/presentation_image/38a1ca14f78c07d41b2369ff437f4b43/image-29.jpg)
![Age-standardised incidence of CVD by deprivation Age-standardised incidence of CVD by deprivation](https://slidetodoc.com/presentation_image/38a1ca14f78c07d41b2369ff437f4b43/image-30.jpg)
![Adjusted Hazard Ratios for CVD Adjusted Hazard Ratios for CVD](https://slidetodoc.com/presentation_image/38a1ca14f78c07d41b2369ff437f4b43/image-31.jpg)
![QRISK 2 – better than Framingham? BP treatment Family History Deprivation Ethnicity Reproducibility Generalisability QRISK 2 – better than Framingham? BP treatment Family History Deprivation Ethnicity Reproducibility Generalisability](https://slidetodoc.com/presentation_image/38a1ca14f78c07d41b2369ff437f4b43/image-32.jpg)
![Where to next? • Generalisability? • Linkage – Census – Hospital data • Improved Where to next? • Generalisability? • Linkage – Census – Hospital data • Improved](https://slidetodoc.com/presentation_image/38a1ca14f78c07d41b2369ff437f4b43/image-33.jpg)
![Summary • Promises – Why do CVD risk estimation? – Background – Framingham • Summary • Promises – Why do CVD risk estimation? – Background – Framingham •](https://slidetodoc.com/presentation_image/38a1ca14f78c07d41b2369ff437f4b43/image-34.jpg)
![CONCLUSION • The idea of risk assessment is well established • Existing methods flawed CONCLUSION • The idea of risk assessment is well established • Existing methods flawed](https://slidetodoc.com/presentation_image/38a1ca14f78c07d41b2369ff437f4b43/image-35.jpg)
![Acknowledgements • British Regional Heart study team • Renfrew/Paisley study team • Shah Ebrahim Acknowledgements • British Regional Heart study team • Renfrew/Paisley study team • Shah Ebrahim](https://slidetodoc.com/presentation_image/38a1ca14f78c07d41b2369ff437f4b43/image-36.jpg)
![CONCLUSION • The idea of risk assessment is well established • Existing methods flawed CONCLUSION • The idea of risk assessment is well established • Existing methods flawed](https://slidetodoc.com/presentation_image/38a1ca14f78c07d41b2369ff437f4b43/image-37.jpg)
- Slides: 37
![Advances and Controversies in Cardiovascular Risk Prediction Promises Pitfalls and Progress Peter Brindle General Advances and Controversies in Cardiovascular Risk Prediction Promises, Pitfalls and Progress Peter Brindle General](https://slidetodoc.com/presentation_image/38a1ca14f78c07d41b2369ff437f4b43/image-1.jpg)
Advances and Controversies in Cardiovascular Risk Prediction Promises, Pitfalls and Progress Peter Brindle General Practitioner R&D lead Bristol, N. Somerset and S. Glouc PCTs
![Outline Promises Why do CVD risk estimation Background Framingham Outline • Promises – Why do CVD risk estimation? – Background – Framingham •](https://slidetodoc.com/presentation_image/38a1ca14f78c07d41b2369ff437f4b43/image-2.jpg)
Outline • Promises – Why do CVD risk estimation? – Background – Framingham • Pitfalls – How well to current methods perform? – Two studies • Progress – Four new risk scores – Where to next?
![PROMISES PROMISES](https://slidetodoc.com/presentation_image/38a1ca14f78c07d41b2369ff437f4b43/image-3.jpg)
PROMISES
![Why do CVD risk estimation To identify high risk individuals Prioritise treatment Why do CVD risk estimation? • To identify high risk individuals • Prioritise treatment](https://slidetodoc.com/presentation_image/38a1ca14f78c07d41b2369ff437f4b43/image-4.jpg)
Why do CVD risk estimation? • To identify high risk individuals • Prioritise treatment - for individuals - for policy • Patient education
![Background Guidelines recommend preventive treatment in high risk patients Population screening Background • Guidelines recommend preventive treatment in high risk patients • Population screening •](https://slidetodoc.com/presentation_image/38a1ca14f78c07d41b2369ff437f4b43/image-5.jpg)
Background • Guidelines recommend preventive treatment in high risk patients • Population screening • Lifelong treatment. Or not.
![The Framingham Heart Study Data collection started in 1948 Biannual follow up The Framingham Heart Study • Data collection started in 1948 • Bi-annual follow up](https://slidetodoc.com/presentation_image/38a1ca14f78c07d41b2369ff437f4b43/image-6.jpg)
The Framingham Heart Study • Data collection started in 1948 • Bi-annual follow up • First CVD risk equation: Truett et al. 1967 • > 20 groups of regression equations between 1967 and 2008 • Modified Anderson et al 1991 used in UK
![Framingham Anderson Data collected 1968 75 5573 men and women followed Framingham - Anderson • Data collected 1968 -75 • 5573 men and women followed](https://slidetodoc.com/presentation_image/38a1ca14f78c07d41b2369ff437f4b43/image-7.jpg)
Framingham - Anderson • Data collected 1968 -75 • 5573 men and women followed up for 12 years • Six regression equations published in 1991
![Risk factors used to calculate the Anderson Framingham risk score age and sex diastolic Risk factors used to calculate the Anderson Framingham risk score -age and sex -diastolic](https://slidetodoc.com/presentation_image/38a1ca14f78c07d41b2369ff437f4b43/image-8.jpg)
Risk factors used to calculate the Anderson Framingham risk score -age and sex -diastolic and systolic BP -total: HDL cholesterol ratio -diabetes (Y/N) -cigarette smoking (Y/N) -LVH (Y/N) Absolute CVD Risk over 10 years
![Different versions and coloured charts New Zealand cardiovascular risk prediction charts Different versions and coloured charts New Zealand cardiovascular risk prediction charts](https://slidetodoc.com/presentation_image/38a1ca14f78c07d41b2369ff437f4b43/image-9.jpg)
Different versions and coloured charts New Zealand cardiovascular risk prediction charts
![Sheffield Tables Sheffield Tables](https://slidetodoc.com/presentation_image/38a1ca14f78c07d41b2369ff437f4b43/image-10.jpg)
Sheffield Tables
![Joint British Societies 1998 Joint British Societies 1998](https://slidetodoc.com/presentation_image/38a1ca14f78c07d41b2369ff437f4b43/image-11.jpg)
Joint British Societies 1998
![Joint British Societies2 2004 Joint British Societies(2) 2004](https://slidetodoc.com/presentation_image/38a1ca14f78c07d41b2369ff437f4b43/image-12.jpg)
Joint British Societies(2) 2004
![PITFALLS PITFALLS](https://slidetodoc.com/presentation_image/38a1ca14f78c07d41b2369ff437f4b43/image-13.jpg)
PITFALLS
![Getting it wrong Overprediction means People with little to gain may become Getting it wrong Over-prediction means. . . People with little to gain may become](https://slidetodoc.com/presentation_image/38a1ca14f78c07d41b2369ff437f4b43/image-14.jpg)
Getting it wrong Over-prediction means. . . People with little to gain may become patients, and the benefit to risk ratio of treatment becomes too small Under-prediction means… People with much to gain may not be offered preventive treatment
![How well does Framingham perform Single UK population One systematic review How well does Framingham perform? • Single UK population • One systematic review](https://slidetodoc.com/presentation_image/38a1ca14f78c07d41b2369ff437f4b43/image-15.jpg)
How well does Framingham perform? • Single UK population • One systematic review
![Framingham in the RenfrewPaisley study 12 300 men and women aged 45 64 Framingham in the Renfrew/Paisley study § 12, 300 men and women, aged 45 -64](https://slidetodoc.com/presentation_image/38a1ca14f78c07d41b2369ff437f4b43/image-16.jpg)
Framingham in the Renfrew/Paisley study § 12, 300 men and women, aged 45 -64 and no evidence of cardiovascular disease at entry (1972 -76) § 10 -year follow up for cardiovascular disease mortality § Stratified by individual social class and area deprivation
![Social deprivation 10 year predicted versus observed CVD death rates by area deprivation and Social deprivation 10 -year predicted versus observed CVD death rates by area deprivation and](https://slidetodoc.com/presentation_image/38a1ca14f78c07d41b2369ff437f4b43/image-17.jpg)
Social deprivation 10 -year predicted versus observed CVD death rates by area deprivation and social class Social class Deprivation (Pred/Obs) Non-Manual 0. 69 Manual 0. 52 p= 0. 0005 Affluent 0. 64 Intermediate 0. 56 Deprived 0. 47 p= 0. 0017 for trend The Framingham risk score does not reflect the increased risk of people from deprived backgrounds relative to affluent people
![Predicted over observed ratios ordered by background risk of test population Predicted over observed ratios ordered by background risk of test population](https://slidetodoc.com/presentation_image/38a1ca14f78c07d41b2369ff437f4b43/image-18.jpg)
Predicted over observed ratios ordered by background risk of test population
![Issues with Framingham BP treatment Family History Deprivation Ethnicity Generalisability Statistical validity Issues with Framingham • • BP treatment Family History Deprivation Ethnicity Generalisability Statistical validity](https://slidetodoc.com/presentation_image/38a1ca14f78c07d41b2369ff437f4b43/image-19.jpg)
Issues with Framingham • • BP treatment Family History Deprivation Ethnicity Generalisability Statistical validity Face validity Improvements are needed
![PROGRESS PROGRESS](https://slidetodoc.com/presentation_image/38a1ca14f78c07d41b2369ff437f4b43/image-20.jpg)
PROGRESS
![SCORE Systematic Coronary Risk Evaluation 2003 205 178 men and women from 12 SCORE Systematic Coronary Risk Evaluation 2003 • 205, 178 men and women from 12](https://slidetodoc.com/presentation_image/38a1ca14f78c07d41b2369ff437f4b43/image-21.jpg)
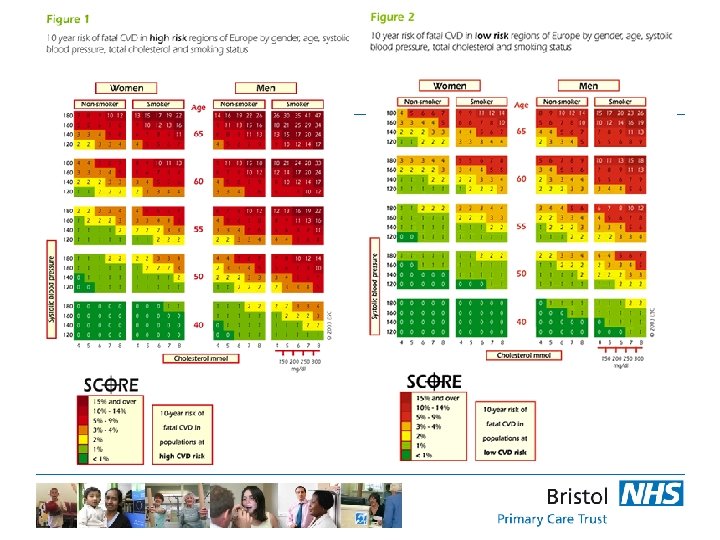
SCORE Systematic Coronary Risk Evaluation 2003 • 205, 178 men and women from 12 European cohort studies • Used by “European guidelines on cardiovascular disease prevention in clinical practice”
![](https://slidetodoc.com/presentation_image/38a1ca14f78c07d41b2369ff437f4b43/image-22.jpg)
![SCORE better than Framingham SCORE BP treatment Family History Deprivation Ethnicity Generalisability Statistical SCORE – better than Framingham? SCORE BP treatment Family History Deprivation Ethnicity Generalisability Statistical](https://slidetodoc.com/presentation_image/38a1ca14f78c07d41b2369ff437f4b43/image-23.jpg)
SCORE – better than Framingham? SCORE BP treatment Family History Deprivation Ethnicity Generalisability Statistical validity Face validity No No ? Yes No
![ASSIGN ASSessing cardiovascular risk using SIGN guidelines Scottish Heart and Health Extended ASSIGN - ASSessing cardiovascular risk, using SIGN guidelines • Scottish Heart and Health Extended](https://slidetodoc.com/presentation_image/38a1ca14f78c07d41b2369ff437f4b43/image-24.jpg)
ASSIGN - ASSessing cardiovascular risk, using SIGN guidelines • Scottish Heart and Health Extended Cohort (SHHEC) • 6540 men, 6757 women • Classic risk factors plus – Deprivation – Family history • Shifts treatment towards the socially deprived compared to Framingham
![ASSIGN better than Framingham SCORE ASSIGN BP treatment No No Family History No ASSIGN – better than Framingham? SCORE ASSIGN BP treatment No No Family History No](https://slidetodoc.com/presentation_image/38a1ca14f78c07d41b2369ff437f4b43/image-25.jpg)
ASSIGN – better than Framingham? SCORE ASSIGN BP treatment No No Family History No No Yes No ? Yes No Deprivation Ethnicity Generalisability Statistical validity Face validity
![QRISK 1 and QRISK 2 Electronic patient record Cohort analysis based on QRISK 1 and QRISK 2 • Electronic patient record • Cohort analysis based on](https://slidetodoc.com/presentation_image/38a1ca14f78c07d41b2369ff437f4b43/image-26.jpg)
QRISK 1 and QRISK 2 • Electronic patient record • Cohort analysis based on large validated GP database (QResearch) • Contains individual patient level data • 15 year study period 1993 to 2008 • First diagnosis of CVD (including CVD death) • QRISK 1 – – § Deprivation Family History BMI On BP treatment NO Ethnicity
![QRISK 1 better than Framingham BP treatment Family History Deprivation Ethnicity Generalisability Statistical QRISK 1 - better than Framingham? BP treatment Family History Deprivation Ethnicity Generalisability Statistical](https://slidetodoc.com/presentation_image/38a1ca14f78c07d41b2369ff437f4b43/image-27.jpg)
QRISK 1 - better than Framingham? BP treatment Family History Deprivation Ethnicity Generalisability Statistical validity Face validity SCORE ASSIGN QRISK 1 No No ? Yes No No Yes No ? Yes No Yes Yes Yes
![QRISK 2 Included ONS deaths linkage Included additional variables 2 3 QRISK 2 • • • Included ONS deaths linkage Included additional variables 2. 3](https://slidetodoc.com/presentation_image/38a1ca14f78c07d41b2369ff437f4b43/image-28.jpg)
QRISK 2 • • • Included ONS deaths linkage Included additional variables 2. 3 million people (>16 million person yrs) Self-assigned ethnicity Derivation (1. 5 million) and test cohorts
![Model performance QRISK 2 vs Modified Framingham QRISK 2 Framingham R squared 43 4 Model performance QRISK 2 vs Modified Framingham QRISK 2 Framingham R squared 43. 4%](https://slidetodoc.com/presentation_image/38a1ca14f78c07d41b2369ff437f4b43/image-29.jpg)
Model performance QRISK 2 vs Modified Framingham QRISK 2 Framingham R squared 43. 4% 38. 9% D statistic 1. 793 1. 632 R squared 38. 4% 34. 8% D statistic 1. 616 1. 495 Females Males
![Agestandardised incidence of CVD by deprivation Age-standardised incidence of CVD by deprivation](https://slidetodoc.com/presentation_image/38a1ca14f78c07d41b2369ff437f4b43/image-30.jpg)
Age-standardised incidence of CVD by deprivation
![Adjusted Hazard Ratios for CVD Adjusted Hazard Ratios for CVD](https://slidetodoc.com/presentation_image/38a1ca14f78c07d41b2369ff437f4b43/image-31.jpg)
Adjusted Hazard Ratios for CVD
![QRISK 2 better than Framingham BP treatment Family History Deprivation Ethnicity Reproducibility Generalisability QRISK 2 – better than Framingham? BP treatment Family History Deprivation Ethnicity Reproducibility Generalisability](https://slidetodoc.com/presentation_image/38a1ca14f78c07d41b2369ff437f4b43/image-32.jpg)
QRISK 2 – better than Framingham? BP treatment Family History Deprivation Ethnicity Reproducibility Generalisability Statistical validity Face validity SCORE ASSIGN QRISK 1 QRISK 2 No No Yes ? Yes No No Yes ? Yes No Yes Yes Yes Yes
![Where to next Generalisability Linkage Census Hospital data Improved Where to next? • Generalisability? • Linkage – Census – Hospital data • Improved](https://slidetodoc.com/presentation_image/38a1ca14f78c07d41b2369ff437f4b43/image-33.jpg)
Where to next? • Generalisability? • Linkage – Census – Hospital data • Improved ethnicity recording
![Summary Promises Why do CVD risk estimation Background Framingham Summary • Promises – Why do CVD risk estimation? – Background – Framingham •](https://slidetodoc.com/presentation_image/38a1ca14f78c07d41b2369ff437f4b43/image-34.jpg)
Summary • Promises – Why do CVD risk estimation? – Background – Framingham • Pitfalls – How well to current methods perform? – Two studies • Progress – Four new risk scores – Where to next? – linkage and statistics
![CONCLUSION The idea of risk assessment is well established Existing methods flawed CONCLUSION • The idea of risk assessment is well established • Existing methods flawed](https://slidetodoc.com/presentation_image/38a1ca14f78c07d41b2369ff437f4b43/image-35.jpg)
CONCLUSION • The idea of risk assessment is well established • Existing methods flawed – but better than nothing • Electronic patient record + improving data sources = exciting prospects
![Acknowledgements British Regional Heart study team RenfrewPaisley study team Shah Ebrahim Acknowledgements • British Regional Heart study team • Renfrew/Paisley study team • Shah Ebrahim](https://slidetodoc.com/presentation_image/38a1ca14f78c07d41b2369ff437f4b43/image-36.jpg)
Acknowledgements • British Regional Heart study team • Renfrew/Paisley study team • Shah Ebrahim • Tom Fahey • Andy Beswick • Julia Hippisley-Cox • John Robson • Carol Coupland • Yana Vinogradova • Aziz Sheikh • Rubin Minhas
![CONCLUSION The idea of risk assessment is well established Existing methods flawed CONCLUSION • The idea of risk assessment is well established • Existing methods flawed](https://slidetodoc.com/presentation_image/38a1ca14f78c07d41b2369ff437f4b43/image-37.jpg)
CONCLUSION • The idea of risk assessment is well established • Existing methods flawed – but better than nothing • Electronic patient record + improving data sources = exciting prospects
Cardiovascular disease risk factor
Liquidity measures
Sports in society issues and controversies
Controversies in sport
It is current controversies in clinical psychologist
Activist trade policy
Controversies in nursing
Sports controversies
Loans and advances in tally
What is long term loans and advances
Global oncology trends 2017 advances complexity and cost
Axis powers
Advances in technology during wwii
Chapter 9 intellectual development of infants
Advances in real time rendering
Advances in mri
Opto-electronic advances
Recent advances in dental ceramics
Asset classification norms
Advances in memory technology
Frontiern
Baptismal promises
Solemn promises
Promises of distributed database system
Managing service promises
Old testament promises
Managing service promises
Desired and adequate service
Believing in god's promises
Faraj promises
Manifesto for head girl
Security promises of the jvm
Note receivable
Are god's promises conditional
Promises of ddbms
Nothing formed against me shall stand song
God's covenant