Accidental Dwelling Fires Evaluated University of Essex Impac


 70 60 50 40")
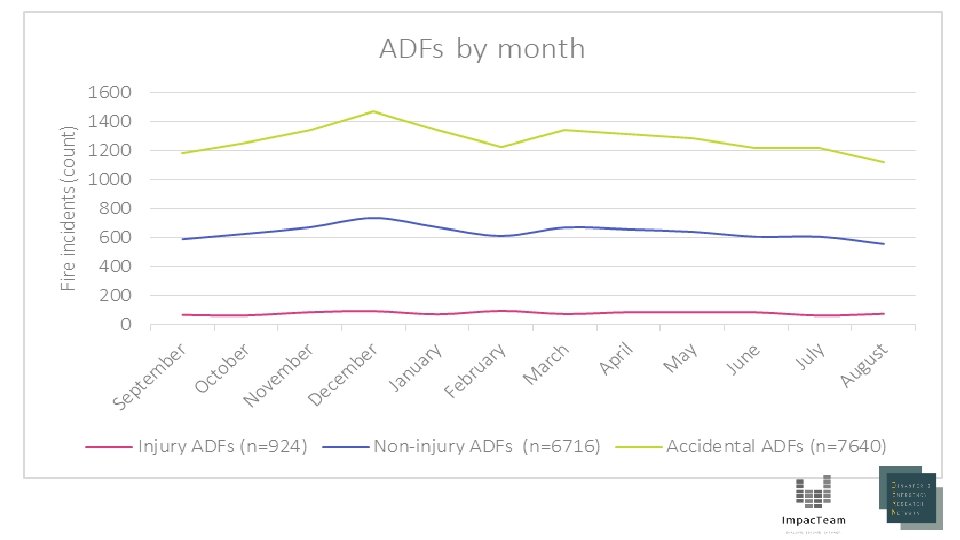
 1400 1200 Fire incidents (count) 1000")
 120 100")
 80 70 Fire incidents (count) 60")
 45% 40% 35% % of total n 30%")
 100% 90% 80% 70% % of total")
 Non-injury ADFs (n= 5765) 5 (6 8 (1 (1 0 al")
 60% 50% % of total n 40% 30%")
 70% 60% % of")
 1200 800 600 400 200")


")


 • Pilot project, Essex County Fire and")


- Slides: 43
Accidental Dwelling Fires: Evaluated University of Essex Impac. Team, presented by Catalyst Evaluating your impact in the community. Catalyst is funded by the Higher Education Funding Council for England. University of Essex working in partnership with:
Evaluations: Why Do We Need Them? 1. Lack of suitable baselines of programme success; 2. Insufficient data on input, unit input and performance; 3. Difficulties in demonstrating links between input, performance and improved frontline services; 4. Insufficient quality control prior to external reporting; 5. Lack of transparency over arms-length bodies’ reporting processes to trace progress. -----The UK National Audit Office (NAO)
Evaluations: Common Concerns • Evaluation will divert resources away from the programme. • Costs: • • Typically 10%-20% of overall programme budget Benefits • • • Streamline resources Focus on “what works” for programme participants Improve outcomes • Evaluation will be too complicated. • • Can be simple and straightforward. Must be appropriate to a programme's service model, objectives, and resources.
Evaluations: Common Concerns • Evaluation will be an additional burden on staff. • Can be incorporated into ongoing programme management activities. • Evaluation will produce negative results. • Finding out “what does not work” allows resources to be allocated toward “what does work. ” � • Evaluation is just another form of programme monitoring. • • programme monitoring assesses whether a programme is in compliance with specified performance standards (e. g. , number of participants served). Evaluation assesses whether expected outcomes were achieved.
Evaluation in the Public Sector 1. 2. 3. 4. 5. 6. 7. Find out ‘what works’ and ‘what does not work’. Showcase programme effectiveness to the community and funders. Inform decisions about programme refinements and resource allocation. Improve frontline practice with participants. Improve staff morale. Increase accountability and transparency. Increase a programme's capacity to conduct a critical self- assessment and plan for the future.
Cooperation: Key to evaluation success • Strong desire to assess programme impact. • Both the ECFRS and Uo. E want to know how to improve people’s lives. • Communication is open, honest, respectful and effective. • Regular exchange of ideas, concerns, and feedback on evaluation process and results. • Outstanding Problem-solving ability • Understanding of organisational needs, flexibility, adaptability.
Accidental Dwelling Fires •
Injury ADFs by month 100 90 80 Fire incidents (count) 70 60 50 40 30 20 10 0 September October November December January February March Injury ADFs (n=924) April May June July August
ADFs by day of the week (2009 -2017) 1400 1200 Fire incidents (count) 1000 800 600 400 200 0 Wednesday Thursday Friday Injury ADFs (n=924) Saturday Non-injury ADFs (n=6716) Sunday Accidental ADFs (total) Monday Tuesday
Injury ADFs by day of the week 160 140 Fire incidents (count) 120 100 80 60 40 20 0 Wednesday Thursday Friday Saturday Injury ADFs (n=924) Sunday Monday Tuesday
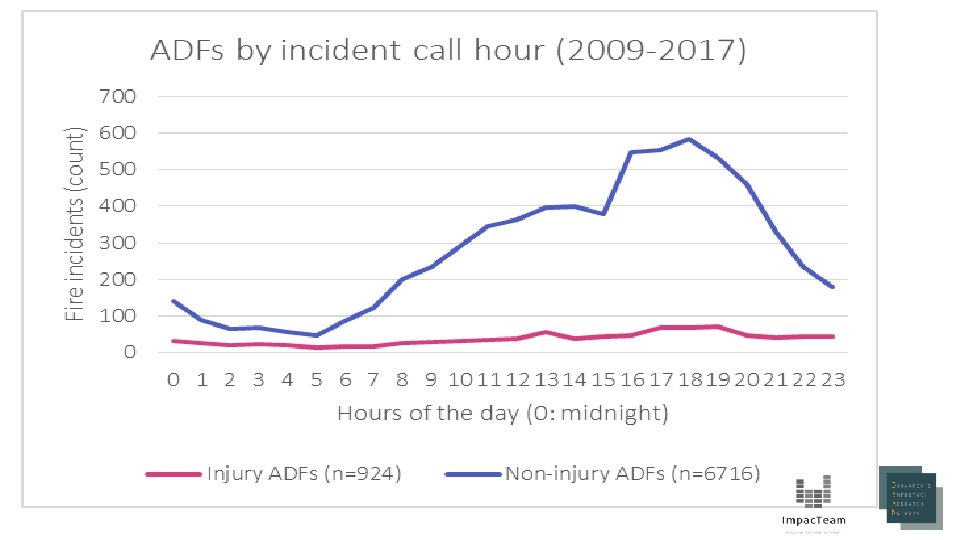
Injury ADFs by incident call hour (2009 -2017) 80 70 Fire incidents (count) 60 50 40 30 20 10 0 0 1 2 3 4 5 6 7 8 9 10 11 12 13 14 Hours of the day (0: midnight) Injury ADFs (n=924) 15 16 17 18 19 20 21 22 23
ADFs by hour of day (grouped) 45% 40% 35% % of total n 30% 25% 20% 15% 10% 5% 0% midnight - 6 AM - 12 PM Injury ADFs (n=924) 12 PM - 6 PM Non-injury ADFs (n=6716) 6 PM - midnight
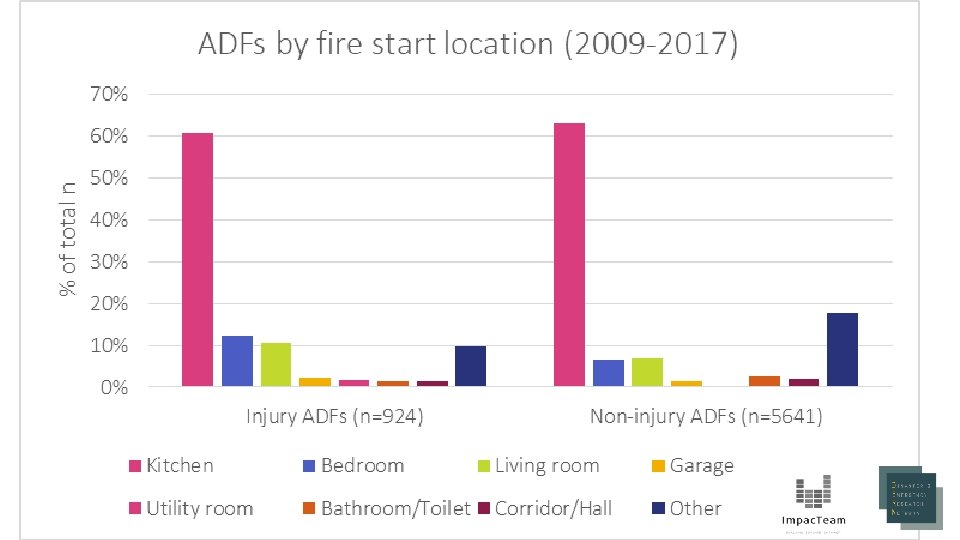
Kitchen ADFs - fire source (2009 -2017) 100% 90% 80% 70% % of total n 60% 50% 40% 30% 20% 10% 0% Cooking appliance Electric lighting/supply Fuel/Chemical Injury ADFs (n=554) Heating/flame Non-injury ADFs (n=3547) Other Domestic appliance
Injury ADFs (n=924) Non-injury ADFs (n= 5765) 5 (6 8 (1 (1 0 al im An e bl ica pp l r he Ot n no w No t. K n no w us ) pl 4) -6 ) 7) -9 -1 (0 no tk ta No ge , a rs on Pe rly de El ul t Ad ut h Yo ld Ch i % of total n Who caused ADFs? (2009 -2017) FINDINGS: cause 60% 50% 40% 30% 20% 10% 0%
Who caused Kitchen ADFs? (2009 -2017) 60% 50% % of total n 40% 30% 20% 10% 0% Child (0 - 9) Youth (10 - Adult (18 17) 64) Elderly (65 Person, age Not Known Not plus) not known applicable Injury ADFs (n=560) Non-injury ADFs (n= 3547) Other Animal
Common Causes of Kitchen ADFs ignited by Adults (2009 -2017) 70% 60% % of total n 50% 40% 30% 20% 10% 0% Cooking - other cooking Cooking - chip pan/deep fat fryer Combustible articles too close to heat source (or fire) Kitchen ADFs ignited by adults Total (n=4107) Fault in equipment or appliance
Presence of alarms in ADFs over years (2009/10 -2016/17) 1200 800 600 400 200 ADFs where an alarm was present total ADFs 2016 -2017 2015 -2016 2014 -2015 2013 -2014 2012 -2013 2011 -2012 2010 -2011 0 2009 -2010 count of ADF incidents 1000
FINDINGS: LOcal authority
FINDINGS: LOcal authority
ADFs by Family Composition 60% 50% 40% 30% 20% 10% 0% Essex Baseline, (mosaic) % Adults only, no children ADFs, % Adults and children ADFs, no casualties % Lone Adult and children Lone adult no children Injury ADFs, %
Distribution of ADFs: Tenure 450 400 350 300 Owned Rented Council / HA 250 200 150 100 50 0 ADFs Injury Kitchen
Distribution of ADFs: Household Income 350 300 250 200 ADFs Injury 150 Kitchen 100 50 0 <£ 15 k-£ 19 k £ 20 k-£ 29 k £ 30 k-£ 39 k £ 40 k-£ 49 k £ 50 k-£ 59 k £ 60 k-£ 69 k £ 70 k-£ 99 k £ 100 k-£ 149 k £ 150 k+
Group 1 Households on low incomes living in social housing (K 51, N 61, O 68, O 69) Group 2 Transient singles (G 33, I 43) 1. 281*** 1. 380*** Model 3 (smoking ADFs) 1. 332*** 1. 072*** 0. 908*** 1. 113** Group 3 Poorer older householders living in social housing (M) Group 4 Couples and young singles in modern starter homes (H 36, H 37) Group 5 Owner occupiers in older style housing (J 45, J 46) 0. 877** 0. 831** 0. 930** 0. 924* 0. 906** 1. 040*** 0. 827** 0. 608* 0. 985** Group 6 Wealthier older householders 1. 199*** living in more rural locations and on the edges of towns (A 01, A 02, B 05, D 13) Number of observations 668 Notes: ** p<0. 05; *** p<0. 01 1. 068** 1. 040** 521 168 ADFs occurring in Essex in 2016: Model 1 Model 2 (all ADFs) (kitchen ADFs)
Most and Least at-risk Groups 30% 25% 20% 15% 10% 5% 0% Social housing and benefits Transient Singles Essex Baseline, (mosaic) % Poorer Elderly in social housing ADFs, % Couples and young singles Injury ADFs, % Kitchen ADFs Owners in older-style households Wealthier older households, rural and town edges Smoking-related ADFs
Targeting at-risk Groups to Reduce ADFs
Targeting at-risk Groups to Reduce Injury ADFs
Targeting at-risk Groups to Reduce Kitchen ADFs
Targeting at-risk Groups to Reduce Smoking-Related ADFs
How each Group Prefers to Receive Information Chart Title Wealthier older households, rural and town edges Owners in older-style households Couples and young singles Poorer Elderly in social housing Transient Singles Social housing and benefits 0% Phone Magazine Face-to-face 100% National Paper 200% 300% Local Paper 400% Internet 500% SMS text 600% Interactive TV 700%
Example Programme Evaluation: Parish Safety Volunteers (PSV) • Pilot project, Essex County Fire and Rescue Services (ECFRS) & Essex Police (EP) • Offsetting budget restrictions & organizational change by enlisting volunteers to deliver high quality emergency prevention support. • Volunteers • Visited at-risk local homes and reviewed and informed households on fire and burglary safety • Empowered to refer to other services • Visit 240 homes in 10 months
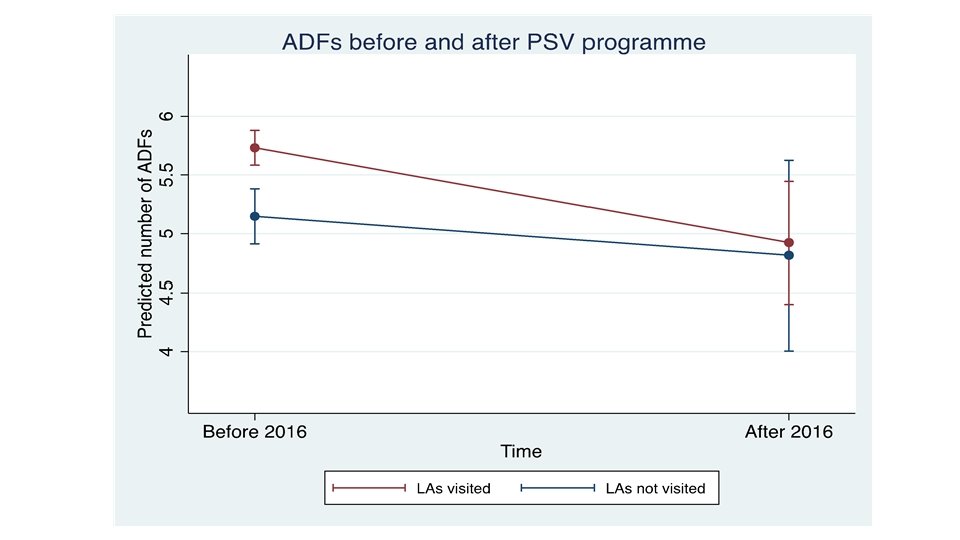
Analysis • Difference-in-difference regression analysis • 2 dimensions: time and treatment • 4 comparison groups: (treatment, time) treated untreated Before 2016 (1, 0) (0, 0) After 2016 (1, 1) (0, 1) • Estimation equation: yit=b 0+bixi+b 2 zt+b 3 xizt+ei
Results • Estimation results for ADF incidence. • Joint effects of treatment and time also given.
PSV: Cost-Benefit Analysis • Fires decreased in PSV-treated locations by. 81 per locality per month • From 5. 73 to 4. 92 • 4 fewer ADFs per 5 -month period • Cost of ADF: £ 51, 129 (Manchester New Economy Model) • Reduction in ADFs due to PSV: 51129*. 81*65 = £ 2691941. 85 • Total benefit: £ 2, 691, 941. 85 - £ 77, 544 = £ 2, 614, 397. 85
PSV: Cost-Benefit Analysis • Fires decreased in PSV-treated locations by. 81 per locality per month • From 5. 73 to 4. 92 • 4 fewer ADFs per 5 -month period • Cost of ADF: £ 51, 129 (Manchester New Economy Model) • Reduction in ADFs due to PSV: 51129*. 81*65 = £ 2691941. 85 • Total benefit: £ 2, 691, 941. 85 - £ 77, 544 = £ 2, 614, 397. 85
PSV: Cost-Benefit Analysis • Fires decreased in PSV-treated locations by. 81 per locality per month • From 5. 73 to 4. 92 • 4 fewer ADFs per 5 -month period • Cost of ADF: £ 51, 129 (Manchester New Economy Model) • Reduction in ADFs due to PSV: 51129*. 81*65 = £ 2, 691, 941. 85 • Total benefit: £ 2, 691, 941. 85 - £ 77, 544 = £ 2, 614, 397. 85
PSV: Cost-Benefit Analysis • Fires decreased in PSV-treated locations by. 81 per locality per month • From 5. 73 to 4. 92 • 4 fewer ADFs per 5 -month period • Cost of ADF: £ 51, 129 (Manchester New Economy Model) • Reduction in ADFs due to PSV: 51129*. 81*65 = £ 2, 691, 941. 85 • Total benefit: £ 2, 691, 941. 85 - £ 77, 544 = £ 2, 614, 397. 85
PSV: Cost-Benefit Analysis • Fires decreased in PSV-treated locations by. 81 per locality per month • From 5. 73 to 4. 92 • 4 fewer ADFs per 5 -month period • Cost of ADF: £ 51, 129 (Manchester New Economy Model) • Reduction in ADFs due to PSV: 51129*. 81*65 = £ 2, 691, 941. 85 • Total benefit: £ 2, 691, 941. 85 - £ 77, 544 = £ 2, 614, 397. 85
Thank you !!! Gina Yannitell Reinhardt, Ph. D: gina. reinhardt@essex. ac. uk • • • Kakia Chatsiou: achats@essex. ac. uk Ruth Weir: rweir@essex. ac. uk Jim Vine: jim. vine@essex. ac. uk Dragana Vidovic: dvidov@essex. ac. uk Jane Stanbury: jestan@essex. ac. uk • • • Bendik Andersen: bandera@essex. ac. uk Alice Redknap: ar 16991@essex. ac. uk Alice Hutchins: ah 18583@essex. ac. uk Queal King: qk 17214@essex. ac. uk Adnan Pavel: ap 18721@essex. ac. uk