A First Look at Modern Enterprise Traffic Ruoming
,")


 – A research institute with")


 are over IP")


 (Bars add up to 100%)")
 payloads are sent within the enterprise.")


 – Higher volume (80%")

.")


")
- Slides: 41
A First Look at Modern Enterprise Traffic Ruoming Pang, Princeton University Mark Allman (ICSI), Mike Bennett (LBNL), Jason Lee (LBNL), Vern Paxson (ICSI/LBNL), and Brian Tierney (LBNL)
The Question “What does the traffic look like in today’s enterprise networks? ” • Previous work – LAN traffic [Gusella 1990, Fowler et. al. 1991] – More recent work on individual aspects: • Role classification [Tan et. al. 2003], • Community of interest [Aiello et. al. 2005] • Wide area Internet traffic measurements – First study: [Cáceres 1989] … when the size of Internet was ~130, 000 hosts … about the size of a large enterprise network today
Our First Look • Which applications account for most traffic? • Who is talking to whom? • What’s going on inside application traffic? – Esp. ones that are heavily used but not well studied: Netware Core Protocol (NCP), Windows CIFS and RPC, etc. • How often is the network overloaded? For all above, compare internal vs. wide area
Trace Collection • Where: Lawrence Berkeley National Lab (LBNL) – A research institute with a medium-sized enterprise network • Caveat: one-enterprise study – “The traffic might look like …” • How: tapping links from subnets to the main routers • Caveat: only traffic between subnets
LBNL Trace Data D 0 Date Duration D 1 D 2 D 3 Oct 4, 04 Dec 15, 04 Dec 16, 04 D 4 Jan 6, 05 Jan 7, 05 10 min 1 hour 22 22 22 18 18 Traced Hosts 2, 531 2, 102 2, 088 1, 561 1, 558 Packets 18 M 65 M 28 M 22 M 28 M Snaplen 1500 68 68 1500 Subnets • Five data sets • Over three months: Oct 2004 -- Jan 2005
LBNL Trace Data D 0 Date Duration D 1 D 2 D 3 Oct 4, 04 Dec 15, 04 Dec 16, 04 D 4 Jan 6, 05 Jan 7, 05 10 min 1 hour 22 22 22 18 18 Traced Hosts 2, 531 2, 102 2, 088 1, 561 1, 558 Packets 18 M 65 M 28 M 22 M 28 M Snaplen 1500 68 68 1500 Subnets • Each trace covers a subnet • Lasts ten minutes or one hour
LBNL Trace Data D 0 Date Duration D 1 D 2 D 3 Oct 4, 04 Dec 15, 04 Dec 16, 04 D 4 Jan 6, 05 Jan 7, 05 10 min 1 hour 22 22 22 18 18 Traced Hosts 2, 531 2, 102 2, 088 1, 561 1, 558 Packets 18 M 65 M 28 M 22 M 28 M Snaplen 1500 68 68 1500 Subnets • Two sets of subnets • 2, 000 hosts traced per data set
LBNL Trace Data D 0 Date Duration D 1 D 2 D 3 Oct 4, 04 Dec 15, 04 Dec 16, 04 D 4 Jan 6, 05 Jan 7, 05 10 min 1 hour 22 22 22 18 18 Traced Hosts 2, 531 2, 102 2, 088 1, 561 1, 558 Packets 18 M 65 M 28 M 22 M 28 M Snaplen 1500 68 68 1500 Subnets • Subnets are traced two at a time – With four NIC’s on the tracing machine
LBNL Trace Data D 0 Date Duration D 1 D 2 D 3 Oct 4, 04 Dec 15, 04 Dec 16, 04 D 4 Jan 6, 05 Jan 7, 05 10 min 1 hour 22 22 22 18 18 Traced Hosts 2, 531 2, 102 2, 088 1, 561 1, 558 Packets 18 M 65 M 28 M 22 M 28 M Snaplen 1500 68 68 1500 Subnets • Packets with full payloads allow application-level analysis
Outline of This Talk • Traffic breakdown – Which applications are dominant? • Origins and locality • Individual application characteristics
Network Layer: Is IP dominant? • Yes, most packets (96 -99%) are over IP – Caveat: inter-subnet traffic only • Aside from IP: ARP, IPX (broadcast), etc.
Transport Layer • Protocols seen: – TCP, UDP, ICMP – Multicast: IGMP, PIM – Encapsulation: IP-SEC/ESP, GRE – IP protocol 224 (? ) • Is UDP used more frequently inside enterprise than over wide area Internet?
TCP vs. UDP / WAN vs. Enterprise Breakdown by Payload Bytes
Breakdown of the first data set (D 0) (Bars add up to 100%)
80% (or more) payloads are sent within the enterprise.
Yes, UDP is used more frequently inside the enterprise.
Breakdown by Flows
Application Breakdown by Bytes
net-file: NFS, Netware Core Protocol Application Breakdown by Bytes
bulk: FTP, HPSS Application Breakdown by Bytes
windows: Port 135, 139, and 445 Application Breakdown by Bytes
Bars for each data set add up to 100%
net-file: NFS NCP backup: Dantz Veritas Internal Heavy-Weights
WAN ≈ web + email WAN Heavy-Weights
name: DNS WINS Breakdown by Flows misc: Calendar Card. Key
Summary of Traffic Breakdown • Internal traffic (vs. wide area) – Higher volume (80% of overall traffic) – A richer set of applications • Traffic heavy-weights – Internal: network file systems and backup – WAN: web and email
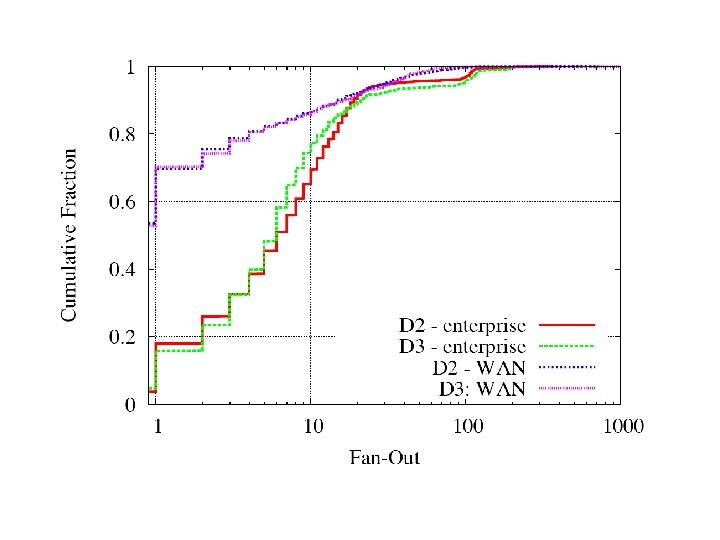
Outline • Traffic breakdown • Origins and locality – Fan-in/out distribution • Individual application characteristics
Half of hosts have no wide-area fan-out (in one hour).
Internal fan-out has a fat tail.
Most hosts have fan-in of no more than 10.
Outline • Traffic breakdown • Origins and locality – Fan-in/out distribution • Individual application characteristics
Example Questions • Is there a big difference between internal and wide area HTTP traffic? • How different are DNS and WINS (netbios/ns)? • What does Windows traffic do?
Internal HTTP traffic Automated clients vs. the rest: Requests Bytes D 0 D 3 D 4 Internal Scanners 20% 49% 19% 0. 1% 0. 9% 1% Google Devices 37% 8% 5% 96% 69% 48% Netware i. Folder 1% 0. 2% 10% 0. 0% 9% All other clients 42% 43% 66% 4% 30% 41% Automated clients dominate the traffic.
DNS vs. WINS • Where do queries come from? – DNS: both local and remote; most queries come from two mail servers – WINS: local clients only; queries are more evenly distributed among clients • Failure rate (excluding repeated queries) – DNS: 11 -21% – WINS: 36 -50% (!)
Windows Traffic Port 139 Port 445 NETBIOS File Sharing CIFS/SMB Port 135 Dynamic Ports Port numbers don’t tell much… LAN Browsing DCE/RPC Endpoint Mapper DCE/RPC Services (logon, msgr, etc. )
Windows Traffic Port 139 Port 445 Port 135 Dynamic Ports NETBIOS File Sharing CIFS/SMB LAN Browsing DCE/RPC Endpoint Mapper DCE/RPC Services (logon, msgr, etc. ) Application level analysis: Bro + binpac
Windows Traffic Breakdown • Majority of CIFS/SMB traffic is for DCE/RPC services – Rather than file sharing • Majority of RPC traffic – By request: user authentication (netlogon), security policy (lsarpc) and printing (spoolss) – By size: printing (spoolss)
Not Covered in This Talk … • Characteristics of more applications – Email – Network file systems: NFS and NCP – Backup – Further details about HTTP, DNS/WINS, and Windows traffic • Network congestion
Conclusion • A lot is happening inside enterprise – More packets sent internally than cross border – A number of applications seen only within the enterprise • Caveats – – One enterprise only Inter-subnet traffic Hour-long traces Subnets not traced all at once • Header traces released for download! – To come: traces with payloads (HTTP, DNS, …)
The End To download traces: http: //www. icir. org/enterprise-tracing (or search for “LBNL tracing”)