2008 TEACHER ORIENTATION Minnesota Department of Education http


- Slides: 40
2008 TEACHER ORIENTATION
• Minnesota Department of Education http: //education. state. mn. us • Minnesota Service Cooperatives www. ssc. coop/sec • Council of Chief State School Officers www. SECsurvey. org • Wisconsin Center for Education Research www. SEConline. org • Learning Point Associates www. ncrel. org/sec • TERC Regional Alliance DEC Project www. ra. terc. edu/DEC
What is the Value of the SEC? • Improve alignment of instruction with standards by identifying specific content areas that are not aligned. • Improve articulation of instruction across grades and between buildings. • Assess needs in areas of curriculum, instruction, and professional development. • Engage teachers in objective dialogue about what and how they teach.
• Identify gaps, redundancies, and areas for integration in the enacted curriculum. • Used over time to measure progress towards changes in instructional practice. • Compare to achievement data to identify where changes are needed to help students meet proficiency levels on statewide tests. • Use aggregate data on a statewide level to inform best practices and funding allocations.
“Teachers show what they believe is worth learning by the way they allocate time in the classroom and by the emphasis they convey to their students about what is really important. ” Anderson, L. W. , & Krathwohl, D. R. (Eds. ). (2001). A taxonomy for learning, teaching, and assessing: A revision of Bloom's taxonomy of educational objectives. New York: Longman.
How the SEC Data Is Used • Collects teachers’ reflections on classroom instruction and aggregates data from teachers for district- level displays. • In groups of three teachers or more, display comparisons with the following: – State standards and/or assessments – District-level groups – Grade-level groups within the district • Never for teacher evaluation.
Expectations of Teachers • Complete all three survey sections: – Describe the target class and school demographics. – Describe instructional content. – Describe instructional practice. • Provide a reflective depiction of instruction. • Survey completion time is 60– 90 minutes. • Consider sharing your results with colleagues.
School and Target-Class Description • Provide a general description of your school. • Provide a general description of the target class you will consider as you complete the survey. • Complete required fields.
School and Target-Class Description
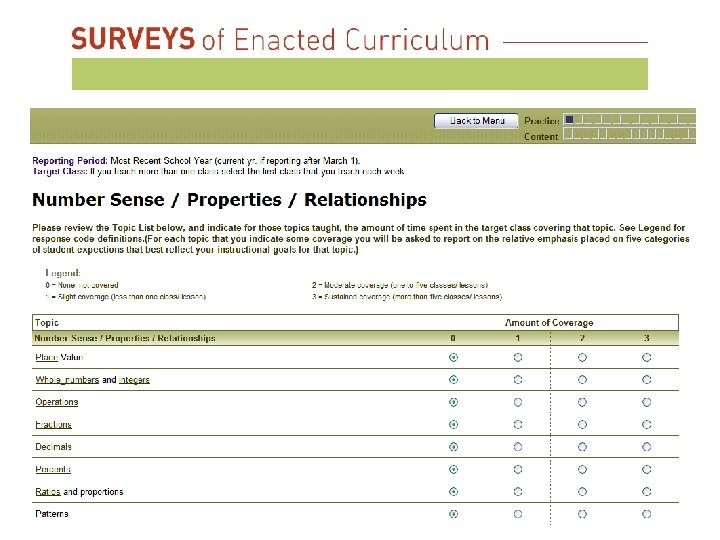
INSTRUCTIONAL CONTENT This section of the survey asks about the cognitive expectations a teacher has in regards to student performance and the time spent on the curriculum topics taught during the school year. Results from this section of the survey answer: • On what content topics do teachers focus their instructional time? • What cognitive demand do teachers emphasize with each content topic? • Is instruction in our school aligned with state content standards?
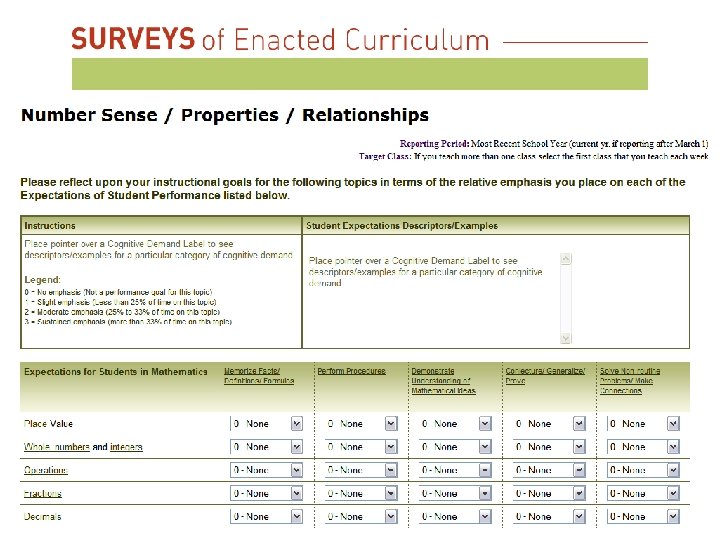
Instructional Content • Part A: Topics taught and time devoted to instructional topics – “What students should know” • Part B: Expectations of students/ cognitive demand – “What students should be able to do with what they know”
Instructional Topics • Topics provide the framework for data collection and comparison. • Topics include the range of topics found in mathematics classrooms, K– 12. • Locate the Math Topic List.
SEC Response Codes for Time on Topic • • 0 = None 1 = Slight coverage (less than 1 class/lesson) 2 = Moderate coverage (1 -5 classes/lessons) 3 = Sustained coverage (more than 5 classes/lesson) Note: The entire school year is always the time frame for time on topic.
COGNITIVE DEMAND LEVEL • State standards and assessments have inherent cognitive expectations. Instructional activities also have cognitive demand. • The SEC measure the cognitive expectations of instruction. • In other words, educators are asked to identify whether the intent of the lesson is for students to memorize/recall, demonstrate/perform, communicate understanding, analyze/investigate, or apply learning in a new context.
Cognitive Demand Categories K-12 Mathematics – Memorize – Perform procedures – Demonstrate understanding of mathematics concepts – Conjecture, generalize, and prove – Solve non-routine problems and make connections
Memorize Facts, Definitions, Formulas Perform Procedures • Recite basic • Use numbers to mathematical facts count, order, • Recall denote mathematics terms • Do computational and definitions procedures or • Recall formulas algorithms and computational • Follow procedures and/or instructions • Solve equations, formulas, and/or routine word problems • Organize or display data • Read or produce graphs and tables • Execute geometric constructions Demonstrate Understanding • Communicate mathematical ideas • Use representations to model mathematical ideas • Explain findings and results from data analysis strategies • Show or explain relationships between models, diagrams, and/or other representations Conjecture, Generalize, Prove • Determine the truth of a mathematical pattern or proposition • Write formal or informal proofs • Recognize, generate or create patterns • Find a mathematical rule to generate a pattern or number sequence • Make and investigate mathematical conjectures • Identify faulty arguments or misrepresentations of data • Reason inductively or deductively Solve Non-Routine Problems, Make Connections • Apply and adapt a variety of appropriate strategies to solve non-routine problems • Apply mathematics in contexts outside of mathematics • Analyze data, recognize patterns • Synthesize content and ideas from several sources
SEC Response Codes for Cognitive Demand • 0 = No emphasis • 1 = Slight emphasis (less than 25% of time on this topic) • 2 = Moderate emphasis (25%-33% of time on this topic) • 3 = Sustained emphasis (more than 33% of time on this topic) Note: Emphasis doesn’t need to equal 100%.
Cognitive Demand Activity • Work in small groups with teachers that teach the same/similar grades • Review the list of activities and choose three that would be appropriate for the grade level you teach • Using the SEC Cognitive Demand Categories determine what you believe would be an appropriate student expectations for the activity
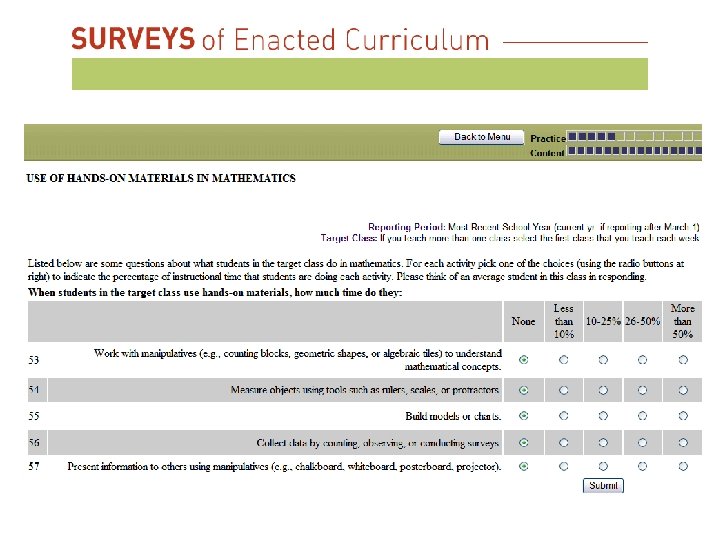
INSTRUCTIONAL PRACTICES This section asks questions about how classroom time is spent, as well as teacher preparation. Topics such as homework, classroom activities, and assessments are covered. The section also covers topics such as teacher training, teacher opinions, and class demographics. Results from this section of the survey answer: • Which activity types get the most (or least) use? • What attitudes and beliefs do our teachers hold? • How frequently are teachers involved in PD? • What do we know about our instructional program? • How can we create a baseline of data as an evaluation of a new program or initiative?
Instructional Practices • • • Homework Instructional practices Assessments Opinions and beliefs Classroom instructional preparation • Professional development • Personal characteristics • Formal course preparation
Log on to www. seconline. org
To register, click on Registrar
To register, select Minnesota
User Information Agreement Here you are asked to agree to release your information for research.
Fill in all the fields and then click “submit”
Enter a unique user name and password Enter a valid e-mail address
Click Continue
Survey Sections This screen provides information about the status of your survey.
Important Reminders
Survey Menu
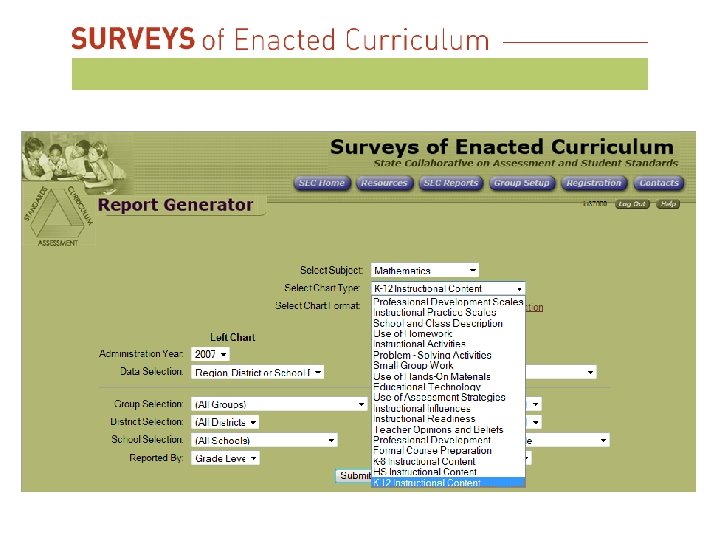
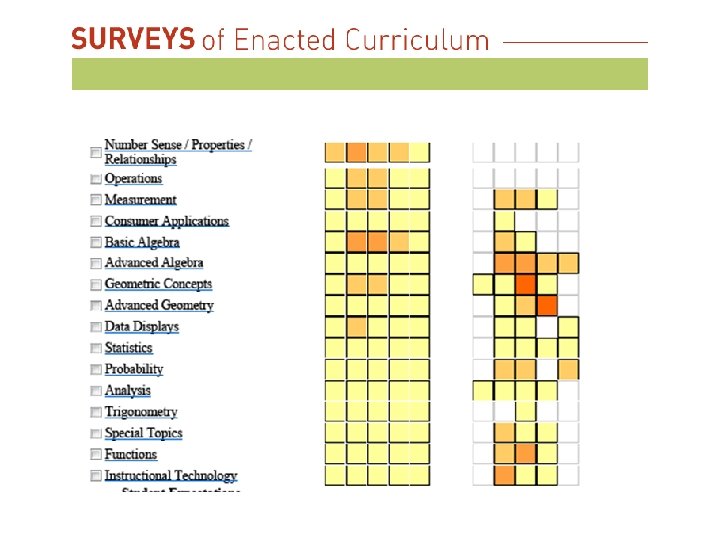
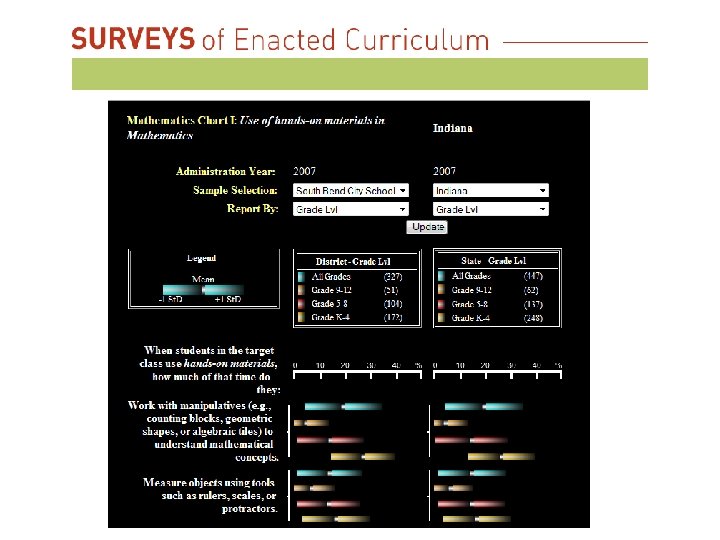
24/7 ONLINE REPORTING • Reports are available immediately to the teacher upon completion of the survey. • District and school level results are available when the survey window closes. • To protect confidentiality, the teacher is the only person with access to his/her individual results. • At the district or state level, there must be 3 or more teachers at any given grade level to view results. Otherwise, data must be clustered. • Reports can be generated in multiple formats.
Alignment re-centered: 0. 39
IMPROVING FOR THE STUDENTS • Curriculum can no longer be an individual choice or action. These tools help educators share, review, change, and modify their classroom practices on an ongoing basis. Therefore, curriculum is never “finished” – rather it is an on-going dynamic process. • Educators are more accountable now than ever. SEC data supports schools in being accountable for student learning and helps promote accountability to self, students, and parents. THAT’S WHAT IT’S ALL ABOUT!
Technical Assistance • E-mail assistance – From WCER: mecgroup@education. wisc. edu – From Amy Grover at SSC: agrover@ssc. coop • WCER phone help (8 am – 5 pm) – 888 -454 -0195 • SSC phone help (any time) – 507 -251 -7410 – Amy Grover’s Cell Phone