MANAGEMENT ACCOUNTING Pearson Education Limited 2008 Cheryl S
- Slides: 34
MANAGEMENT ACCOUNTING © Pearson Education Limited 2008 Cheryl S. Mc. Watters, Jerold L. Zimmerman, Dale C. Morse
2 -2 Measuring and analyzing activity costs (Planning) Chapter 2 Management Accounting Mc. Watters, Zimmerman, Morse © Pearson Education Limited 2008
2 -3 Objectives • Use differential costs and benefits to assist in cost-benefit analysis • Identify and measure opportunity costs for making planning decisions • Ignore sunk costs for making planning decisions • Use cost-benefit analysis to make information choices • Determine how activity costs vary with the rate of output • Calculate marginal and average costs • Approximate activity costs using variable and fixed costs • Use account classification, the high-low and regression methods to estimate variable and fixed costs Management Accounting Mc. Watters, Zimmerman, Morse © Pearson Education Limited 2008
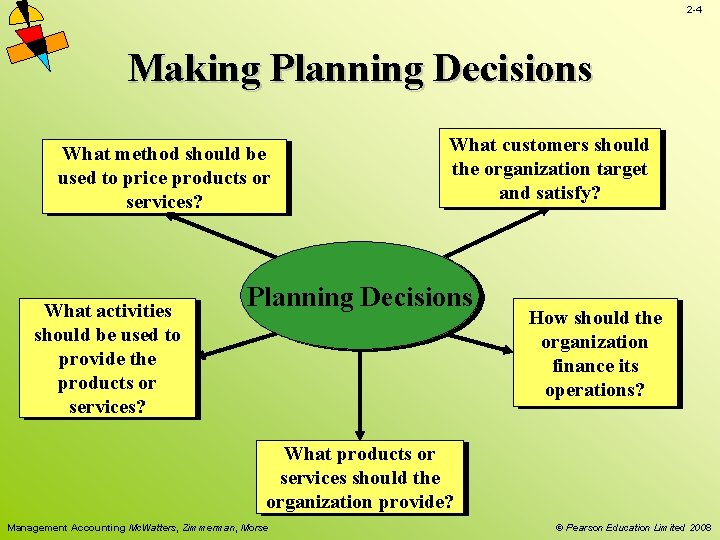
2 -4 Making Planning Decisions What method should be used to price products or services? What activities should be used to provide the products or services? What customers should the organization target and satisfy? Planning Decisions How should the organization finance its operations? What products or services should the organization provide? Management Accounting Mc. Watters, Zimmerman, Morse © Pearson Education Limited 2008
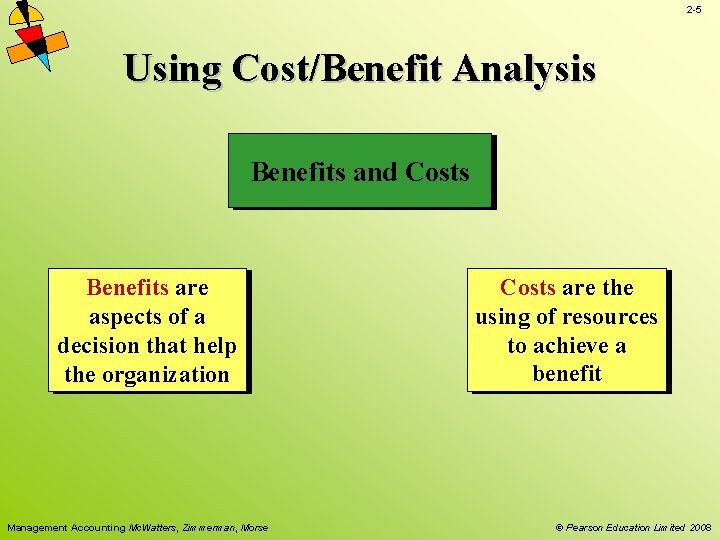
2 -5 Using Cost/Benefit Analysis Benefits and Costs Benefits are aspects of a decision that help the organization Management Accounting Mc. Watters, Zimmerman, Morse Costs are the using of resources to achieve a benefit © Pearson Education Limited 2008
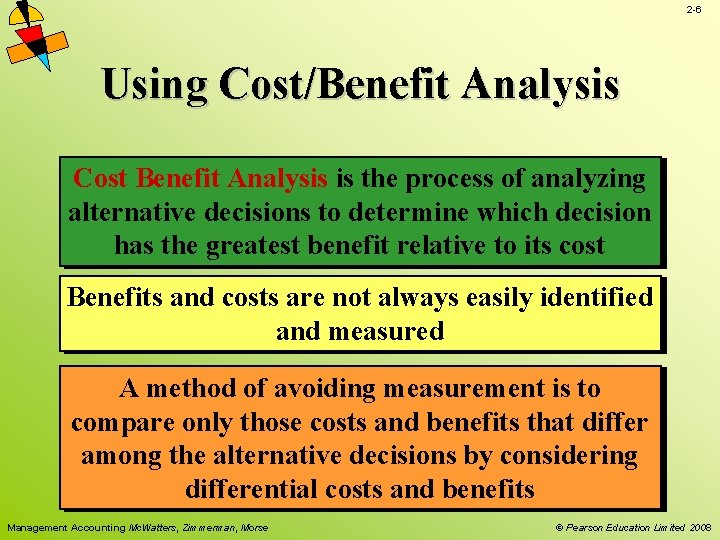
2 -6 Using Cost/Benefit Analysis Cost Benefit Analysis is the process of analyzing alternative decisions to determine which decision has the greatest benefit relative to its cost Benefits and costs are not always easily identified and measured A method of avoiding measurement is to compare only those costs and benefits that differ among the alternative decisions by considering differential costs and benefits Management Accounting Mc. Watters, Zimmerman, Morse © Pearson Education Limited 2008
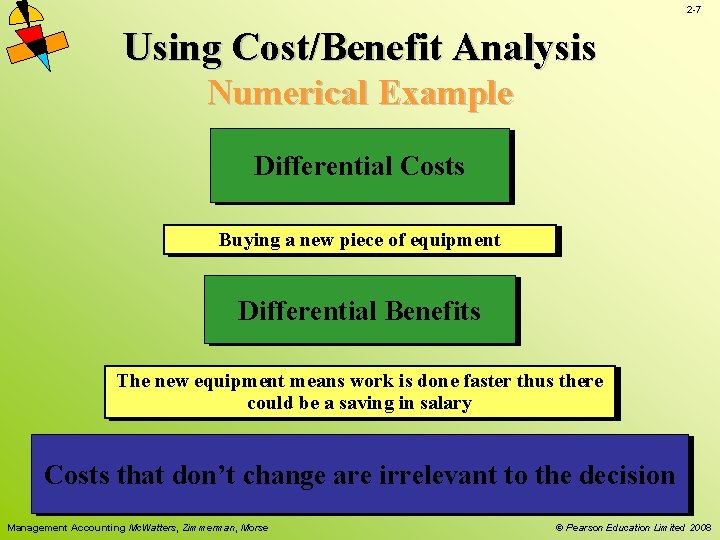
2 -7 Using Cost/Benefit Analysis Numerical Example Differential Costs Buying a new piece of equipment Differential Benefits The new equipment means work is done faster thus there could be a saving in salary Even with differential costs and benefits not all costs Costs that don’t change are irrelevant to the decision and benefits can be easily identified and measured Management Accounting Mc. Watters, Zimmerman, Morse © Pearson Education Limited 2008
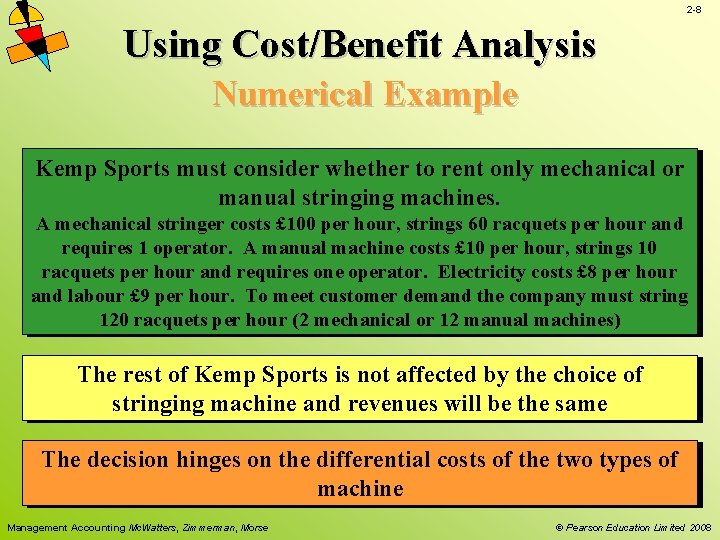
2 -8 Using Cost/Benefit Analysis Numerical Example Kemp Sports must consider whether to rent only mechanical or manual stringing machines. A mechanical stringer costs £ 100 per hour, strings 60 racquets per hour and requires 1 operator. A manual machine costs £ 10 per hour, strings 10 racquets per hour and requires one operator. Electricity costs £ 8 per hour and labour £ 9 per hour. To meet customer demand the company must string 120 racquets per hour (2 mechanical or 12 manual machines) The rest of Kemp Sports is not affected by the choice of stringing machine and revenues will be the same The decision hinges on the differential costs of the two types of machine Management Accounting Mc. Watters, Zimmerman, Morse © Pearson Education Limited 2008
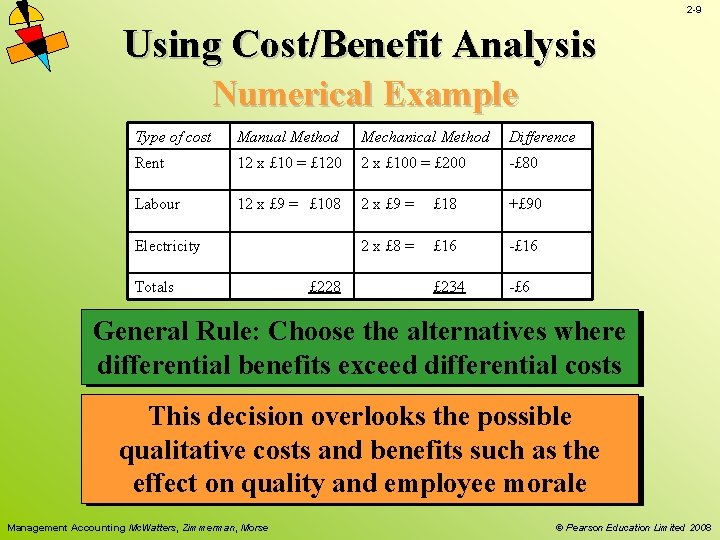
2 -9 Using Cost/Benefit Analysis Numerical Example Type of cost Manual Method Mechanical Method Difference Rent 12 x £ 10 = £ 120 2 x £ 100 = £ 200 -£ 80 Labour 12 x £ 9 = £ 108 2 x £ 9 = £ 18 +£ 90 2 x £ 8 = £ 16 -£ 16 £ 234 -£ 6 Electricity Totals £ 228 General Rule: Choose the alternatives where differential benefits exceed differential costs The. This manual decision method overlooks resultsthe in lower possible costs qualitative and is costs the and preferred benefits choice such as the effect on quality and employee morale Management Accounting Mc. Watters, Zimmerman, Morse © Pearson Education Limited 2008
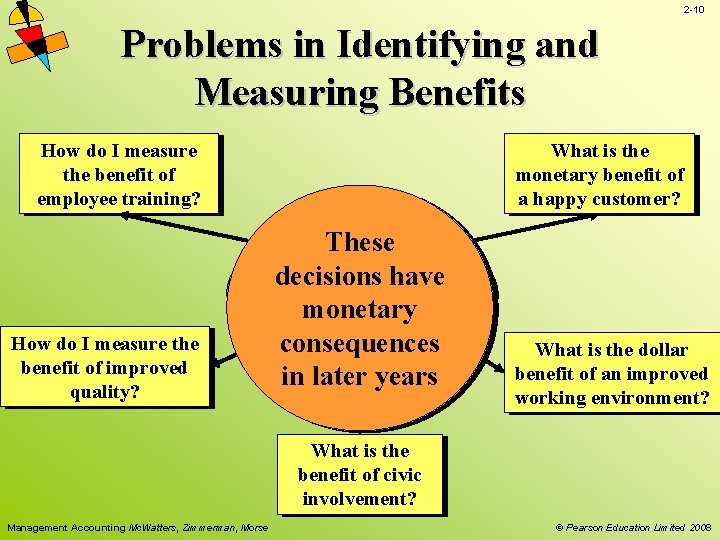
2 -10 Problems in Identifying and Measuring Benefits How do I measure the benefit of employee training? How do I measure the benefit of improved quality? What is the monetary benefit of a happy customer? These decisions have Planning Decisions monetary consequences in later years What is the dollar benefit of an improved working environment? What is the benefit of civic involvement? Management Accounting Mc. Watters, Zimmerman, Morse © Pearson Education Limited 2008
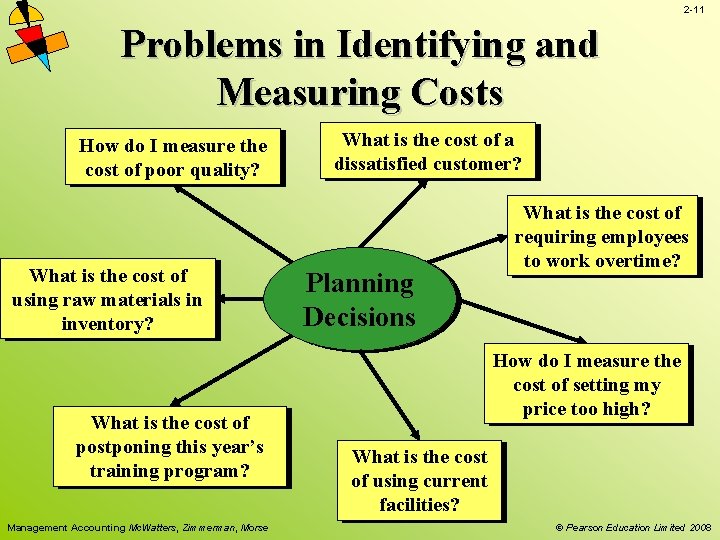
2 -11 Problems in Identifying and Measuring Costs How do I measure the cost of poor quality? What is the cost of using raw materials in inventory? What is the cost of postponing this year’s training program? Management Accounting Mc. Watters, Zimmerman, Morse What is the cost of a dissatisfied customer? Planning Decisions What is the cost of requiring employees to work overtime? How do I measure the cost of setting my price too high? What is the cost of using current facilities? © Pearson Education Limited 2008
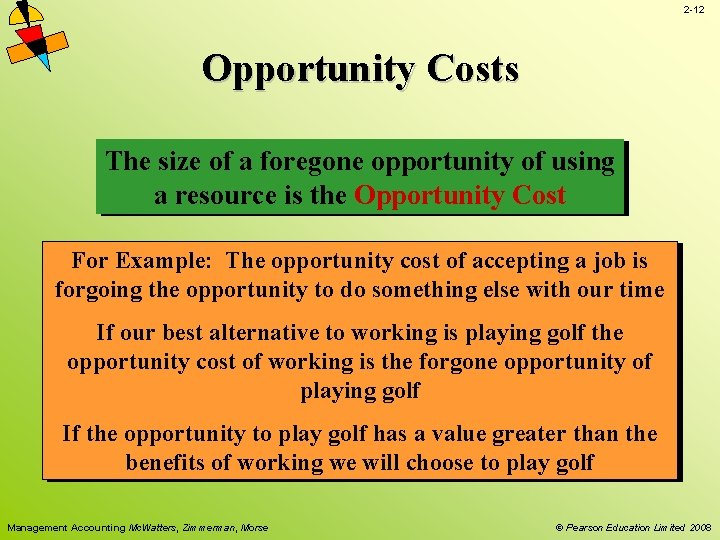
2 -12 Opportunity Costs The size of a foregone opportunity of using a resource is the Opportunity Cost For Example: The opportunity cost of accepting a job is forgoing the opportunity to do something else with our time If our best alternative to working is playing golf the opportunity cost of working is the forgone opportunity of playing golf If the opportunity to play golf has a value greater than the benefits of working we will choose to play golf Management Accounting Mc. Watters, Zimmerman, Morse © Pearson Education Limited 2008
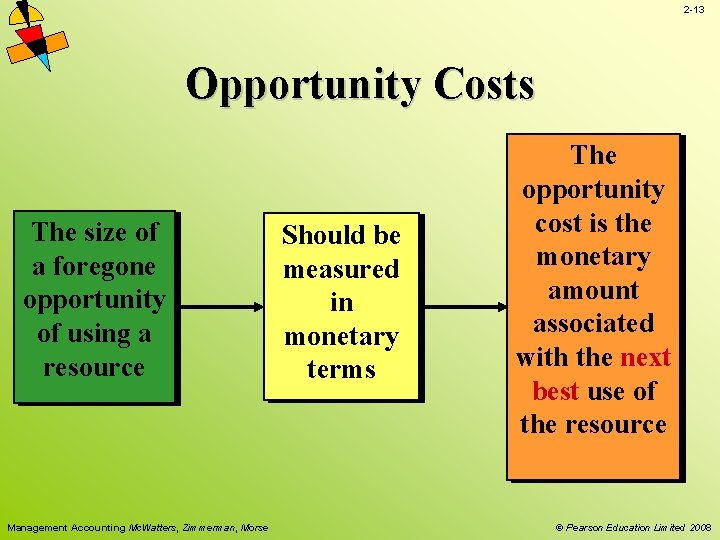
2 -13 Opportunity Costs The size of a foregone opportunity of using a resource Management Accounting Mc. Watters, Zimmerman, Morse Should be measured in monetary terms The opportunity cost is the monetary amount associated with the next best use of the resource © Pearson Education Limited 2008
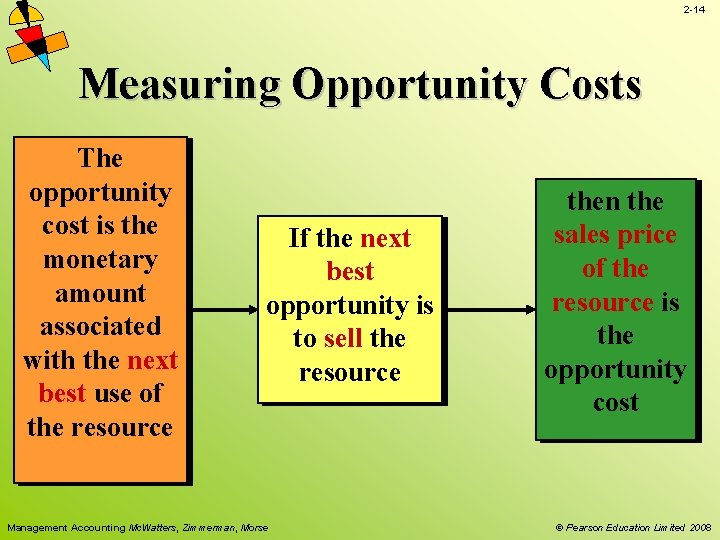
2 -14 Measuring Opportunity Costs The opportunity cost is the monetary amount associated with the next best use of the resource If the next best opportunity is to sell the resource Management Accounting Mc. Watters, Zimmerman, Morse then the sales price of the resource is the opportunity cost © Pearson Education Limited 2008
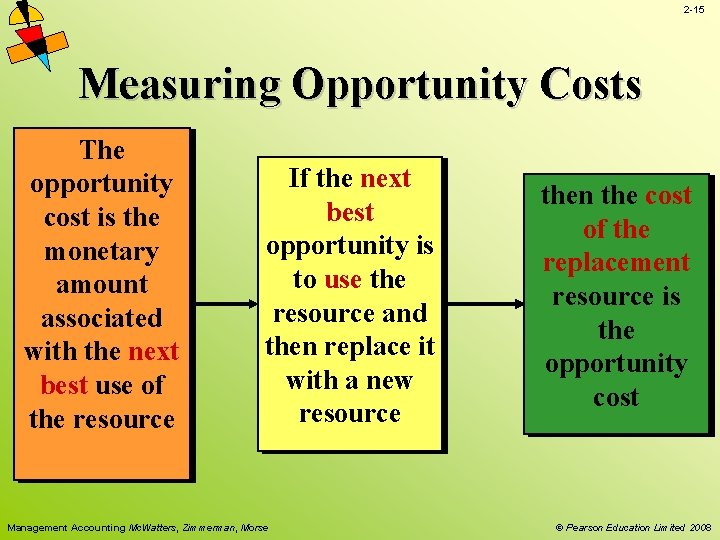
2 -15 Measuring Opportunity Costs The opportunity cost is the monetary amount associated with the next best use of the resource If the next best opportunity is to use the resource and then replace it with a new resource Management Accounting Mc. Watters, Zimmerman, Morse then the cost of the replacement resource is the opportunity cost © Pearson Education Limited 2008
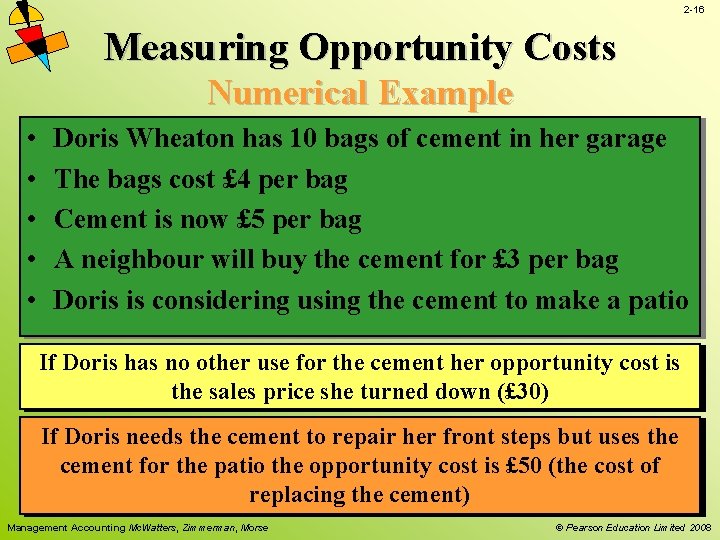
2 -16 Measuring Opportunity Costs Numerical Example • • • Doris Wheaton has 10 bags of cement in her garage The bags cost £ 4 per bag Cement is now £ 5 per bag A neighbour will buy the cement for £ 3 per bag Doris is considering using the cement to make a patio If Doris has no other use for the cement her opportunity cost is the sales price she turned down (£ 30) If Doris needs the cement to repair her front steps but uses the cement for the patio the opportunity cost is £ 50 (the cost of replacing the cement) Management Accounting Mc. Watters, Zimmerman, Morse © Pearson Education Limited 2008
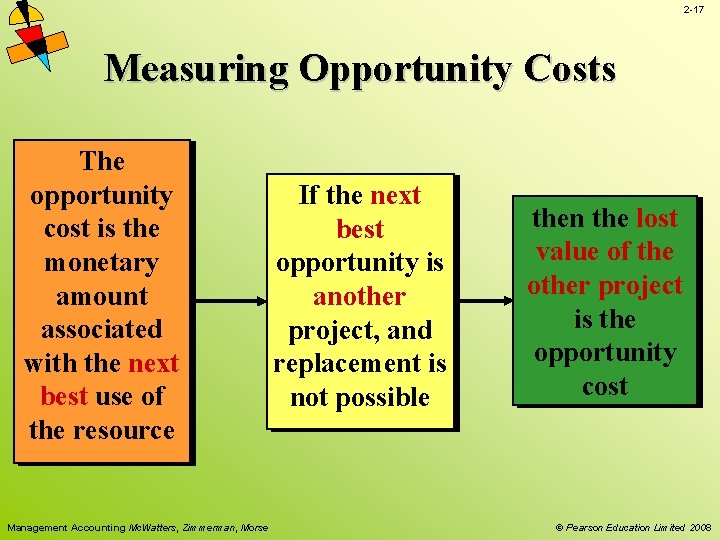
2 -17 Measuring Opportunity Costs The opportunity cost is the monetary amount associated with the next best use of the resource Management Accounting Mc. Watters, Zimmerman, Morse If the next best opportunity is another project, and replacement is not possible then the lost value of the other project is the opportunity cost © Pearson Education Limited 2008
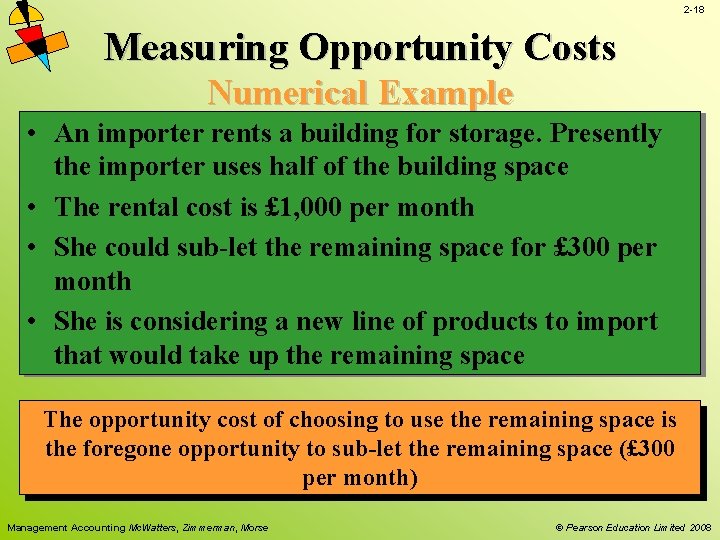
2 -18 Measuring Opportunity Costs Numerical Example • An importer rents a building for storage. Presently the importer uses half of the building space • The rental cost is £ 1, 000 per month • She could sub-let the remaining space for £ 300 per month • She is considering a new line of products to import that would take up the remaining space The opportunity cost of choosing to use the remaining space is the foregone opportunity to sub-let the remaining space (£ 300 per month) Management Accounting Mc. Watters, Zimmerman, Morse © Pearson Education Limited 2008
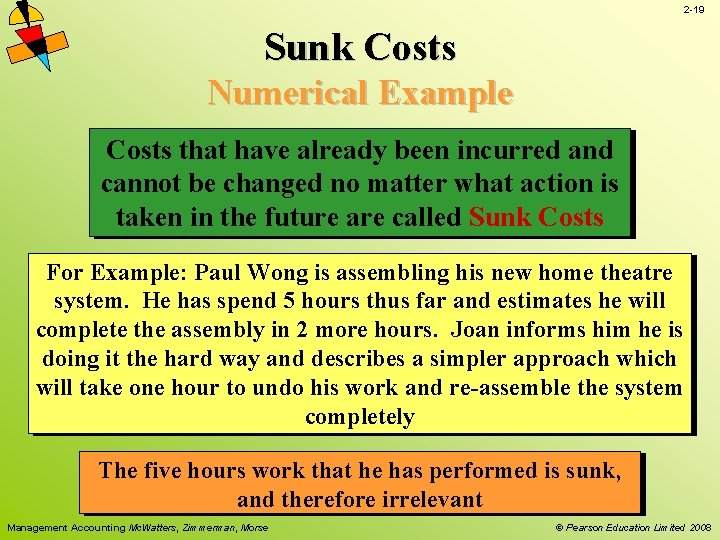
2 -19 Sunk Costs Numerical Example Costs that have already been incurred and cannot be changed no matter what action is taken in the future are called Sunk Costs For Example: Paul Wong is assembling his new home theatre system. He has spend 5 hours thus far and estimates he will complete the assembly in 2 more hours. Joan informs him he is doing it the hard way and describes a simpler approach which will take one hour to undo his work and re-assemble the system completely The five hours work that he has performed is sunk, and therefore irrelevant Management Accounting Mc. Watters, Zimmerman, Morse © Pearson Education Limited 2008
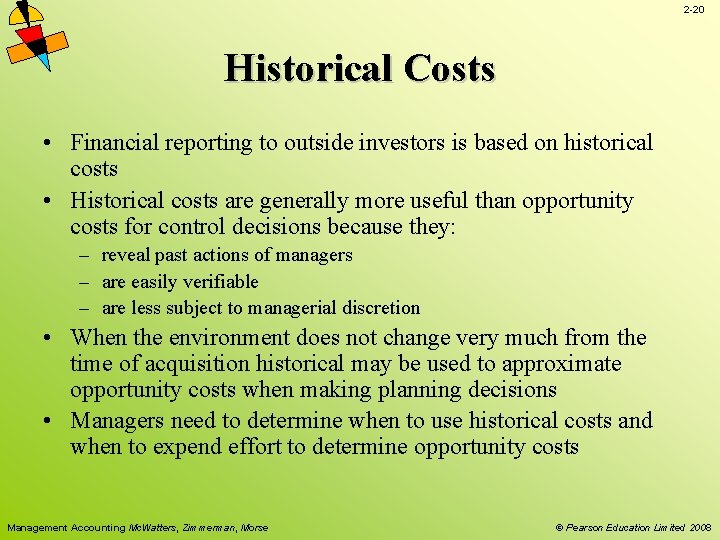
2 -20 Historical Costs • Financial reporting to outside investors is based on historical costs • Historical costs are generally more useful than opportunity costs for control decisions because they: – reveal past actions of managers – are easily verifiable – are less subject to managerial discretion • When the environment does not change very much from the time of acquisition historical may be used to approximate opportunity costs when making planning decisions • Managers need to determine when to use historical costs and when to expend effort to determine opportunity costs Management Accounting Mc. Watters, Zimmerman, Morse © Pearson Education Limited 2008
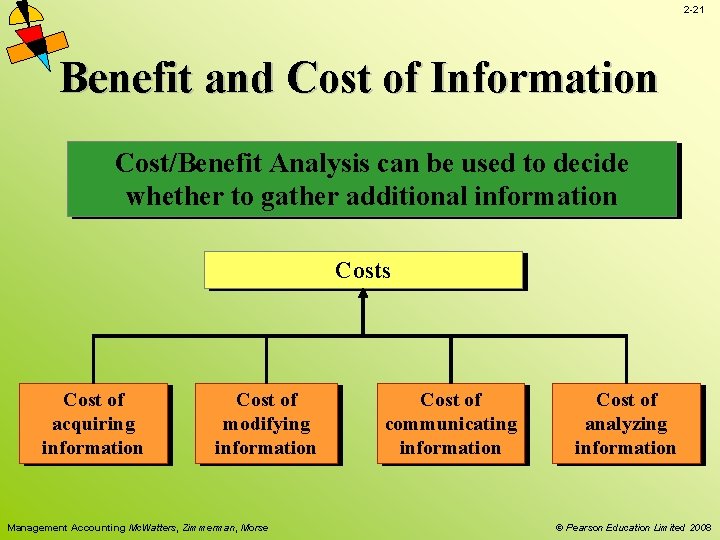
2 -21 Benefit and Cost of Information Cost/Benefit Analysis can be used to decide whether to gather additional information Costs Cost of acquiring information Cost of modifying information Management Accounting Mc. Watters, Zimmerman, Morse Cost of communicating information Cost of analyzing information © Pearson Education Limited 2008
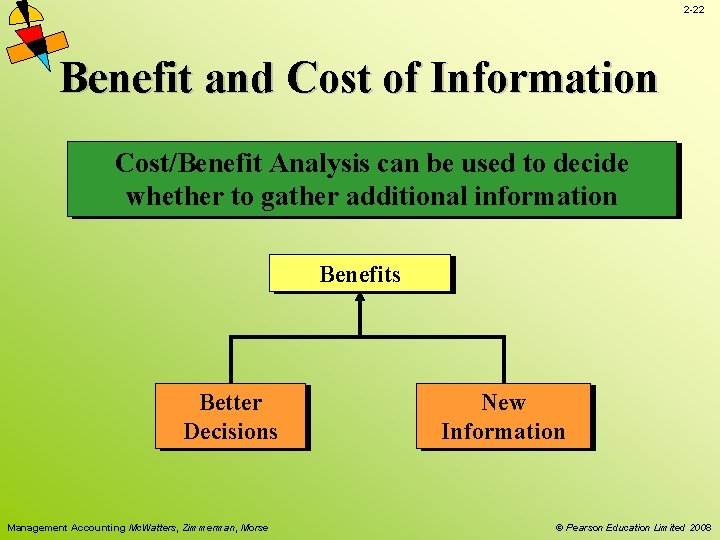
2 -22 Benefit and Cost of Information Cost/Benefit Analysis can be used to decide whether to gather additional information Benefits Better Decisions Management Accounting Mc. Watters, Zimmerman, Morse New Information © Pearson Education Limited 2008
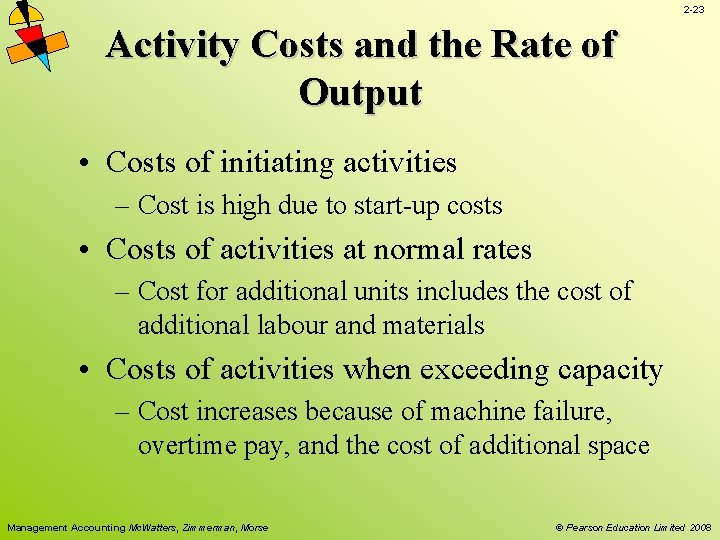
2 -23 Activity Costs and the Rate of Output • Costs of initiating activities – Cost is high due to start-up costs • Costs of activities at normal rates – Cost for additional units includes the cost of additional labour and materials • Costs of activities when exceeding capacity – Cost increases because of machine failure, overtime pay, and the cost of additional space Management Accounting Mc. Watters, Zimmerman, Morse © Pearson Education Limited 2008
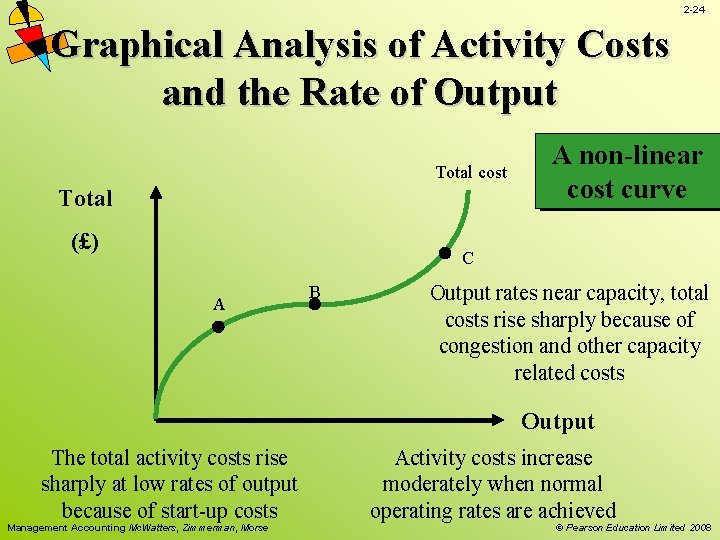
2 -24 Graphical Analysis of Activity Costs and the Rate of Output Total cost Total (£) A non-linear cost curve C A B Output rates near capacity, total costs rise sharply because of congestion and other capacity related costs Output The total activity costs rise sharply at low rates of output because of start-up costs Management Accounting Mc. Watters, Zimmerman, Morse Activity costs increase moderately when normal operating rates are achieved © Pearson Education Limited 2008
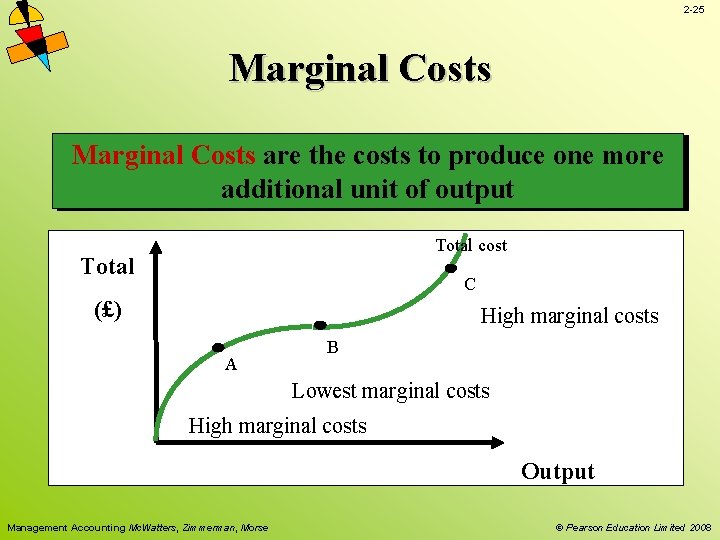
2 -25 Marginal Costs are the costs to produce one more additional unit of output Total cost The slope of the Total Cost Curve at any given Total C level of production is the marginal cost for one (£) High marginal costs more unit A B Lowest marginal costs low output Marginal costs are highest at very costsrates near capacity rates High andmarginal at output Output Management Accounting Mc. Watters, Zimmerman, Morse © Pearson Education Limited 2008
2 -26 Average Costs Average Cost is calculated by dividing the total cost by the total units produced Average Cost is very high at low levels of output Management Accounting Mc. Watters, Zimmerman, Morse © Pearson Education Limited 2008
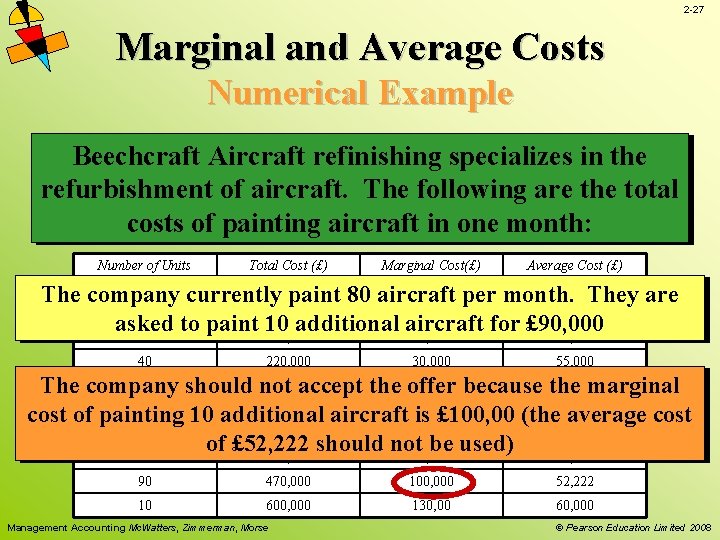
2 -27 Marginal and Average Costs Numerical Example Beechcraft Aircraft refinishing specializes in the refurbishment of aircraft. The following are the total costs of painting aircraft in one month: Number of Units Total Cost (£) Marginal Cost(£) Average Cost (£) 10 100, 000 The company currently paint 80 aircraft per month. They are 20 150, 000 75, 000 asked to paint 10 additional aircraft for £ 90, 000 30 190, 000 40, 000 63, 333 40 220, 000 30, 000 55, 000 50 250, 000 30, 000 because the 50, 000 The company should not accept the offer marginal 60 280, 000 cost of painting 10 additional aircraft 30, 000 is £ 100, 00 (the 46, 667 average cost 70 320, 000 45, 714 of £ 52, 222 should not be used) 80 370, 000 50, 000 46, 250 90 470, 000 100, 000 52, 222 10 600, 000 130, 00 60, 000 Management Accounting Mc. Watters, Zimmerman, Morse © Pearson Education Limited 2008
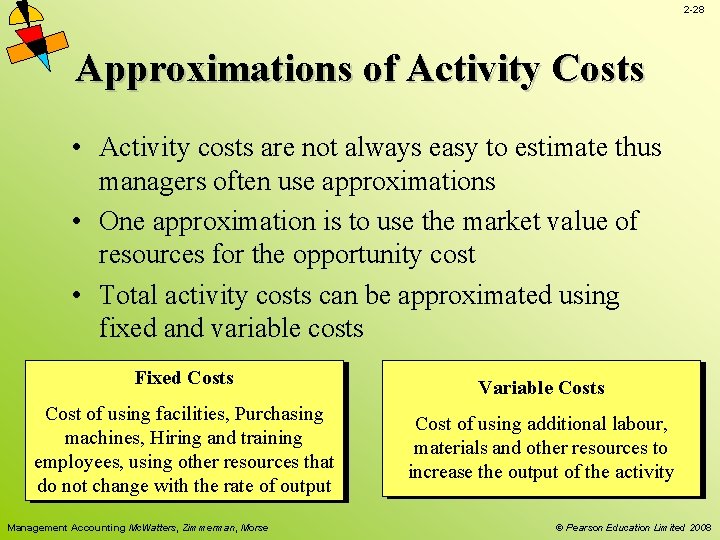
2 -28 Approximations of Activity Costs • Activity costs are not always easy to estimate thus managers often use approximations • One approximation is to use the market value of resources for the opportunity cost • Total activity costs can be approximated using fixed and variable costs Fixed Costs Cost of using facilities, Purchasing machines, Hiring and training employees, using other resources that do not change with the rate of output Management Accounting Mc. Watters, Zimmerman, Morse Variable Costs Cost of using additional labour, materials and other resources to increase the output of the activity © Pearson Education Limited 2008
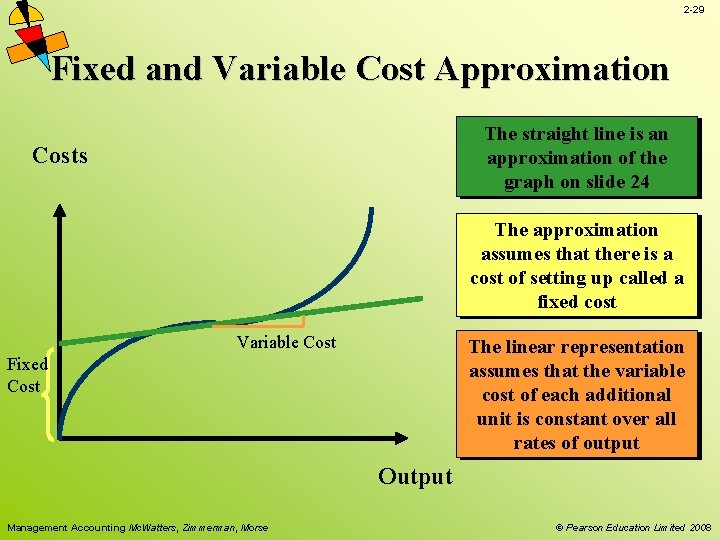
2 -29 Fixed and Variable Cost Approximation The straight line is an approximation of the graph on slide 24 Costs The approximation assumes that there is a cost of setting up called a fixed cost Variable Cost The linear representation assumes that the variable cost of each additional unit is constant over all rates of output Fixed Cost Output Management Accounting Mc. Watters, Zimmerman, Morse © Pearson Education Limited 2008
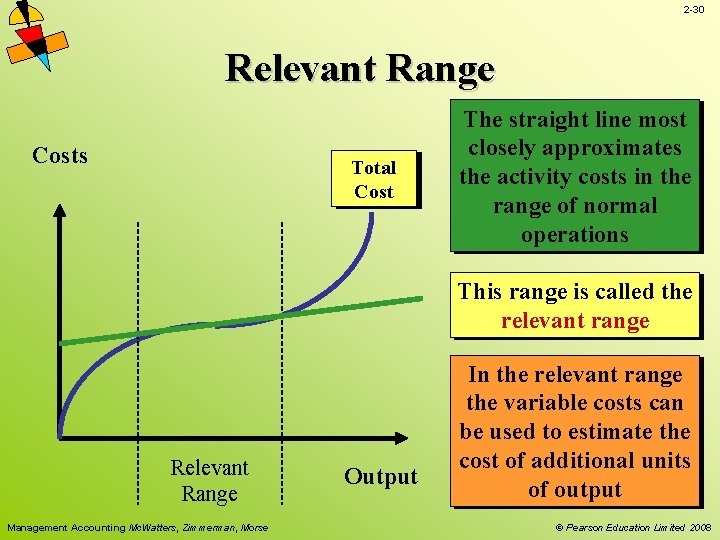
2 -30 Relevant Range Costs Total Cost The straight line most closely approximates the activity costs in the range of normal operations This range is called the relevant range Relevant Range Management Accounting Mc. Watters, Zimmerman, Morse Output In the relevant range the variable costs can be used to estimate the cost of additional units of output © Pearson Education Limited 2008
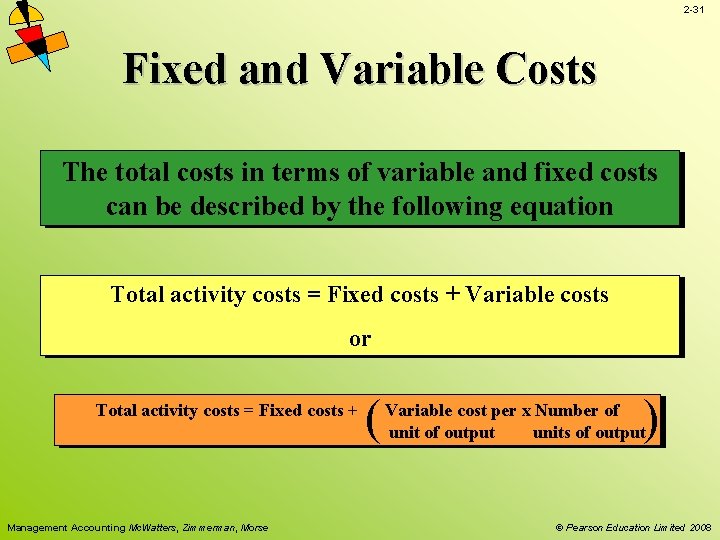
2 -31 Fixed and Variable Costs The total costs in terms of variable and fixed costs can be described by the following equation Total activity costs = Fixed costs + Variable costs or Total activity costs = Fixed costs + Management Accounting Mc. Watters, Zimmerman, Morse ( ) Variable cost per x Number of unit of output units of output © Pearson Education Limited 2008
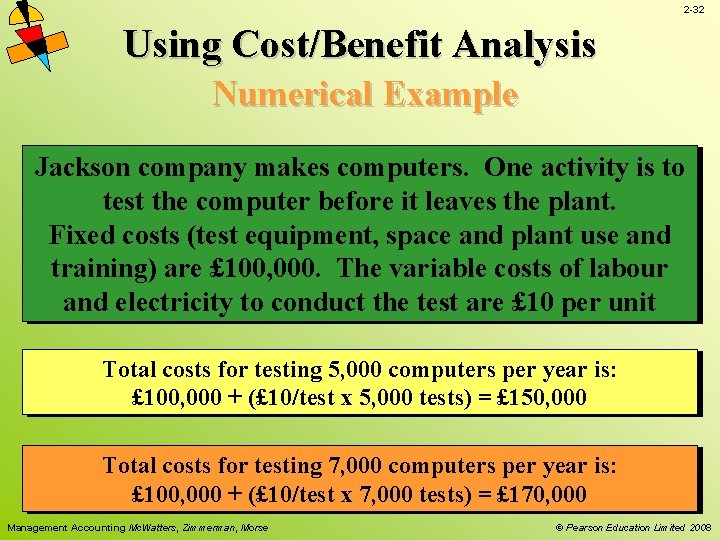
2 -32 Using Cost/Benefit Analysis Numerical Example Jackson company makes computers. One activity is to test the computer before it leaves the plant. Fixed costs (test equipment, space and plant use and training) are £ 100, 000. The variable costs of labour and electricity to conduct the test are £ 10 per unit Total costs for testing 5, 000 computers per year is: £ 100, 000 + (£ 10/test x 5, 000 tests) = £ 150, 000 Total costs for testing 7, 000 computers per year is: £ 100, 000 + (£ 10/test x 7, 000 tests) = £ 170, 000 Management Accounting Mc. Watters, Zimmerman, Morse © Pearson Education Limited 2008
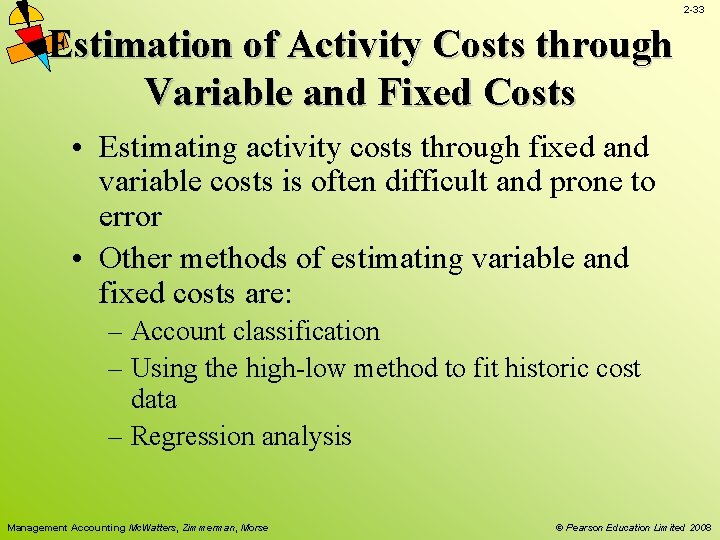
2 -33 Estimation of Activity Costs through Variable and Fixed Costs • Estimating activity costs through fixed and variable costs is often difficult and prone to error • Other methods of estimating variable and fixed costs are: – Account classification – Using the high-low method to fit historic cost data – Regression analysis Management Accounting Mc. Watters, Zimmerman, Morse © Pearson Education Limited 2008
2 -34 MANAGEMENT ACCOUNTING Measuring and analyzing activity costs (Planning) End of Chapter 2 Management Accounting Mc. Watters, Zimmerman, Morse © Pearson Education Limited 2008