10 SEEPAGE INTRODUCTION Onedimensional flow Flow Rate q


 Total rate of inflow")


 We can see")


 is the basic equation for computation of seepage quantities from flow")


 Case when the width of")


![Example 2 (again) Is the arrangement safe against piping? [h / Nd] = 45/14](https://slidetodoc.com/presentation_image_h/d5047dafa0d66bb441996adc930f5804/image-46.jpg "Example 2 (again) Is the arrangement safe against piping? [h / Nd] = 45/14")
 A stiff clay layer underlies a 12 m thick silty sand")


 The following conditions are required for the design of filters:")
- Slides: 57
10. SEEPAGE
INTRODUCTION One-dimensional flow Flow Rate = q = v. A = k. i. A = k (h/L). A
One-dimensional flow Water In Head Loss or Head Difference or Energy Loss i = Hydraulic Gradient Soil L = Drain B age Path Datum ZB Total Head h. B A Pressure Head (q) Water out Elevation Head ZA Elevation Head Total Head h. A Pressure Head h =h. A - h. B
INTRODUCTION Two-dimensional flow In reality, the flow of water through soil is not in one direction only, nor is it uniform over the entire area perpendicular to the flow. 4
INTRODUCTION Two-dimensional flow
INTRODUCTION 8 In the preceding chapter the flow of water for simple 1 -D is calculated through direct application of Darcy's law as already we did in the case of the permeability tests. 8 As engineers, we will wish to examine and calculate the leakage below the sheet pile or through or beneath the dam and find the distribution of pore water pressure (p. w. p) and effective stress throughout the soil. 8 If the structure (sheet pile, dam, …etc. ) is very long, we may neglect the component of flow in the 3 rd dimension and consider only the flow through a slice of unit thickness. 8 This corresponds to plane or two-dimensional flow and we will consider only this case.
8 If p. w. p varies with time the flow will be timedependent. This is what is so-called non-steady state flow or TRANSIENT SEEPAGE. This may be due to: External cause like change in the head difference between inlet or outlet due to any reason. Internal cause like deformation of soil during the process of seepage. 8 In the second case there is a complex interrelationships between p. w. p, seepage, and deformation. This time-dependent process is known as consolidation and is considered in CE 481 Geotechnical Engineering II. 8 If p. w. p do not vary with time, the rate of flow will be constant and the flow is known as STEADY-STATESEEPAGE.
8 During steady state seepage, p. w. p remains constant and no soil deformation occur. Hence we will consider TWO-DIMENSIONAL STEADY-STATE SEEPAGE. 8 The soil may therefore be regarded as RIGID and stationary with a steady flow of water through the pore spaces. 8 Also in this course we will only consider the simple case of CONFINED flow, where the seepage is confined between two impervious surfaces. REQUIREMENTS FOR STEADY STATE FLOW The soil is fully saturated The pressure (and hence total) gradient is unchanging Soil mass is constant Flow rate is constant
TWO-DIMENSIONAL SEEPAGE FLOW THEORY The hydrodynamics steady-state fluid flow through porous media follows the same basic laws as the problems of steady-state: Heat flow Current flow In a continuous contactors All can be represented by LAPLACE EQUATION. In flow problems Laplace equation is the combination of the equation of continuity and Darcy’s law.
In flow Laplace’s Equation of Continuity Out flow (horizontal direction) Total rate of inflow = Total rate of outflow y z Note: Assuming kx= kz x This equation governs the steady flow condition for a given point in the soil mass
Solution of Laplace’s Equation Laplace’s equation can be solved using different methods including: • Separation of variables Analytical Methods • Laplace transform • Fourier transform Numerical Methods • Finite element • Finite difference Hydraulic models • Sand models • Viscous fluid models Electric analogy Graphical method Flow nets • Models • Finite element • Finite difference • Trial-and-error sketching
8 The analytical methods are exact, however they are complicated and solutions are available only for simple boundary conditions. Therefore they are less practical. 8 Numerical methods vastly developed in the presence of digital computer and a number of solutions are now available. 8 Graphical method termed FLOW NET is preferred by many because it is very versatile and simple. 8 In this course we will limit ourselves to flow net through trial-and-error sketching. 8 By constructing the flow net we can know the values of head at any point in the soil and also find the flow.
Intuition basis of flow nets 8 Consider flow through the constant head permeameter shown below: 8 We can see that there are two families of lines: • Vertical lines which represent the direction of flow of water particles. • Horizontal lines which represent lines of constant head. 8 Note: As the water progress through the sample, head is lost at constant rate (but we deal only with steady state, i. e. h is constant)
8 Consider the other way around (i. e. flow is horizontal) We can see also that there are TWO families of lines: Horizontal lines which represent the direction of flow of water particles. Vertical lines which represent lines of constant total head.
Theoretical Basis of Flow Nets 8 The governing equation is a 2 nd order homogeneous, partial differential equation with constant coefficients. 8 The solution of this equation is represented by two functions which both satisfies the equation and any relevant boundary conditions. 8 These functions are the potential function (x, z) and the flow function (x, z). These functions represent a family of equipotential lines and a family of flow lines constituting what is referred to as a FLOW NET. 8 These lines are proved to be orthogonal.
8 What we actually do, we by following specific rules find the FLOW Net by which we reach the solution of Laplace’s equation. 8 In other word flow net is actually a graphical solution of Laplace’s Equation in 2 -D.
FLOW NET CONSTRUCTION 8 There a number of procedures available by which an engineer may DRAW a flow net for the solution of a seepage problem. Among these are: Mathematical solution Electrical analogy Physical models Method of fragments Trial sketching method 8 We will consider only the last one.
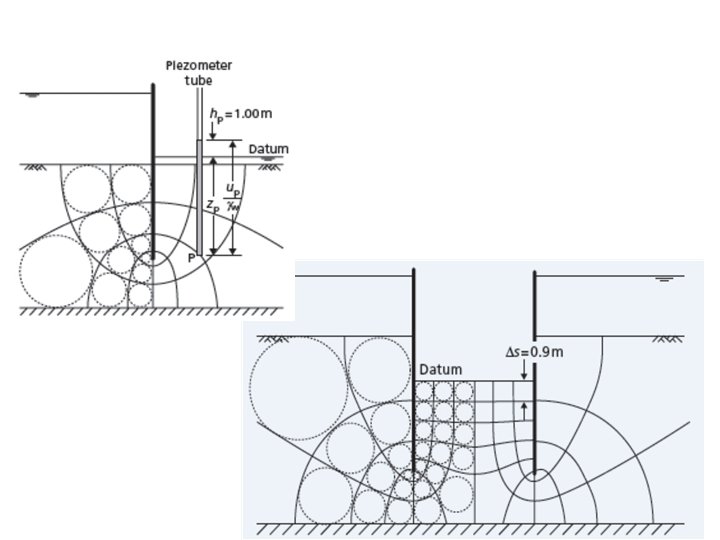
FUNDAMENTAL DEFINITIONS 8 A line along which a water particle will travel from upstream to the down stream side in the permeable soil medium is called a FLOW LINE (OR STREAM LINE). 8 A line along which the TOTAL HEAD at all points is the same is called EQUIPOTENTIAL line. 8 If piezometers are placed at different points along an equipotential line, the water level will rise to the same elevation in all of them. Different pressure heads but equal total heads Datum
8 The space between any two adjacent flow lines is called FLOW PATH, FLOW TUBE, or FLOW CHANNEL. 8 The space between any two equipotential lines is called EQUIPOTENTIAL SPACE. 8 The mesh made by a number of flow lines and equipotential lines is called a FLOW NET. 8 The “Phreatic surface” is the top flow line Flow channel Flow line Equipotential line
Illustration
Illustration FLOW LINES
Illustration
Illustration Boundary Conditions 23
Illustration H 0 H H-3 h 5 h H-4 H-2 h H - h H- h 24
Rules Followed in Sketching Flow Nets 1. Flow lines and equipotential lines must intersect at right angles. 2. Constant head boundaries represent initial or final equipotentials. 3. Impermeable (no-flow) boundaries are flow lines. 4. Adjacent equipotentials have equal head loss (=h/Nd) 5. The same quantity of seepage flows between pairs of flow lines (i. e. equal flow channels).
6. Geometric figures formed by pairs of flow lines and equipotential lines must be essentially squares. This is the case when we have a true flow net. In more practical case involving curvilinear flow, the figures cannot be true squares. However they must have right angles at the corners and the two median dimensions of each figure must be equal. Note: Drawing of square elements is convenient but not always necessary
STEPS IN CONSTRUCTING FLOW NETS Step 1: Draw to a convenient scale a cross-section of the medium and its boundaries. Step 2: Establish the two boundary flow lines and the two boundary equipotential lines. . Step 3: By trial and error sketch a network of flow lines and equipotential lines, observing the right-angle intersection and the space figures rules. Where flow direction is a straight line, flow lines are an equal distance apart and parallel. Step 4: At first attempt certainly there will be some inconsistencies. Successive trials are made until the net is reasonably consistent throughout.
GENERAL SUGGESTIONS AND TIPS FOR THE CONSTRUCTION OF FLOW NETS Use as few flow lines (and resulting equipotential lines) as possible. Generally THREE to FIVE lines will be sufficient. Be practical in selecting a scale for the drawing. A scale that is too large waste time and eraser. Before starting the sketch a flow net look for important boundary conditions. Always watch the appearance of the entire flow net. Do not make fine detail adjustments until the entire flow net is approximately correct. Try to keep the number of flow channels to a whole number. Remember, flow lines do not intersect the lower boundary since itself is a flow line. Obtaining results from a rough flow net is considered adequate. The error committed is relatively small in comparison to the accuracy we obtain for the coefficient of permeability.
SEEPAGE CALCULATION FROM FLOW NETS Let us first consider the case of straight flow and equipotential lines (i. e. perfect squares) as shown in the figure below. • In a flow net, the strip between any two adjacent flow lines is called a flow channel. • The drop in the total head between any two adjacent equipotential lines is called the potential drop. h Soil l h s
Applying Darcy’s law, the flow in each flow channel is Since the figures are squares (as must be the case in general) s/l =1, and hence Since the potential drop between any two adjacent equipotential lines is the same, then Where Nd is the number of potential drops. If the number of flow channels is Nf, then the total discharge q per unit depth (perpendicular to the paper) is
Remarks Equation (*) is the basic equation for computation of seepage quantities from flow net. The ratio Nf/Nd is called the shape factor. Equation (*) for the case when the width of the cross-section of the channel normal to the page is UNITY. If it is not we have to multiply it by the given value of the width, or Eq. (**)
CURVILINEAR FLOW AND EQUIPOTENTIAL LINES Now consider the case of curvilinear flow and equipotential lines (hence curved flow channel) as shown in the figure across. Flow element Case I: Square Elements (medians are equal) 1. Because there is no flow across the flow line, rate of flow through the flow channel per unit width perpendicular to the flow direction is the same, or q 1 = q 2 = q 3 = q 2. The potential drop is the same and equal to: Where h: head difference between the upstream and downstream sides. Nd: number of potential drops.
From Darcy’s Law, the rate of flow is equal to: Note: Here we took the median lengths, for perfect square we have side lengths If the number of flow channels in a flow net is equal to Nf, the total rate of flow through all the channels per unit length can be given by: Eq. (***) …. same as Eq. (*) Instead of thinking of perfect square, we always consider the most general curvilinear case and assuming equal median lengths.
Case II: Rectangular Elements • Drawing of square elements is convenient but not always necessary • Alternatively, one can draw a rectangular mesh for a flow channel provided that the width-to-length ratios for all the rectangular elements in the flow net are the same • In this case the rate of flow through the channel is expressed as
SUMMARY Case of unit depth (perpendicular to the paper) Case when the width of the cross-section of the channel normal to the page is not UNITY. Case of Square Elements (medians are equal) Case of Rectangular Elements (medians are not equal) . b
Example 1 If the horizontal cylinder of soil shown below has a coefficient of permeability of 0. 01 cm/sec. Calculate the amount of flow through the soil. According to rule of square mesh the height of the soil must equal 5 cm. and hence in the 3 rd direction 2 cm
Example 2 If k = 10 -7 m/sec, what would be the flow per day over a 100 m length of wall? Solution Nf = 5 Nd = 14 h = 45 m k = 10 -7 m/sec q = 10 -7 x 45 x(5/14)x 100 = 0. 000161 m 3/sec = 13. 9 m 3/day
Calculation of Heads Consider Point X Total head = h - # of drops from upstream x h Elevation head = -z Pressure head = Total head – Elevation head +ve h concrete dam datum HT = 0 -ve z h X impervious strata
Example 3 Uplift pressure under hydraulic structures Nd = 7 h = 7 m Head Loss at each equipotential line = 7/7 = 1 m h(a) = 6 m, h(b) = 5 m, ……h(f) = 1 m Recall Datum
Example 4 A stiff clay layer underlies a 12 m thick silty sand deposit. A sheet pile is driven into the sand to a depth of 7 m, and the upstream and downstream water levels are as shown in the figure below. k = 8. 6 x 10 -6 cm/sec e =0. 72 Gs= 2. 65 Estimate a) The seepage beneath the sheet pile in m 3/day per meter. b) What is the pore water pressure at the tip of the sheet pile? c) Is the arrangement safe against piping? We will come back to this later.
Solution Let us try and take the datum at the bottom of the layer Total head at the tip = 17 -4 x 3/8 =15. 5 m Elevation head = 5 m
Piping Failures Example Baldwin Hills Dam was constructed between 1947 and 1951 and failed by piping in 1963. The failure occurred when a concentrated leak developed along a crack in the embankment, eroding the embankment fill and forming this crevasse. An alarm was raised about four hours before the failure and thousands of people were evacuated from the area below the dam. The flood that resulted when the dam failed and the reservoir was released caused several millions of dollars in damage.
Exit hydraulic gradient, iexit Critical hydraulic gradient, ic The value of i for which the effective stress in the saturated system becomes ZERO! The critical hydraulic gradient (ic), is given by (See next Chapter) Consequences: no stress to hold granular soils together soil may flow “boiling” or “piping” = EROSION
Factor against piping Typically 5 to 6 Note: we use high value for the factor of safety because of the disastrous consequences of failure.
Example 2 (again) Is the arrangement safe against piping? [h / Nd] = 45/14 = 3. 2 m head per drop Average length of flow is about 3 m Iexit = 3. 2/3 1. 1 Recall For most soils 0. 9 < ic < 1. 1 with an average of 1. 0. Fpiping = 1/1. 1 0. 9 Very dangerous
Example 4 (again) A stiff clay layer underlies a 12 m thick silty sand deposit. A sheet pile is driven into the sand to a depth of 7 m, and the upstream and downstream water levels are as shown in the figure below. k = 8. 6 x 10 -6 cm/sec e =0. 72 Gs= 2. 65 Required c) Is the arrangement safe against piping?
Solution
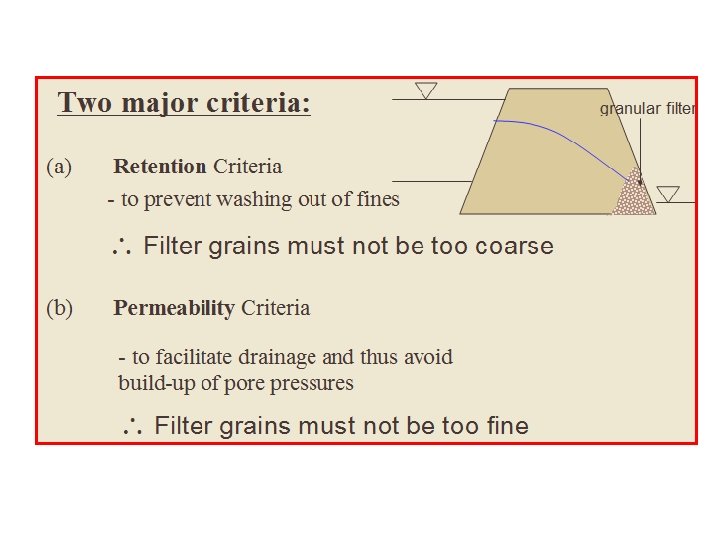
Filter Design As mentioned previously, piping and erosion are a possibility if, somewhere in the porous medium, the gradient exceeded the critical gradient. Piping can occur any place in the system, but usually it occurs where the flow is concentrated. When seepage water flows from a soil with relatively fine grains into coarser material, there is danger that the fine soil particles may wash a way into the coarse material. Over a period of time, this process may clog the void spaces in the coarser material. Hence the grain-size distribution of the coarser material should be properly manipulated to avoid this situation.
There are several methods to control seepage and to prevent erosion and piping, one of which is to use a protective filter. A properly designed coarser material is called a FILTER. A filter consists of one or more layers of free-draining granular materials placed in less pervious foundation or base materials to prevent the movement of soil particles that are susceptible to piping while at the same time allowing the seepage water to escape with relatively little head loss.
Filters used for: • Facilitating drainage • preventing fines from being washed away Used in: • Earth dams • Retaining walls Filter Materials: • Granular soils • Geotextiles
Drainage Provisions in Retaining Walls
In selecting filter materials, two conditions shall be kept in mind: The small sphere can move through the void spaces of the larger one Terzaghi and Peck (1948)
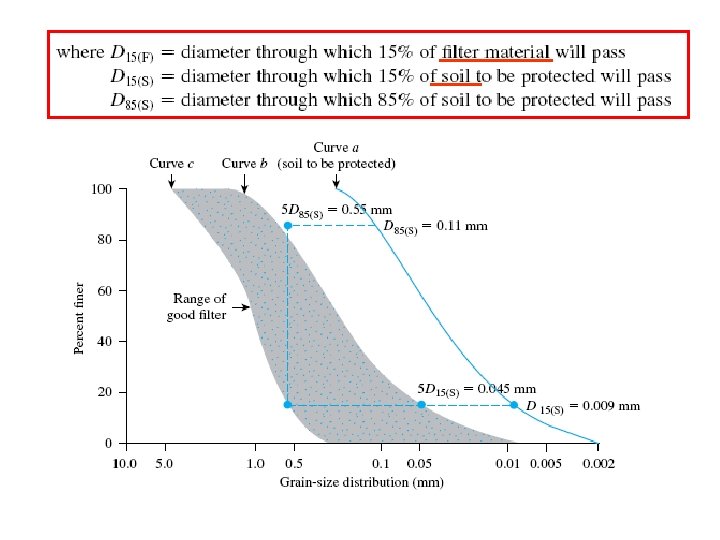
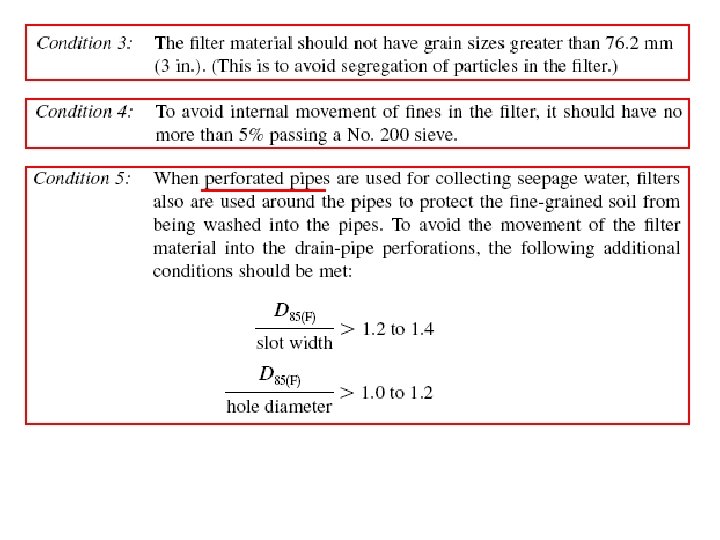
The US Navy (1948) The following conditions are required for the design of filters: