y1 2 4 8 16 32 64 128


![® y=[1, 2, 4, 8, 16, 32, 64, 128]; plot(y)](https://slidetodoc.com/presentation_image/2352750ba28786b793b455ba8b166d8d/image-20.jpg "® y=[1, 2, 4, 8, 16, 32, 64, 128]; plot(y)")
![® y=[0, 1, 2; 3, 4, 5; 6, 7, 8]; plot(y)](https://slidetodoc.com/presentation_image/2352750ba28786b793b455ba8b166d8d/image-21.jpg "® y=[0, 1, 2; 3, 4, 5; 6, 7, 8]; plot(y)")
![® x=[1: 1: 100]; y=[2: 2: 200]; z=x+y. *i; plot(z)](https://slidetodoc.com/presentation_image/2352750ba28786b793b455ba8b166d8d/image-22.jpg "® x=[1: 1: 100]; y=[2: 2: 200]; z=x+y. *i; plot(z)")
绘制双向量 x=0: 0. 1: 10; y=sin(x)+2; plot(x, y)")
 —— 多条曲线绘图格式。 例:x 1=0: 0.")


, '-. rd')")

; y 1=sin(t+0. 25); y 2=sin(t+0. 5); plot(t, y,")
; y 1=sin(t+0. 25); y 2=sin(t+0. 5); y 3=cos(t); y 4=cos(t+0. 25); y")
; y 4=cos(t+0. 25); y 5=cos(t+0. 5); plot(t, y 3); hold on; plot(t,")
 %此时查看x变量")
; y=peaks; plot(x, y)")


; y 1=sin(t+0. 25); y 2=sin(t+0. 5); y 3=cos(t); subplot(1, 3,")
; plot(t, y) subplot(3, 1, 2); plot(t, y 3) subplot(3, 1, 3);")
![income=[3. 2 4. 1 5. 0 5. 6] outgo=[2. 5 4. 0 3. 35](https://slidetodoc.com/presentation_image/2352750ba28786b793b455ba8b166d8d/image-42.jpg "income=[3. 2 4. 1 5. 0 5. 6] outgo=[2. 5 4. 0 3. 35")
![subplot('position', [left bottom width height]) 在由 4个元素指定的位置上创建一坐标轴](https://slidetodoc.com/presentation_image/2352750ba28786b793b455ba8b166d8d/image-43.jpg "subplot('position', [left bottom width height]) 在由 4个元素指定的位置上创建一坐标轴")


; y 2=cos(t); plot(t, y 1, 'r', t, y")


![fplot('[sin(x), tan(x), cos(x)]', 2*pi*[-1 1]) fplot('humps', [0 1], 'rp')](https://slidetodoc.com/presentation_image/2352750ba28786b793b455ba8b166d8d/image-56.jpg "fplot('[sin(x), tan(x), cos(x)]', 2*pi*[-1 1]) fplot('humps', [0 1], 'rp')")
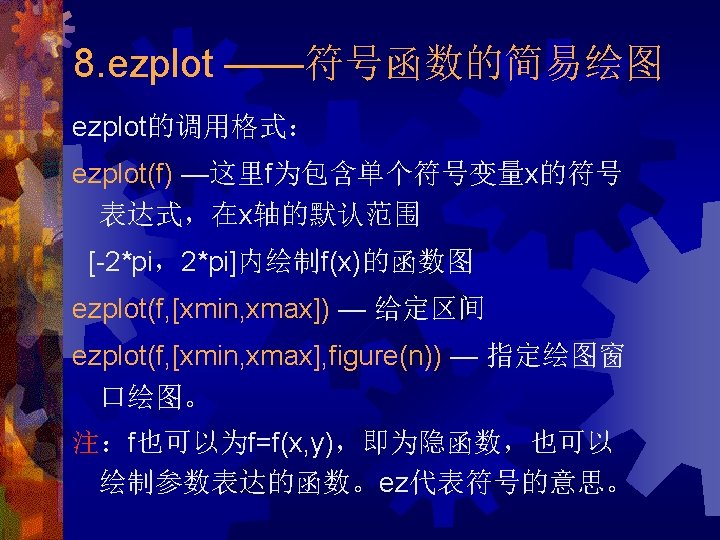
![ezplot('sin(x)') ezplot('sin(x)', 'cos(y)', [-4*pi], figure(2))](https://slidetodoc.com/presentation_image/2352750ba28786b793b455ba8b166d8d/image-58.jpg "ezplot('sin(x)') ezplot('sin(x)', 'cos(y)', [-4*pi], figure(2))")
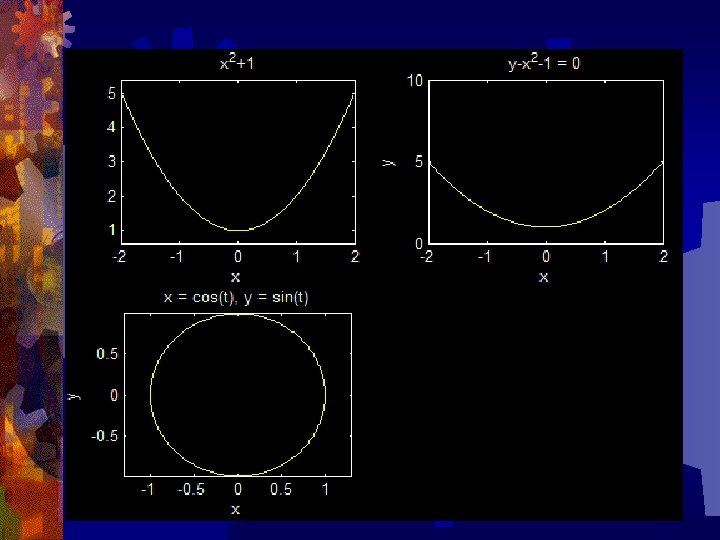
![f=sym('x^2+1'); subplot(2, 2, 1) ezplot(f, [-2, 2]) subplot(2, 2, 2) ezplot('y-x^2 -1', [-2, 2],](https://slidetodoc.com/presentation_image/2352750ba28786b793b455ba8b166d8d/image-59.jpg "f=sym('x^2+1'); subplot(2, 2, 1) ezplot(f, [-2, 2]) subplot(2, 2, 2) ezplot('y-x^2 -1', [-2, 2],")


, cos(t), 'r: ')")
, sin(t), t, 'r: ')")
![例:绘制向量 t=[0: pi/100: 2*pi]; x=[sin(t)]; y=[cos(t) cos(t)]; z=[(sin(t)). ^2+(cos(t)). ^2+1 ]; plot 3(x, y,](https://slidetodoc.com/presentation_image/2352750ba28786b793b455ba8b166d8d/image-71.jpg "例:绘制向量 t=[0: pi/100: 2*pi]; x=[sin(t)]; y=[cos(t) cos(t)]; z=[(sin(t)). ^2+(cos(t)). ^2+1 ]; plot 3(x, y,")
; 0. 8808 0. 0729 0. 4168 0. 7694 0. 3775 0. 4776")

 1 0 0 0 1 0 1 1 1 1 0 0 1")
![例: 8阶hadamard矩阵的网线图 h 2=[1 1; 1 -1]; h 4=[h 2 h 2; h 2](https://slidetodoc.com/presentation_image/2352750ba28786b793b455ba8b166d8d/image-77.jpg "例: 8阶hadamard矩阵的网线图 h 2=[1 1; 1 -1]; h 4=[h 2 h 2; h 2")

![例:x=[0: 0. 1: 5; 2: 0. 1: 7]; mesh(x)](https://slidetodoc.com/presentation_image/2352750ba28786b793b455ba8b166d8d/image-79.jpg "例:x=[0: 0. 1: 5; 2: 0. 1: 7]; mesh(x)")


![surfc(X, Y, Z) — 带等高线的曲面图 [X, Y, Z]=peaks(30); surfc(X, Y, Z)](https://slidetodoc.com/presentation_image/2352750ba28786b793b455ba8b166d8d/image-91.jpg "surfc(X, Y, Z) — 带等高线的曲面图 [X, Y, Z]=peaks(30); surfc(X, Y, Z)")

; y 2=rand(3, 5); y 3=rand(3, 5); fill 3(y 1, y 2,")


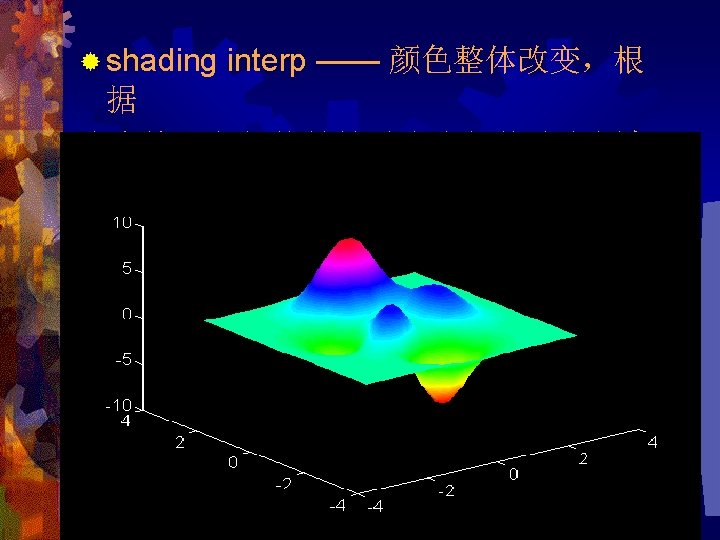
; shading interp; colormap(hot)")
![[X, Y, Z]=peaks(30); surfl(X, Y, Z) shading interp; colormap(cool); axis off](https://slidetodoc.com/presentation_image/2352750ba28786b793b455ba8b166d8d/image-106.jpg "[X, Y, Z]=peaks(30); surfl(X, Y, Z) shading interp; colormap(cool); axis off")
; colormap(hot); colorbar('horiz') figure(2); colormap(cool);")

; mesh(p);hidden on(消隐)")
; mesh(p); hidden off")
=nan*p(30: 40, 20: 30); surf(p)")
=nan*p(30: 40, 20: 30); mesh(peaks, p)")
) az ----方位角;el ---- 俯视角 省缺值为:az=-37. 5; el=30 例:观察不同视角的波峰图形 z=peaks(40); subplot(2, 2,")

 waterfall(peaks(30))")

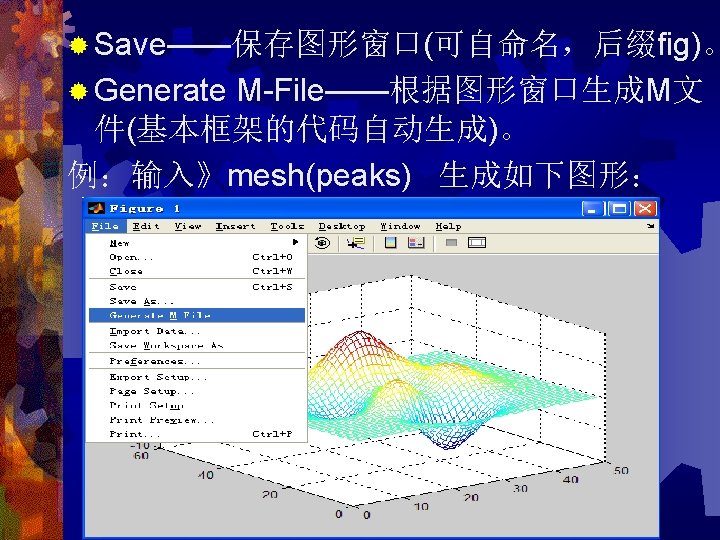
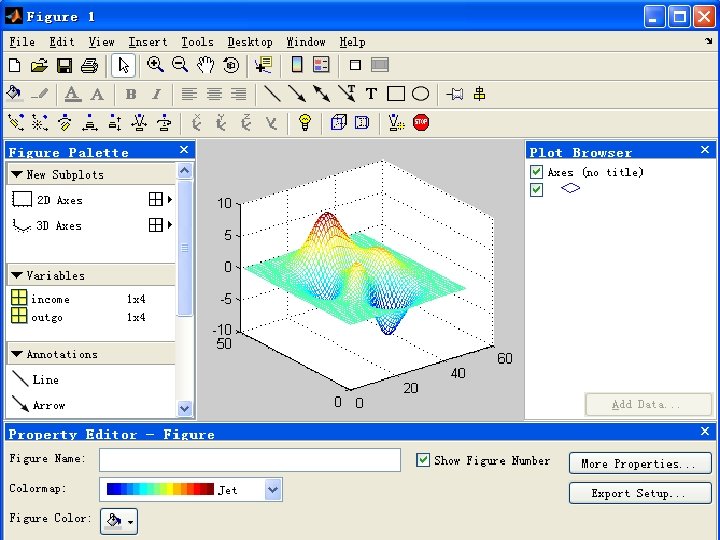
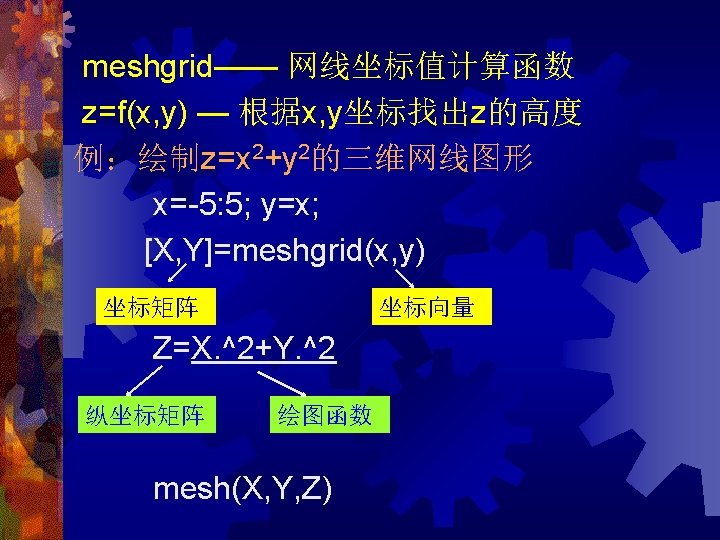
 Demo: demos/…/3 D-surface plots")


; vy = 100*sin(1/4*pi); t = 0: 0. 001: 15; x")


 %产生矩阵 set(gca, 'Nextplot', 'replacechildren') for j=1: 8 plot(fft(eye(j+8))) %eye为单位矩阵,fft为快速傅立叶变换")
![例:图形放大 [x, y] = meshgrid([-1. 05: 0. 2: 3. 75]); z = x. *exp(-x.](https://slidetodoc.com/presentation_image/2352750ba28786b793b455ba8b166d8d/image-129.jpg "例:图形放大 [x, y] = meshgrid([-1. 05: 0. 2: 3. 75]); z = x. *exp(-x.")
; axis tight set(gca, 'nextplot', 'replacechildren'); % Record the")
; for j=1: n x(j+1)=x(j)+2*pi/n; y=sin(x); plot(x,")
; k=0; for t=0: pi/n: 2*pi k=k+1;")
, 'o', 'Marker. Edge. Color',")

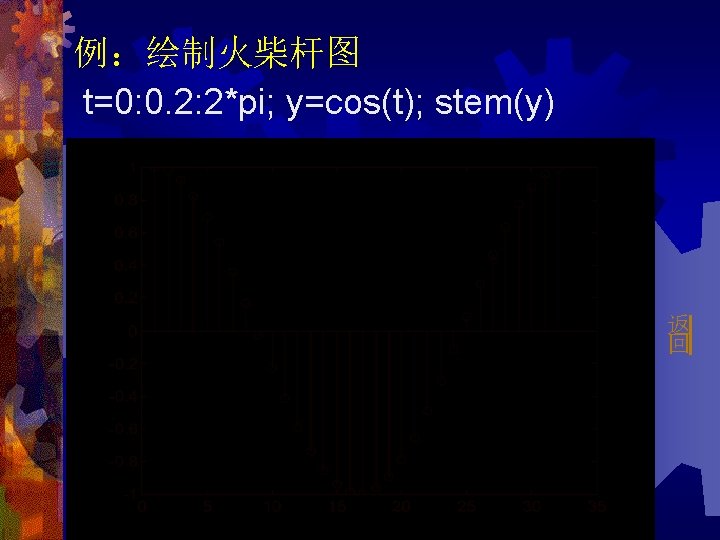
; stairs(x, y)")
![例:阶梯绘图 h 2=[1 1; 1 -1]; h 4=[h 2 h 2; h 2 -h](https://slidetodoc.com/presentation_image/2352750ba28786b793b455ba8b166d8d/image-143.jpg "例:阶梯绘图 h 2=[1 1; 1 -1]; h 4=[h 2 h 2; h 2 -h")
![h 2=[1 1; 1 -1]; h 4=[h 2 h 2; h 2 -h 2];](https://slidetodoc.com/presentation_image/2352750ba28786b793b455ba8b166d8d/image-144.jpg "h 2=[1 1; 1 -1]; h 4=[h 2 h 2; h 2 -h 2];")
)-sin(tan(t)); comet(t, y) 返 回")

 返 回")
")
; b=rand(200, 1); c=rand(200, 1); scatter(a, b, 100, c, 'p') 返 回")
- Slides: 152
® y=[1, 2, 4, 8, 16, 32, 64, 128]; plot(y)
® y=[0, 1, 2; 3, 4, 5; 6, 7, 8]; plot(y)
® x=[1: 1: 100]; y=[2: 2: 200]; z=x+y. *i; plot(z)
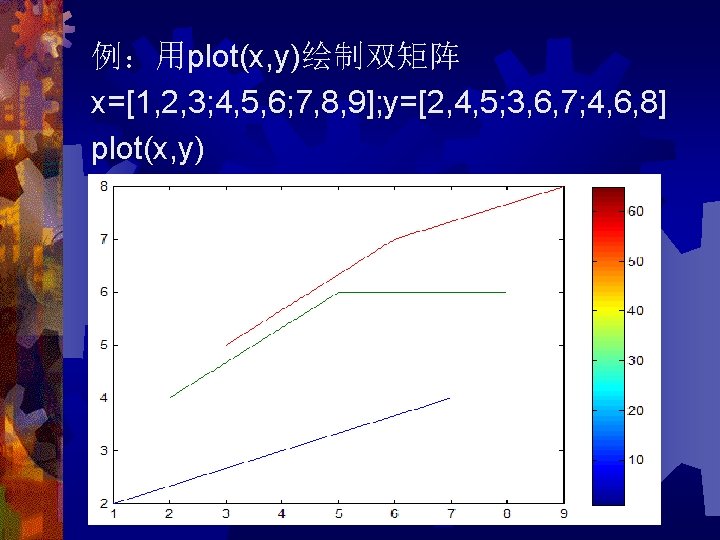
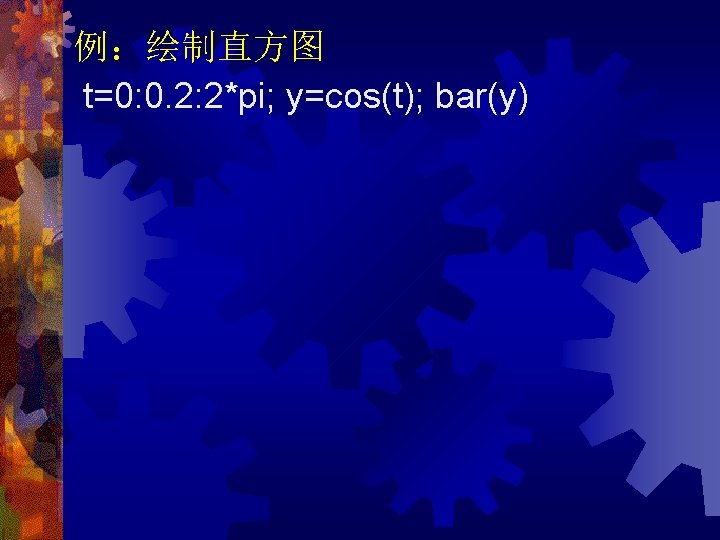
例:用plot(x, y)绘制双向量 x=0: 0. 1: 10; y=sin(x)+2; plot(x, y)
® plot(x 1, y 1, x 2, y 2…) —— 多条曲线绘图格式。 例:x 1=0: 0. 1: 10; y 1=sin(x 1); x 2=0: 0. 1: 10; y 2=cos(x 2); x 3=0: 0. 1: 10; y 3=sin(x 3)+cos(x 3); plot(x 1, y 1, x 2, y 2, x 3, y 3)
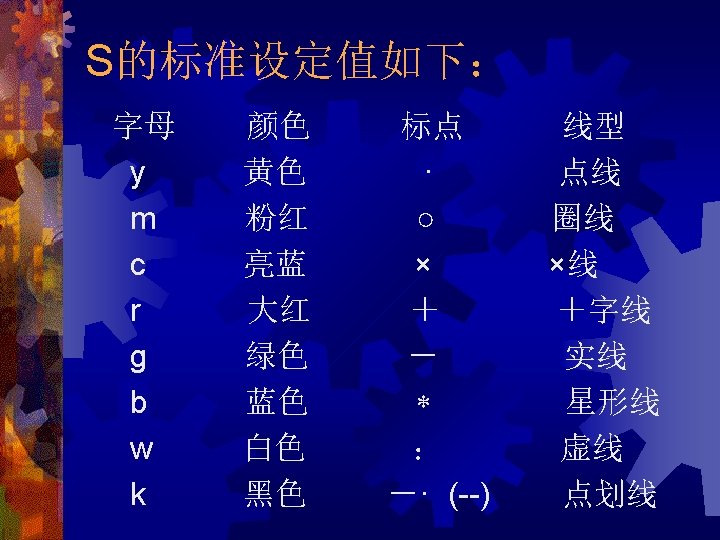
matlab 7. 1线形: [ + | o | * |. | x | square | diamond | v | ^ | > | < | pentagram | hexagram ] square 正方形 diamond 菱形 pentagram 五角星 hexagram 六角星 Demo: demos/matlab/graphics/line plotting
例:plot(x, sin(x), '-. rd')
2. 单窗口多曲线绘图 例2:t=0: pi/100: 2*pi; y=sin(t); y 1=sin(t+0. 25); y 2=sin(t+0. 5); plot(t, y, t, y 1, t, y 2) y y 1 y 2
例 3:y=sin(t); y 1=sin(t+0. 25); y 2=sin(t+0. 5); y 3=cos(t); y 4=cos(t+0. 25); y 5=cos(t+0. 5); plot(t, [y', y 1', y 2', y 3', y 4', y 5'])
y 3=cos(t); y 4=cos(t+0. 25); y 5=cos(t+0. 5); plot(t, y 3); hold on; plot(t, y 4); plot(t, y 5);
x=peaks; plot(x) %此时查看x变量
® x=1: length(peaks); y=peaks; plot(x, y)
t=0: pi/100: 2*pi; y=sin(t); y 1=sin(t+0. 25); y 2=sin(t+0. 5); y 3=cos(t); subplot(1, 3, 1); plot(t, y) subplot(1, 3, 2); plot(t, y 3) subplot(1, 3, 3); plot(t, y 2)
subplot(3, 1, 1); plot(t, y) subplot(3, 1, 2); plot(t, y 3) subplot(3, 1, 3); plot(t, y 2)
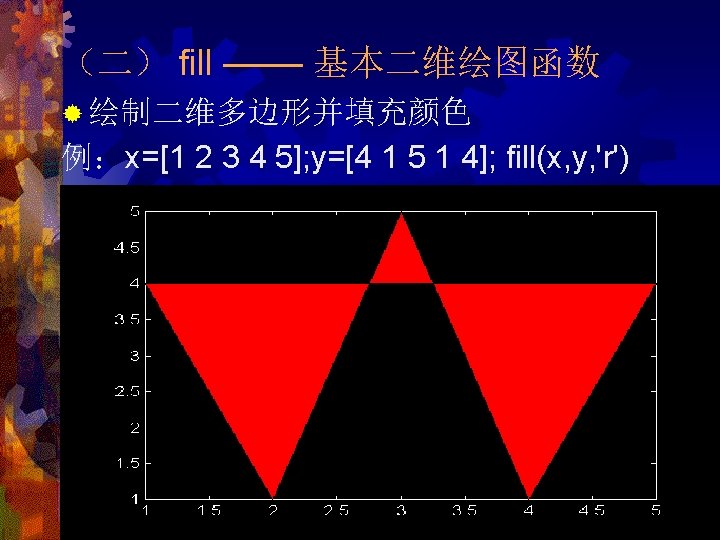
income=[3. 2 4. 1 5. 0 5. 6] outgo=[2. 5 4. 0 3. 35 4. 9] subplot(2, 1, 1), plot(income) subplot(2, 1, 2), plot(outgo)
subplot('position', [left bottom width height]) 在由 4个元素指定的位置上创建一坐标轴
例:t=0: 0. 1: 10 y 1=sin(t); y 2=cos(t); plot(t, y 1, 'r', t, y 2, 'b--'); x=[1. 7*pi; 1. 6*pi]; y=[-0. 3; 0. 8]; s=['sin(t)'; 'cos(t)']; text(x, y, s); title('正弦和余弦曲线'); legend('正弦', '余弦') xlabel('时间t'), ylabel('正弦、余弦') grid axis square
2 4 6 时间t 8 10
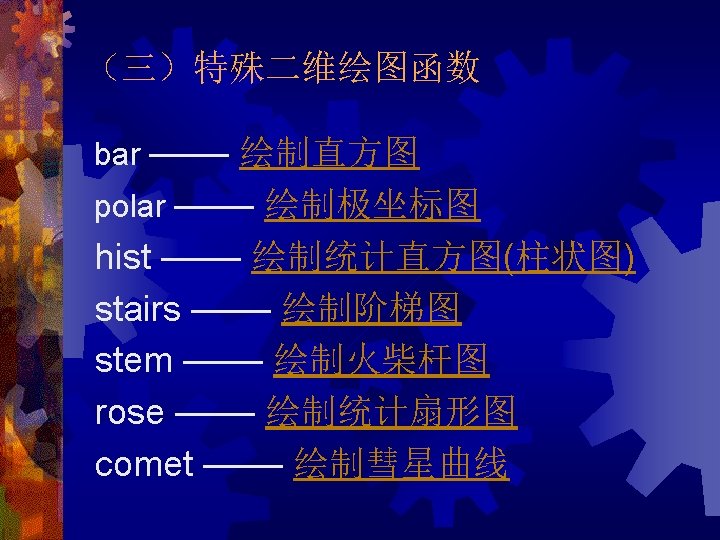
fplot('[sin(x), tan(x), cos(x)]', 2*pi*[-1 1]) fplot('humps', [0 1], 'rp')
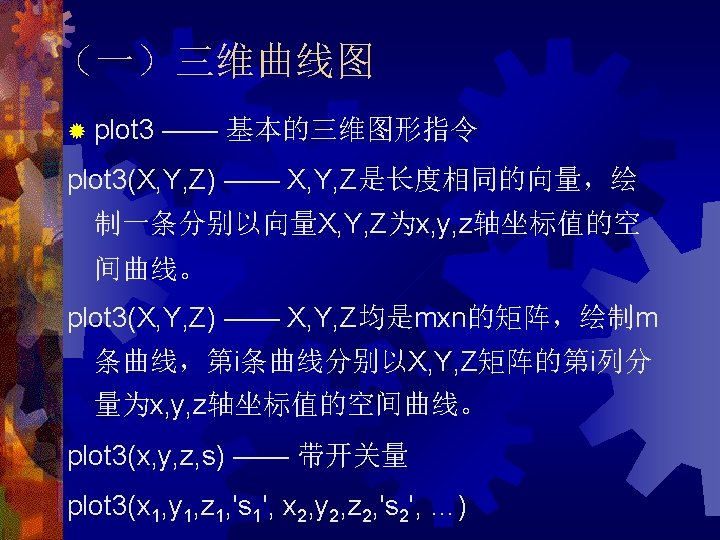
ezplot('sin(x)') ezplot('sin(x)', 'cos(y)', [-4*pi], figure(2))
f=sym('x^2+1'); subplot(2, 2, 1) ezplot(f, [-2, 2]) subplot(2, 2, 2) ezplot('y-x^2 -1', [-2, 2], [0, 10]) x=sym('cos(t)'); y=sym('sin(t)'); subplot(2, 2, 3) ezplot(x, y)
例:绘制三维曲线图 t=0: pi/50: 10*pi; plot 3(t, sin(t), cos(t), 'r: ')
例:绘制三维螺旋线 t=0: pi/50: 10*pi; plot 3(cos(t), sin(t), t, 'r: ')
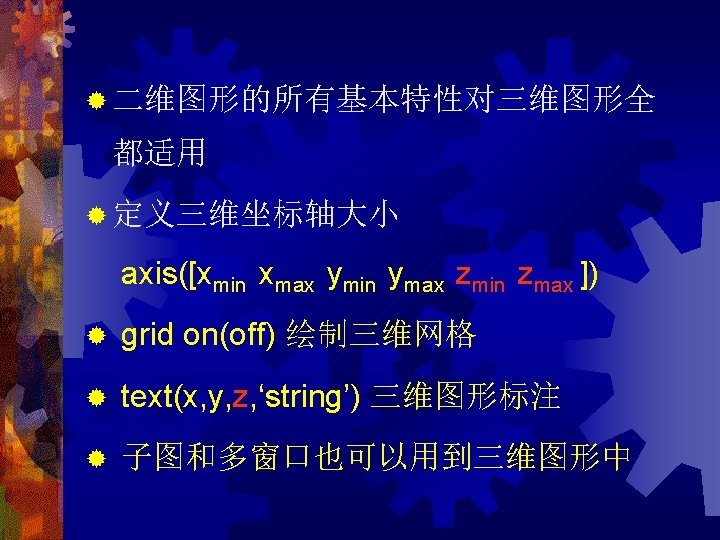
例:绘制向量 t=[0: pi/100: 2*pi]; x=[sin(t)]; y=[cos(t) cos(t)]; z=[(sin(t)). ^2+(cos(t)). ^2+1 ]; plot 3(x, y, z, 'r: ')
例:矩阵的三维网格图 z=rand(6); 0. 8808 0. 0729 0. 4168 0. 7694 0. 3775 0. 4776 0. 3381 0. 7101 0. 0964 0. 6352 0. 3826 0. 7086 0. 1895 0. 8791 0. 6747 0. 8965 0. 6876 0. 2380 0. 7431 0. 3594 0. 5626 0. 8784 0. 1217 0. 3910 0. 7189 0. 0899 0. 8130 0. 4865 0. 0768 0. 9759 0. 8792 0. 1610 0. 8782 0. 1131 0. 1433 0. 6288 mesh(z)
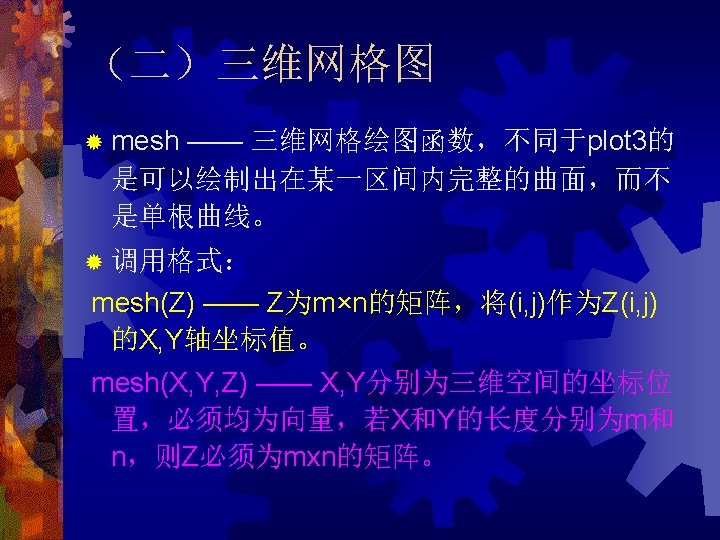
z=round(z) 1 0 0 0 1 0 1 1 1 1 0 0 1 0 0 1 mesh(z)
例: 8阶hadamard矩阵的网线图 h 2=[1 1; 1 -1]; h 4=[h 2 h 2; h 2 -h 2] h 8=[h 4 h 4; h 4 -h 4] 1 1 1 1 1 -1 1 1 -1 -1 1 -1 -1 1 1 1 -1 -1 1 -1 1 1 -1 mesh(h 8)
例:x=[0: 0. 1: 5; 2: 0. 1: 7]; mesh(x)
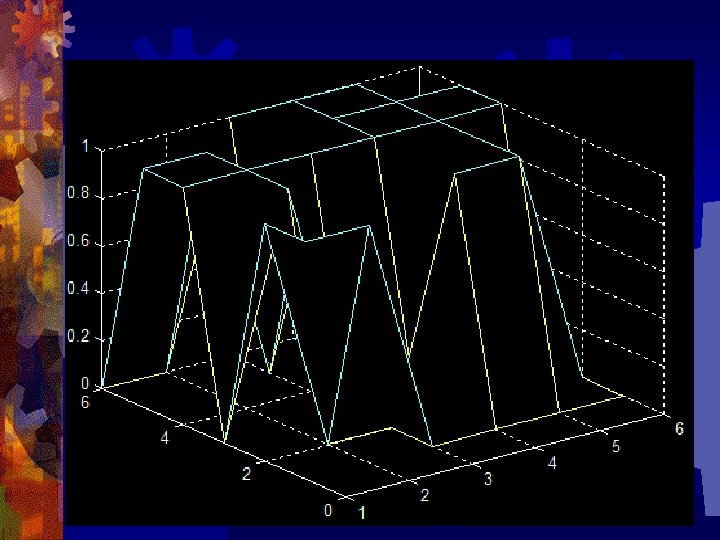
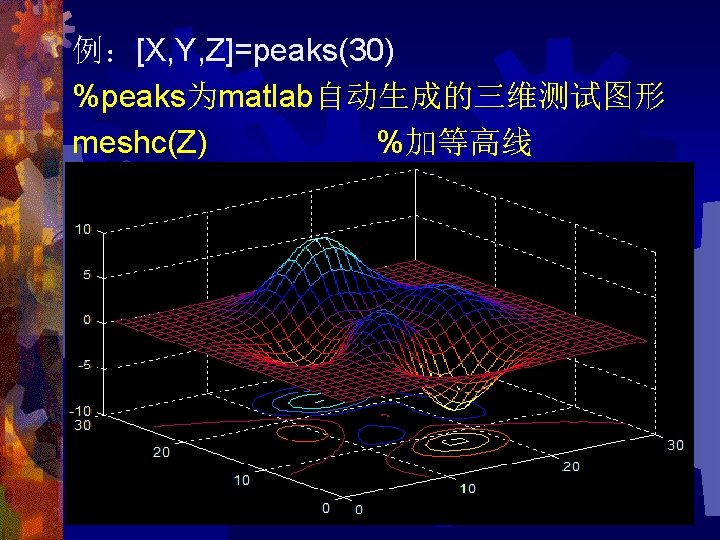
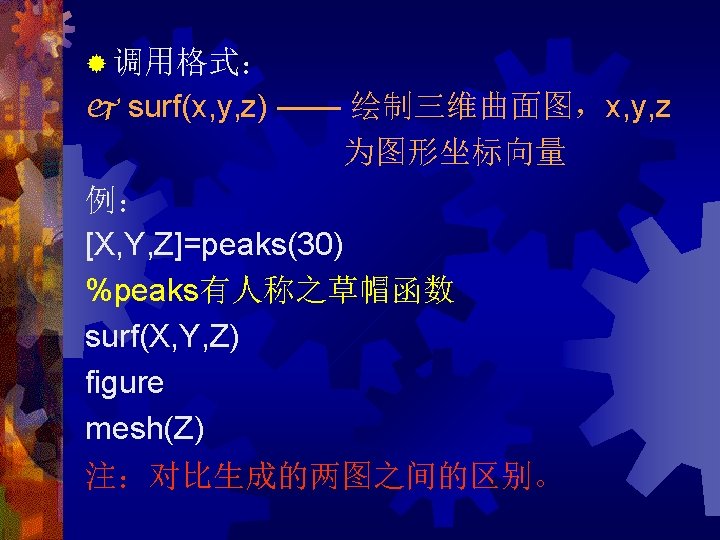
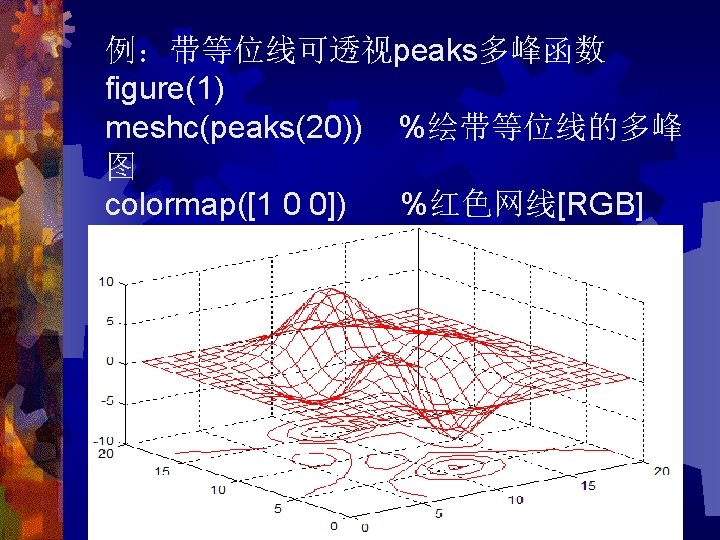
surfc(X, Y, Z) — 带等高线的曲面图 [X, Y, Z]=peaks(30); surfc(X, Y, Z)
y 1=rand(3, 5); y 2=rand(3, 5); y 3=rand(3, 5); fill 3(y 1, y 2, y 3, 'm'); hold on; plot 3(y 1, y 2, y 3, 'yo')
peaks(30); shading interp; colormap(hot)
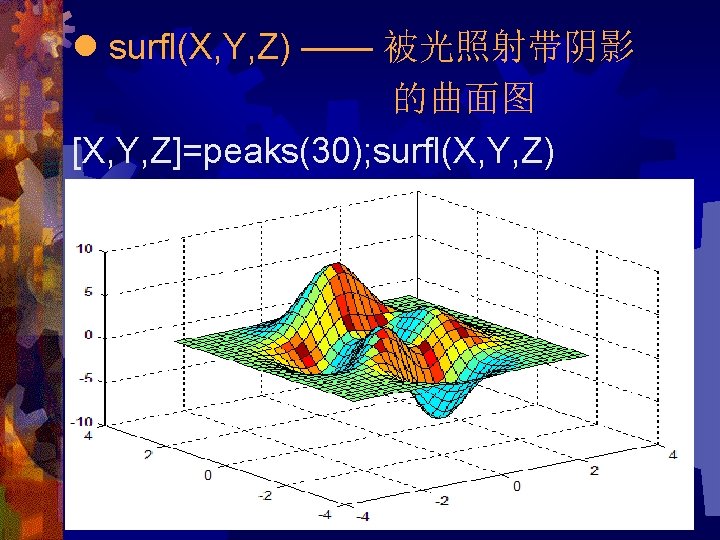
[X, Y, Z]=peaks(30); surfl(X, Y, Z) shading interp; colormap(cool); axis off
peaks(30); colormap(hot); colorbar('horiz') figure(2); colormap(cool);
® 透视与消隐 p=peaks(30); mesh(p);hidden on(消隐)
p=peaks(30); mesh(p); hidden off
® 裁减修饰 p=peaks; p(30: 40, 20: 30)=nan*p(30: 40, 20: 30); surf(p)
p=peaks; p(30: 40, 20: 30)=nan*p(30: 40, 20: 30); mesh(peaks, p)
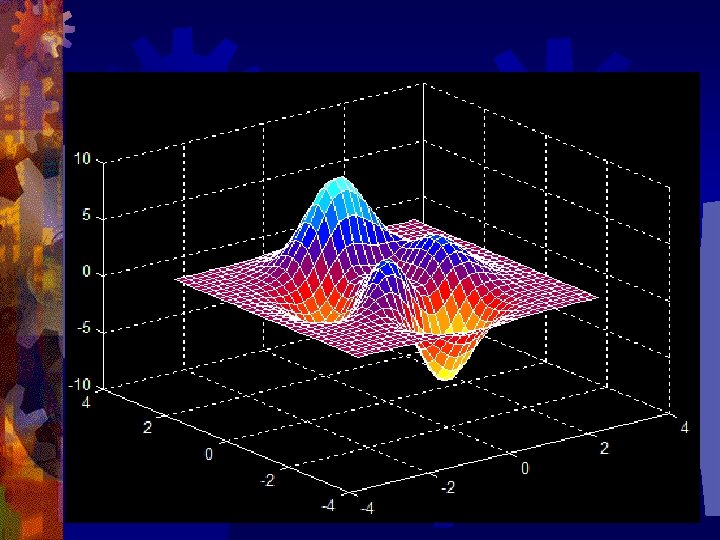
® 视角修饰(函数view(az, el)) az ----方位角;el ---- 俯视角 省缺值为:az=-37. 5; el=30 例:观察不同视角的波峰图形 z=peaks(40); subplot(2, 2, 1); mesh(z); subplot(2, 2, 2); mesh(z); view(-15, 60); subplot(2, 2, 3); mesh(z); view(-90, 0); subplot(2, 2, 4); mesh(z); view(-7, -10);
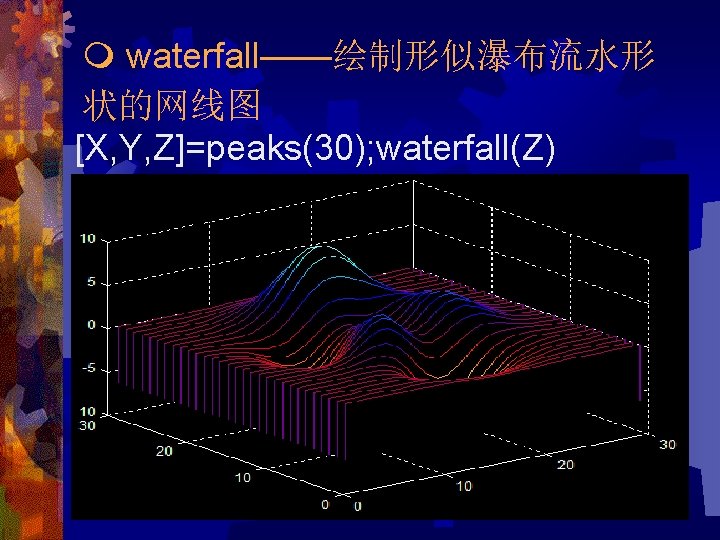
® 其它修饰: a. 水线修饰(waterfall) waterfall(peaks(30))
contour 3(peaks, 20) Demo: demos/…/3 D-surface plots
模拟平抛运动 vx = 40; t = 0: 0. 001: 10; x = vx*t; y = -9. 8*t. ^2/2; comet(x, y, 0. 22)
模拟导弹发射 vx = 100*cos(1/4*pi); vy = 100*sin(1/4*pi); t = 0: 0. 001: 15; x = vx*t; y = vy*t-9. 8*t. ^2/2; comet(x, y)
例: axis equal %坐标相同 M=moviein(8) %产生矩阵 set(gca, 'Nextplot', 'replacechildren') for j=1: 8 plot(fft(eye(j+8))) %eye为单位矩阵,fft为快速傅立叶变换 M(: , j)=getframe; end movie(M, 2, 1) %M为播放对象,2为播放次 数,1为每秒播放的帧数,默认为 12
例:图形放大 [x, y] = meshgrid([-1. 05: 0. 2: 3. 75]); z = x. *exp(-x. ^2 -y. ^2); axis tight; %axis limits to the range of the data set(gca, 'nextplot', 'replacechildren'); for j = 1: 40 surf(x*sin(pi*j/100), y*sin(pi*j/100), z*sin(pi*j/100)); m(j) = getframe end movie(m)
例:仿vibrating logo Z = peaks; surf(Z); axis tight set(gca, 'nextplot', 'replacechildren'); % Record the movie for j = 1: 20 surf(sin(2*pi*j/20)*Z, Z) F(j) = getframe; end % Play the movie twenty times movie(F, 20)
例:动态加星曲线 clc; clear; x=0; n=40; %set(gca, 'nextplot', 'replacechildren'); for j=1: n x(j+1)=x(j)+2*pi/n; y=sin(x); plot(x, y, '*-'), axis([0 2*pi -1 1]), grid on M(j) = getframe; end movie(M)
例:一球绕一曲线前进 clc; clear; n=100; x=0: pi/n: 2*pi y=sin(x); k=0; for t=0: pi/n: 2*pi k=k+1; x(k)=t y(k)=sin(t); m=plot(x, y, x(k), y(k), 'or') grid getframe; end
例:旋转红点 x = -pi: pi/30: pi; h = plot(x, cos(x), 'o', 'Marker. Edge. Color', 'k', 'Marker. F ace. Color', 'Marker. Size', 8, 'Erase. Mode', 'Xor') for j = 1: 10000 y = 1/2*sin(3*x+0. 006*j); set(h, 'ydata', y); drawnow; end
Y=[5 2 1; 8 7 3; 9 8 6; 5 5 4; 4 3 2]; subplot(2, 2, 1) bar(Y) box off subplot(2, 2, 2) bar 3(Y) %三维垂直条图 subplot(2, 2, 3) barh(Y) %二维水平条图 subplot(2, 2, 4) bar 3 h(Y) %三维水平条图
例:绘制阶梯曲线 x=0: pi/20: 2*pi; y=sin(x); stairs(x, y)
例:阶梯绘图 h 2=[1 1; 1 -1]; h 4=[h 2 h 2; h 2 -h 2]; h 8=[h 4 h 4; h 4 -h 4]; t=1: 8; subplot(8, 1, 1); stairs(t, h 8(1, : )); axis('off') subplot(8, 1, 2); stairs(t, h 8(2, : )); axis('off') subplot(8, 1, 3); stairs(t, h 8(3, : )); axis('off') subplot(8, 1, 4); stairs(t, h 8(4, : )); axis('off') subplot(8, 1, 5); stairs(t, h 8(5, : )); axis('off') subplot(8, 1, 6); stairs(t, h 8(6, : )); axis('off') subplot(8, 1, 7); stairs(t, h 8(7, : )); axis('off') subplot(8, 1, 8); stairs(t, h 8(8, : )); axis('off')
h 2=[1 1; 1 -1]; h 4=[h 2 h 2; h 2 -h 2]; h 8=[h 4 h 4; h 4 -h 4]; t=1: 8; for i=1: 8 subplot(8, 1, i); stairs(t, h 8(i, : )) axis('off') end 返回
例:绘制彗星曲线图 t= -pi: pi/500: pi; y=tan(sin(t))-sin(tan(t)); comet(t, y) 返 回
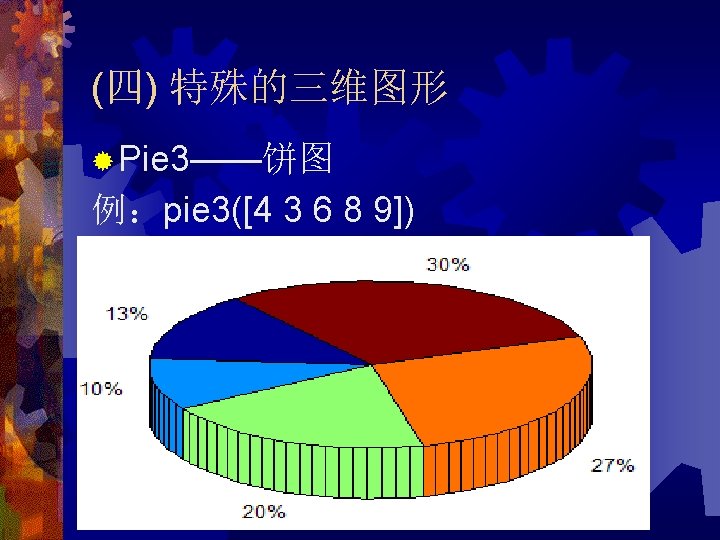
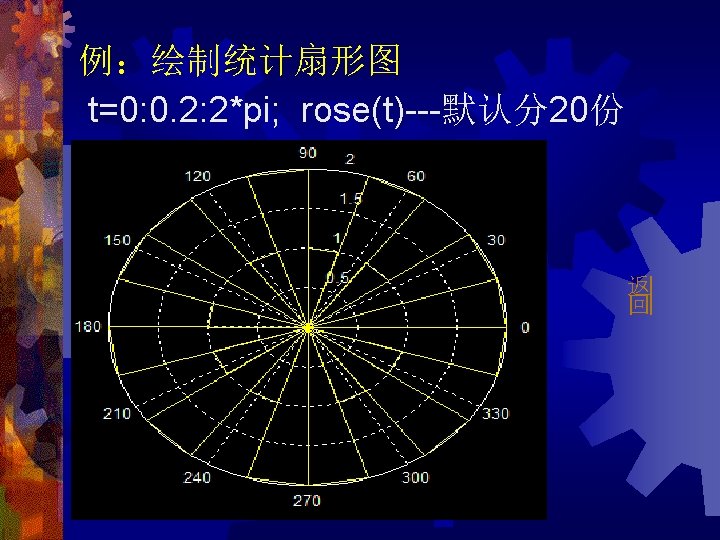
pie(x, y, {'North', 'South', 'East', 'West', 'middle', 'fa', 'white'}) 返 回
例:绘制离散点图 load seamount ——海山 scatter(x, y, 50, z)
a=rand(200, 1); b=rand(200, 1); c=rand(200, 1); scatter(a, b, 100, c, 'p') 返 回