Working Capital Management Alternative working capital policies Cash


 Current Quick Debt/Assets Turnover of cash DSO (365")


 Payables CCC = Days per year + Days sales")


 January Cash at start if no borrowing $ 3, 000. 00")
^1/2")


 is considerably")


 Yearly Holding Cost + Yearly Ordering Cost * “Relevant” because")
")


- Slides: 46
Working Capital Management Alternative working capital policies Cash, inventory, and A/R management Accounts payable management Short-term financing policies Bank debt
Strategic • Corporate Strategy • Business Strategy • Functional Strategy Financial • Selecting Investments • Raising the capital • Working Capital Management • Dividend Policy • Risk-hedging techniques Corporate Governance • Actions and policy of senior management • Performance measurement • Compensation systems • Investor communications
Basic Definitions • Gross working capital: Total current assets. • Net working capital: Current assets - Current liabilities. • Net operating working capital (NOWC): Operating CA – Operating CL = (Cash + Inv. + A/R) – (Accruals + A/P) (More…)
• Working capital management: Includes both establishing working capital policy and then the day-to-day control of cash, inventories, receivables, accruals, and accounts payable. • Working capital policy: • The level of each current asset. • How current assets are financed.
Selected Ratios for Stark’s Industry (STI) Current Quick Debt/Assets Turnover of cash DSO (365 -day basis) Inv. turnover F. A. turnover T. A. turnover Profit margin ROE Payables deferral STI 1. 75 x 0. 83 x 58. 76% 16. 67 x 45. 63 4. 82 x 11. 35 x 2. 08 x 2. 07% 10. 45% 30. 00 IND AVG 2. 25 x 1. 20 x 50. 00% 22. 22 x 32. 00 7. 00 x 12. 00 x 3. 50% 21. 00% 33. 00
How does STI’s working capital policy compare with the industry? • Working capital policy is reflected in a firm’s current ratio, quick ratio, turnover of cash and securities, inventory turnover, and DSO. • These ratios indicate STI has large amounts of working capital relative to its level of sales. Thus, STI is following a relaxed policy.
Is STI inefficient or just conservative? • A relaxed policy may be appropriate if it reduces risk more than profitability. • However, STI is much less profitable than the average firm in the industry. This suggests that the company probably has excessive working capital.
Cash Conversion Cycle The cash conversion cycle focuses on the time between payments made for materials and labor and payments received from sales: Cash Inventory Receivables Payables conversion = conversion + collection - deferral. cycle period
“How well a company efficiently manages noncash working capital”
Cash Conversion Cycle (Cont. ) Payables CCC = Days per year + Days sales – deferral Inv. turnover outstanding period 365 CCC = + 45. 6 – 30 4. 82 CCC = 75. 7 + 45. 6 – 30 CCC = 91. 3 days.
Cash Management: Cash doesn’t earn interest, so why hold it? n Transactions: Must have some cash to pay current bills. n Precaution: “Safety stock. ” But lessened by credit line and marketable securities. n Compensating balances: For loans and/or services provided. n Speculation: To take advantage of bargains, to take discounts, and so on. Reduced by credit line, marketable securities.
What’s the goal of cash management? • To have sufficient cash on hand to meet the needs listed on the previous slide. • However, since cash is a non-earning asset, to have not one dollar more.
• Increase forecast accuracy to reduce the need for a cash “safety stock. ” • Hold marketable securities instead of a cash “safety stock. ” • Negotiate a line of credit (also reduces need for a “safety stock”).
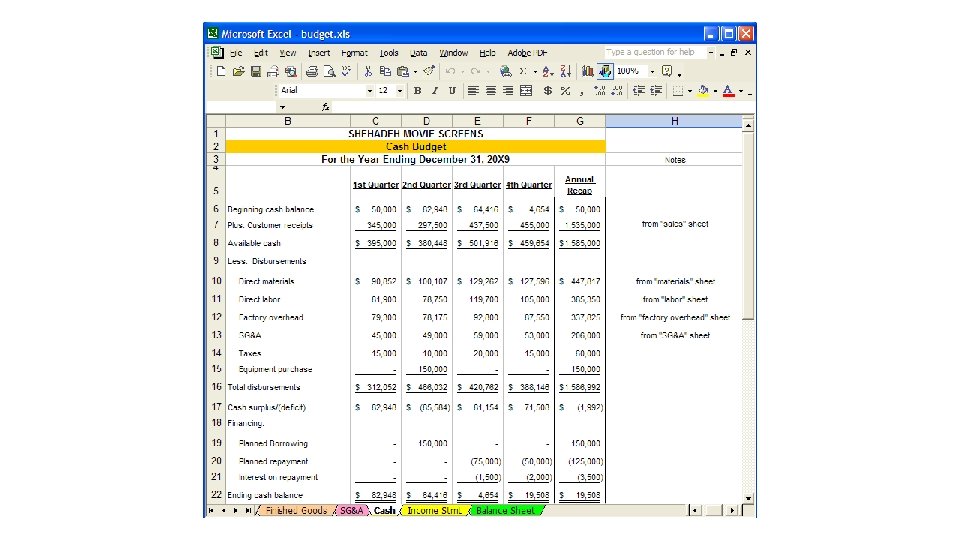
Cash Budget: The Primary Cash Management Tool • Purpose: Uses forecasts of cash inflows, outflows, and ending cash balances to predict loan needs and funds available for temporary investment. • Timing: Daily, weekly, or monthly, depending upon budget’s purpose. Monthly for annual planning, daily for actual cash management.
Data Required for Cash Budget 1. Sales forecast. 2. Information on collections delay. 3. Forecast of purchases and payment terms. 4. Forecast of cash expenses: wages, taxes, utilities, and so on. 5. Initial cash on hand. 6. Target cash balance.
STI’s Cash Budget for January and February Net Cash Inflows January February Collections $67, 651. 95 $62, 755. 40 Purchases 44, 603. 7536, 472. 65 Wages 6, 690. 56 5, 470. 90 Rent 2, 500. 00 Total payments $53, 794. 31 $44, 443. 55 Net CF $13, 857. 64 $18, 311. 85
Cash Budget (Continued) January Cash at start if no borrowing $ 3, 000. 00 $16, 857. 64 Net CF (p slide ) 13, 857. 64 18, 311. 85 Cumulative cash $16, 857. 64 $35, 169. 49 Less: target cash 1, 500. 00 February
How much should be the optimal cash? • Baumol Model: C = (2 FT/k)^1/2 Where, C = The optimal amount of cash you should hold F = Cost of providing cash (e. g. , from transactions) T = Demand of cash for a given period k = Opportunity cost or interest rate
Example • Manager of AA corp. forecasts the needs of cash for the next month $900, 000. The cost of converting marketable security to be cash is $500 in average. The rate of return is 12% per year. Calculate the optimal level of cash.
The minimum amount of cash 1. Compensating balances (a deposit held by a bank to compensate it for providing services) + 2. Precautionary balances (money held for emergency purposes) + 3. Transaction balances (money need to cover checks outstanding)
So. . Target cash = Optimal cash + Min cash Optimal Level Of cash Re-order point Plus Min level of cash Lead Time If you have cash more than the target , what should you do?
Should depreciation be explicitly included in the cash budget? • No. Depreciation is a noncash charge. Only cash payments and receipts appear on cash budget. • However, depreciation does affect taxes, which do appear in the cash budget.
STI’s forecasted cash budget indicates that the company’s cash holdings will exceed the targeted cash balance every month, except for October and November. • Cash budget indicates the company probably is holding too much cash. • STI could improve its EVA by either investing its excess cash in more productive assets or by paying it out to the firm’s shareholders.
Inventory Management
Inventory Management: Categories of Inventory Costs • Carrying Costs: Storage and handling costs, insurance, property taxes, depreciation, and obsolescence. • Ordering Costs: Cost of placing orders, shipping, and handling costs. • Costs of Running Short: Loss of sales, loss of customer goodwill, and the disruption of production schedules.
Is STI holding too much inventory? • STI’s inventory turnover (4. 82) is considerably lower than the industry average (7. 00). The firm is carrying a lot of inventory per dollar of sales. • By holding excessive inventory, the firm is increasing its operating costs which reduces its NOPAT. Moreover, the excess inventory must be financed, so EVA is further lowered.
If STI reduces its inventory, without adversely affecting sales, what effect will this have on its cash position? • Short run: Cash will increase as inventory purchases decline. • Long run: Company is likely to then take steps to reduce its cash holdings.
What Would Holding and Ordering Costs Look Like for the Years? EOQ Re-order point Lead Time A = Demand for the year Cp = Cost to place a single order Ch = Cost to hold one unit inventory for a year Plus safety factor Like 3 x demand Per day
Total Relevant* Cost (TRC) Yearly Holding Cost + Yearly Ordering Cost * “Relevant” because they are affected by the order quantity Q
Economic Order Quantity (EOQ)
EOQ Formula
Example Pam runs a mail-order business for gym equipment. Annual demand for the Trico. Flexers is 16, 000. The annual holding cost per unit is $2. 50 and the cost to place an order is $50. What is the economic order quantity?
Account Receivable Management
Accounts Receivable Management: Do STI’s customers pay more or less promptly than those of its competitors? • STI’s days’ sales outstanding (DSO) of 45. 6 days is well above the industry average (32 days). • STI’s customers are paying less promptly. • STI should consider tightening its credit policy to reduce its DSO.
Does STI face any risk if it tightens its credit policy? YES! A tighter credit policy may discourage sales. Some customers may choose to go elsewhere if they are pressured to pay their bills sooner.
If STI succeeds in reducing DSO without adversely affecting sales, what effect would this have on its cash position? • Short run: If customers pay sooner, this increases cash holdings. • Long run: Over time, the company would hopefully invest the cash in more productive assets, or pay it out to shareholders. Both of these actions would increase EVA.
What is trade credit? • Trade credit is credit furnished by a firm’s suppliers. • Trade credit is often the largest source of shortterm credit, especially for small firms. • Spontaneous, easy to get, but cost can be high.
Nominal Cost Formula, 1/10, net 40 Pays 1. 01% 12. 167 times per year.
Effective Annual Rate, 1/10, net 40 Periodic rate = 0. 01/0. 99 = 1. 01%. Periods/year = 365/(40 – 10) = 12. 1667. EAR = (1 + Periodic rate)n – 1. 0 = (1. 0101)12. 1667 – 1. 0 = 13. 01%.
Working Capital Financing Policies • Moderate: Match the maturity of the assets with the maturity of the financing. • Aggressive: Use short-term financing to finance permanent assets. • Conservative: Use permanent capital for permanent assets and temporary assets.
Moderate Financing Policy $ Temp. NOWC } Perm NOWC S-T Loans L-T Fin: Stock & Bonds, Fixed Assets Years Lower dashed line, more aggressive.
Conservative Financing Policy $ Marketable Securities Zero S-T debt Perm NOWC L-T Fin: Stock & Bonds Fixed Assets Years
What are the advantages of short-term debt vs. long-term debt? • Low cost-- yield curve usually slopes upward. • Can get funds relatively quickly. • Can repay without penalty.
What are the disadvantages of short-term debt vs. long-term debt? • Higher risk. The required repayment comes quicker, and the company may have trouble rolling over loans.
Treat suppliers as you would like customers to treat you. Far greater cash flow benefits can be realized by strategically leveraging your relationship with suppliers and customers. A supplier is more likely to support you in the case of emergency if you have treated them fairly, and, likewise, a customer will be willing to forgive a mistake if you have a strong working relationship