Watershed Delineation and Characteristics on Alaskas North Slope


 –")


 Site 40 m 100 m % difference 5000 FAC 1500 FAC Colville")
")

 10% 0% 0% 00 13 00 15 00 17 00 19")


- Slides: 29
Watershed Delineation and Characteristics on Alaska’s North Slope Matt Khosh University of Texas at Austin Department of Marne Science
Arctic Ecosystems • Prevailing cold and wet climate promotes long -term storage of atmospheric CO 2 • Large pools of stored organic matter • In the context of climate change…? ? ?
Climate Change
Climate Change
Arctic Rivers • High amounts of organic matter – DOM (dissolved organic matter) – Carbon and Nitrogen • Sites of Biogeochemical transformations – Organic matter conduits – System loss pathways • Organic matter dynamics and how it will be affected ? ? ?
Study Area • “North Slope” • Above the Arctic Circle • Soil frozen most of the year – “active layer”
Arctic Rivers 6/18/2009 5/21/2009
Study Area • Sampling Sites – 3 Mountain – 3 Tundra • Watershed area ?
Study Sites
DEM approx. Stream delineation 40 m x 40 m value = 5000 cells
100 m DEM Stream delineation = 1500
Area (km²) Site 40 m 100 m % difference 5000 FAC 1500 FAC Colville 58, 587 58, 728 -0. 24% Kuparuk 8, 884 8, 811 0. 82% Sagavanirktok 12, 679 12, 592 0. 69%
Mackey (1996)
Watershed Attributes • Topographic Primary Attributes – Computed directly from the DEM • Slope • Aspect • Plan and profile curvature • Flow path length • Upslope contributing area • Flow direction
0 elevation (m) 10% 0% 0% 00 13 00 15 00 17 00 19 00 21 00 23 00 25 00 20% 0 Colville 11 20% 0 30% 90 30% 0 40% 70 40% 0 50% 50 50% 30 0 10 0 90 0 11 00 13 00 15 00 17 00 19 00 21 00 23 00 25 00 70 0 50 0 30 10 0 0 50 0 70 0 90 0 11 00 13 00 15 00 17 00 19 00 21 00 23 00 25 00 30 10 Sagavanirktok 50% 40% 30% 20% 10% 0% elevation (m) Kuparuk elevation (m)
Sagavanirktok 100% 80% 60% 40% 20% 0% 5 10 Colville 100% 80% 60% 40% 20% 0% 0% 10 15 20 25 Slope (%) 30 35 40 Kuparuk 100% 5 15 30 35 40 5 10 15 20 25 Slope (%)
Sagavanirktok 100% 80% 60% 40% 20% 0% 2 4 6 Colville 100% 80% 60% 40% 20% 0% 0% 4 6 8 10 12 14 16 18 20 20+ Slope (%) Kuparuk 100% 2 8 2 4 6 8 10 12 14 16 18 20 20+ Slope (%)
Sagavanirktok 15% 12% 9% 6% 3% 0% flat 30 60 90 120150180210240270300330360 Aspect (deg. from North) Colville Kuparuk 15% 12% 9% 9% 6% 6% 3% 3% 0% 0% flat 30 60 90 120150180210240270300330360 Aspect (deg. from North)
Watershed Attributes • Secondary/Compound Attributes – Computed from a combination of primary attributes – Physically based or empirically derived indices – Characterize landscape spatial variability of specific processes
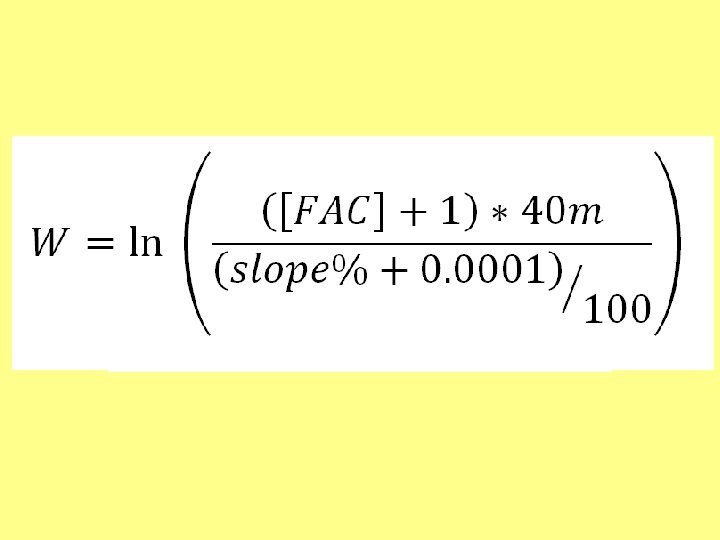
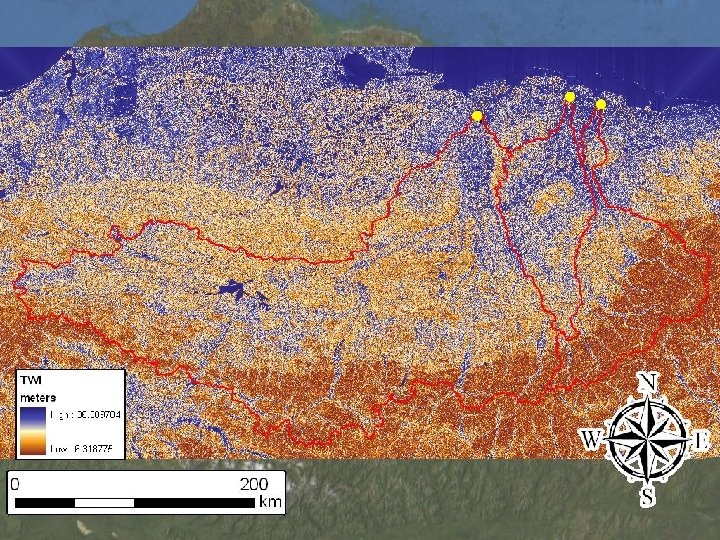
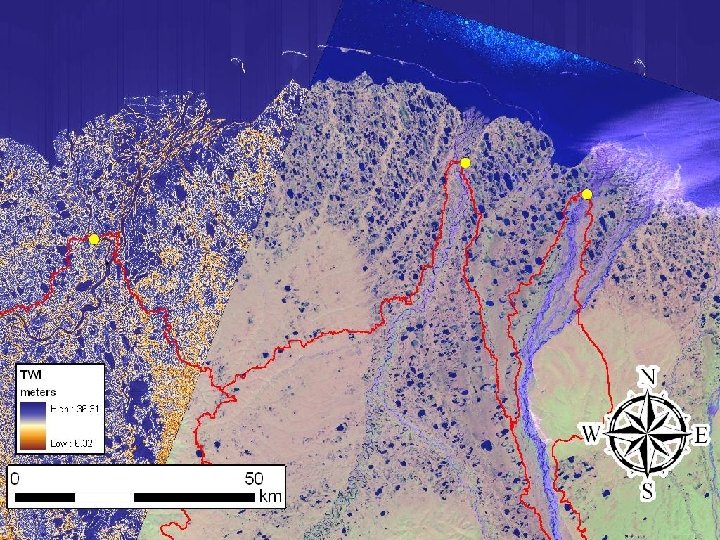
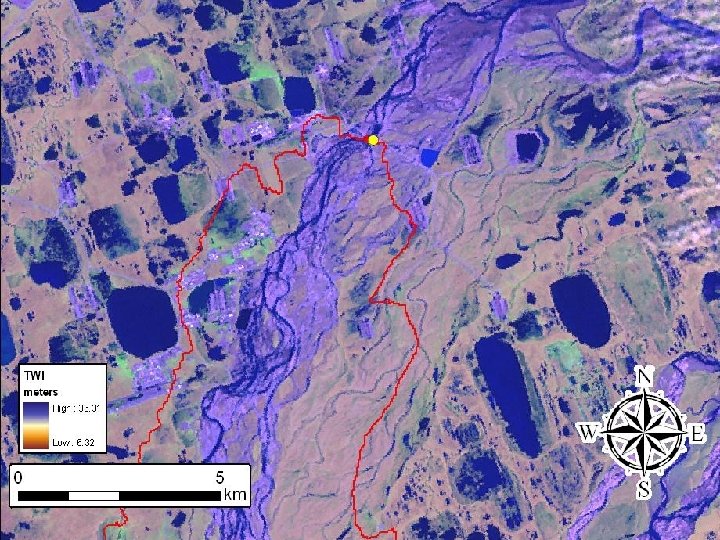
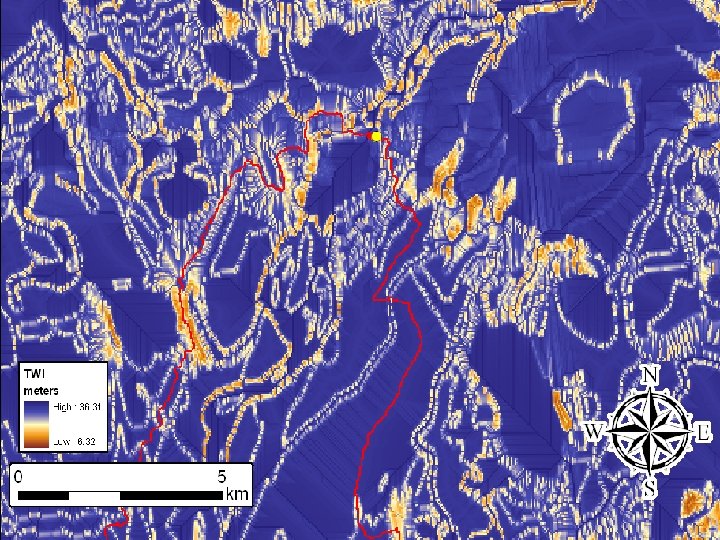
Topographic Wetness • Effects of topography on the location and size of saturated areas and areas of runoff generation – Surface saturation zones – Soil water content – Delineate vegetation As = specific catchment area (m) [Upslope contributing area/cell width] Β = slope gradient
Colville 30% 25% 20% 15% 10% 5% 5% 0% 0% 7 8 9 10 11 12 13 14 15 16 17 18 19 20 21 22 23 23+ Sagavanirktok 30% 25% 20% 15% 10% 5% 0% Kuparuk
Upslope Contributing Area
Future Work… • Calculate TWI using the D-infinity model • Land-cover type distribution • Permafrost extent and or active layer depth index
Questions ? ? ?