LandUse Scorecard Landscape Characteristics Percent Slope Percent slope


 layer")


 Medium-textured no ribbon forms. The sample breaks into pieces less")
 will leave a “stain”")


 v. Blocky = (subsoil) clods break on irregular shape planes")


 v 4. The answer you get by dividing is the C-Value.")
 v. In order for YES to be checked for restricted use")
 & 7 (Septic Tank) v O")


- Slides: 34
Land-Use Scorecard Landscape Characteristics Percent Slope -Percent slope is the rise and fall in 100 feet. -Subtract the difference between the two heights and multiply by 4 if taken at 25 feet.
v 0 -2 Landscape Characteristics Percent Slope % Nearly level v 2 -5% Gently Sloping v 5 -10% Moderately Sloping v 10 -15% Strongly Sloping v 15 -20% Moderately Steep v 20 -30% Steep v. More than 30% Very Steep
Thickness of Plow or Surface Layer, Degree of Erosion & Deposition v Directly related to % slope v Measure from the top of the profile down to where the subsoil starts v 8” to 20” deposition (more likely 20” to 60”) v This will be the lowest of the sites, likely near a ditch or stream v The entire profile is topsoil, the lower half will be darker than the upper half
v. Thickness of Plow Layer v. More than 9”, no evidence of subsoil mixing; none to slight erosion v 3” to 9”, may have up to 50% subsoil mixing; moderate erosion v. Less than 3”, plow layer may be mostly subsoil; severe erosion v 8” to 20” deposition layer of different color or texture than buried surface soil
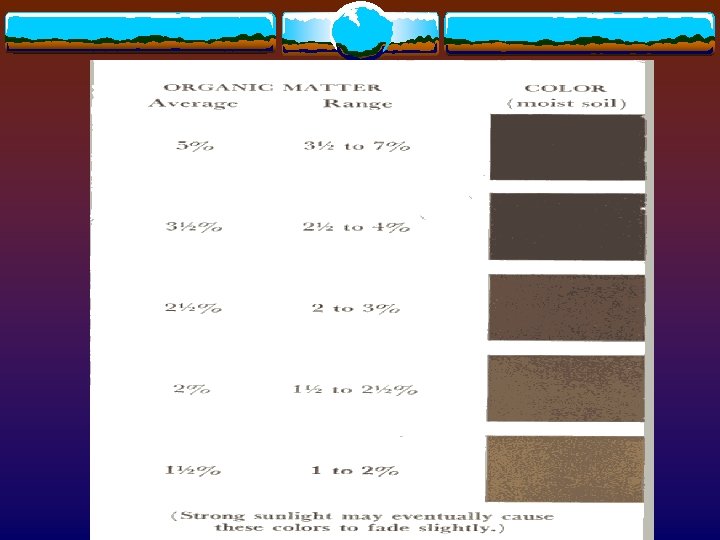
Soil Profile Characteristics v. Color and percent of organic matter in plow (surface) layer v. Moisten 2 inches from the top-get some moistened soil on the color chart chips and match the nearest chip v. See chart next slide
Organic Matter Content v Color v Very dark v 5 v Dark v 3 v Moderately v Light v Very v Ave. light dark ½ v 2 v 1 ½ % O. M.
v. Presence of Grayish E Horizon v. A 2”to 6” layer between the topsoil & subsoil v. Primarily found in forest soils v. If WET it will appear as a grayish, ashy, pasty material v. If DRY it will be a reddish brown, with a platy structure
Soil Profile Characteristics v. Grayish E horizon present v. Grayish E horizon not present v. Note: A 2 horizon was its previously known letter designation
Soil Profile Characteristics v. Subsoil color v. Measure from the top of the profile down to 24” v. If there are gray mottles above 24” it will be gray and brown mottled v. If there are gray mottles below 24” will be brown or yellowish brown; gray or gray mottling below 24”
Subsoil Color v. If there are NO gray mottles in the subsoil it will be brown or yellowish brown; no gray mottling v. Note: Don’t confuse Gray substrata with Gray subsoil
Soil Profile Characteristics v. Texture va. Fine-textured a ribbon forms easily and remains long and flexible. vb. Moderately fine-textured a ribbon forms but breaks into pieces ¾ to 1 inch long.
vc. Texture (cont. ) Medium-textured no ribbon forms. The sample breaks into pieces less than ¾ inch long. The soil feels smooth and talc-like. vd. Moderately coarse-textured no ribbon forms. The sample feels gritty and lacks smoothness. ve. Coarse-textured no ribbon forms. The sample is composed almost
Soil Profile Characteristics v. Texture v. Wet CLAY (fine texture) will leave a “stain” on your hands v. A profile with NO TRUE TOPSOIL could have a moderately fine topsoil and a moderately fine subsoil
v. Texture v. Peat & muck soils will be very black with black dust that leaves black on your fingers & it’s spongy to walk on v. Substrata-first determine if it is present v. Go to the bottom 1 foot of the profile = is the soil a different texture or color than the subsoil?
v. Texture v. Substrata is usually gray-moist-pastyhas no structure-will not break on even planes-no roots, and no dark coatings. It is highly that this type of substrata has a medium texture v. A reddish tinted soil at in the bottom foot that ball & bounces easily will have a fine texture
v. Texture v. If the texture in the bottom foot is the same as the subsoil texture = the substrata in not present
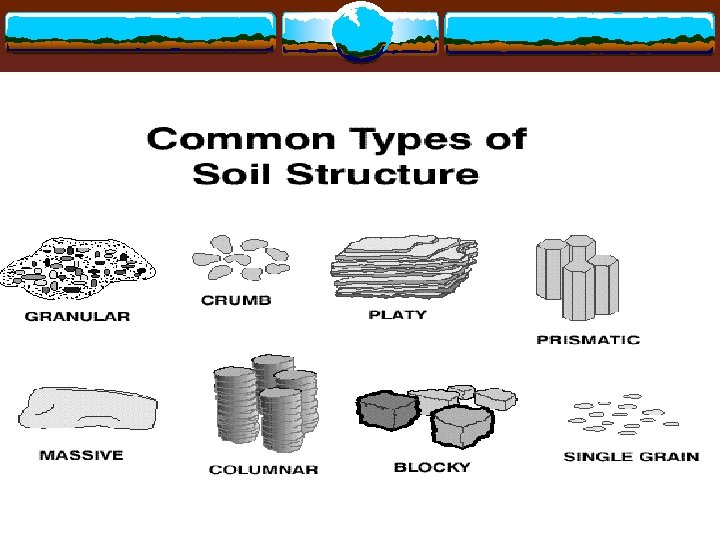
Soil Structure v. Types of Soil Structure v. Single grain = sand v. Massive = won’t happen v. Granular = plowlayer (if it’s not a true topsoil) v. Platy = clods come out of the profile more Horizontal than Vertical
Soil Structure (cont. ) v. Blocky = (subsoil) clods break on irregular shape planes v. Prismatic or Columnar = clods come out of the profile more Vertical than Horizontal
Soil Structure v. A plowlayer with NO TRUE TOPSOIL could easily have a Blocky structure v. Determine Structure by how the clods chip out of the profile walls.
Associated Soil Features v. Internal Drainage and Aeration v. This is a DIRECT MATCH with your SUBSOIL COLOR selection. v. If you miss Subsoil Color your also going to miss Internal Drainage & Aeration.
Internal Drainage and Aeration v. Example: If you choose a Gray and Brown mottled for you subsoil color than you will choose Somewhat poorly drained for your internal drainage and aeration.
Surface Runoff v Combine the finest of the topsoil/subsoil Textures with the % Slope on the front #I. v Use Table #1 to determine the surface runoff v Area subject to ponding = will this be the last spot where water drains after a rain? v Area subject to flooding = this area must be next to a continuous running stream.
Permeability v. The ease of water and air movement v. Match with Subsoil texture: v. Rapid = coarse / moderately coarse v. Medium = medium / moderately fine v. Slow = fine or bedrock
Soil Depth v. Measure to the lowest roots v. Bedrock is the only thing that will cause the soil depth to be shallow
Available Water Holding Capacity v. Use Table #2 v. Use a 60 inch profile v. If you can only see the A and B horizon then add the two thicknesses of each horizon and subtract the total from 60 to get the C horizon. v. Usually very high in Central Illinois
Figuring C-Value v. Given: % Slope v Slope Length v Z Factor v. The percent slope in NOT the site’s actual % slope. The C-Value information does NOT necessarily pertain to the site.
C-Value Procedure v 1. Combine the % Slope and the slope Length on Table #4 v 2. Take the Table # 4 number & divide it into Z. (Z always goes in the calculator first) v 3. Just write down the first two numbers past the decimal point and drop all other numbers. (do not round up)
Procedure (cont. ) v 4. The answer you get by dividing is the C-Value. v 5. On each of the five horizontal rotation/tillage choices = X the exact C -Value number or the next LOWEST number.
Procedures (cont. ) v. In order for YES to be checked for restricted use = you must have checked all four rows as DOES NOT APPLY v. If C-Value is. 02 or higher = NO will always be checked for restricted use
v Use Nonagricultural Use Tables 6 (Home site) & 7 (Septic Tank) v O = None to Slight v M = Moderate v S = Severe v You must have filled the scorecard out first in order to record this information. Look up the information from your scorecard.
Nonagricultural Use v. The only difference between the two charts is that “somewhat poorly drained” for home site is considered moderate but “somewhat poorly drained” for septic tank is considered severe. All the other answers will be the same for both.
Degree of Limitation v. You just place an X for the highest degree used in the home site and the highest degree used for the septic tank. v. Severe is the highest, Moderate is second and Slight is the lowest degree of limitation.