Visualizing Contacts and Connections Using Node XL Kristen


 ○ ● Labels & Attribute values Edge")


- Slides: 32
Visualizing Contacts and Connections Using Node. XL Kristen Mastel | @klmlibrarian | meye 0539@umn. edu
z. umn. edu/ARLDDay 18 Networks www. smrfoundation. org/nodexl/installation/
Why do we study social networks?
Who uses networks?
Network Definitions & Visualization ● Vertex (Node) ○ ● Labels & Attribute values Edge (Link, Tie) ○ ○ Directed/Undirected Labels & Attribute values
UMN Visualizations St. Paul Campus Planning By Jan Fransen
Node. XL
Gephi
Tableau link
UMN Visualizations Who are the key players? By Kristen Mastel
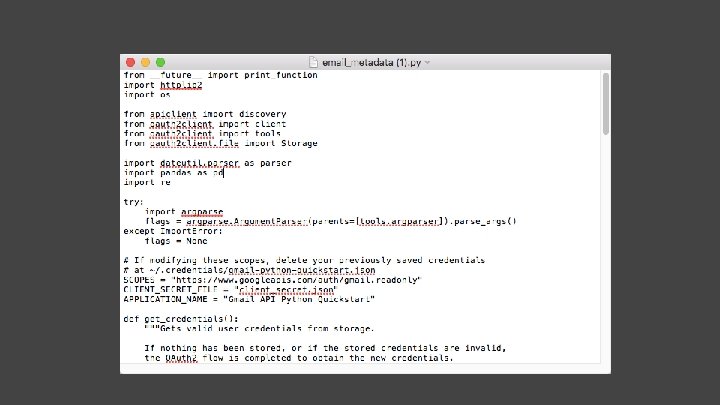
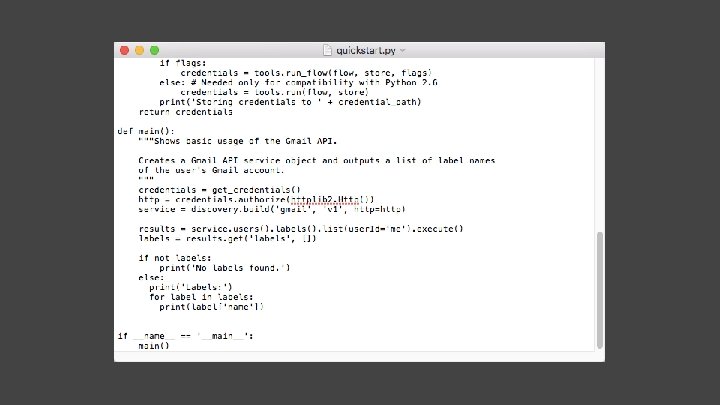
Download Python & Allow Google Settings https: //developers. google. com/gmail/api/quickstart/python
Directions 1. 2. 3. 4. 5. 6. 7. Download the two attached files "email_folders. py" and "email_metadata. py" Open a terminal Go to the Downloads folder using by typing "cd Downloads" followed by enter. Run the first script by typing "python email_folders. py" followed by enter Choose the folders you want to get email information from by: 1. Open the file "email_folders. txt" in a text editor of your choice (note this is a file created by the previous python code) 2. Each line as two pieces of information: the name of folder followed by a comma then the "label" as chosen by google's code. You can ignore everything after the comma 3. Delete all lines that contain files that you do NOT want to process (e. g. if you don't care about spam emails delete the line containing "SPAM, SPAM") 4. Save this file (don't change the name) Now run the second script by typing "python email_metadata. py" followed by enter - this code will be slow because google only lets you do a certain number of requests per second. As the code is running it will print out which folder it's working on and it will print out each time it has processed 1000 more emails. You should now have a file named "email_metadata<the-date>. csv" containing the information you want.
Departmental Analysis
Errors! Check for empty data. Ask for help!
Who was tweeting at the Library Technology Conference? https: //nodexlgraphgallery. org/Pages/Graph. aspx? graph. ID=144363
Twitter @UMNEXT
UMN Ext E-mail
Practice
Node. XL Twitter
Import - Twitter
Twitter data for #ARLD 18 as of 4/26/2018
#infolit
#infolit
MIT Immersion immersion. media. mit. edu
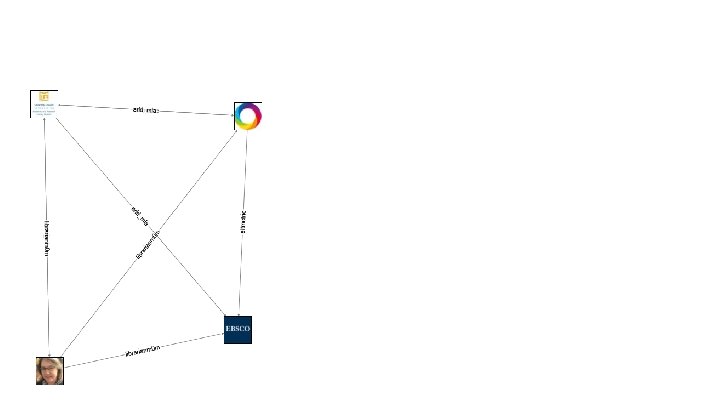
What is Immersion? ● ● Works with Gmail, Yahoo and MS Exchange Gathers To, From, CC, and Timestamp info Snapshot link good for 30 days Can request info to be deleted I : ● Seeing connections and groups by colors ● Introduced by ● Introduced to (more connections) Don’t : ● Can’t filter to specific folders ● Can’t see related data ● Lots of noise
Immersion
Immersion
Immersion
References/Resources ● ● ● Analyzing Social Media Networks: Learning by Doing with Node. XL for Beginners Teaching with Node. XL