VISTAS Emissions Inventory Overview Nov 4 2003 VISTAS


- Slides: 23
VISTAS Emissions Inventory Overview Nov 4, 2003
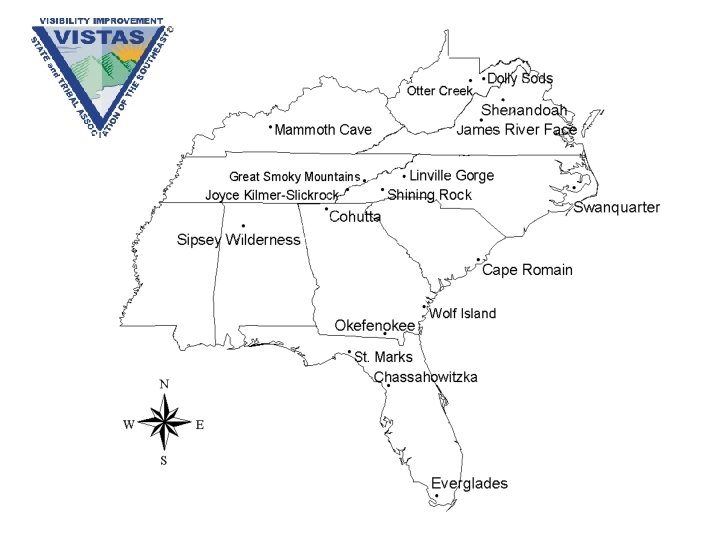
VISTAS is evaluating visibility and sources fine particulate mass in the Southeastern U View NE from Appalachian Tra Mt. Cammerer, Great Smoky M
VISTAS - Regional Haze Timeline Regional Haze Rule PM 2. 5 Designation Feb/Dec 2004 PM 2. 5 & Haze SIPs Dec 2007 1999 2000 2001 2002 2003 2004 2005 2006 2007 2008 VISTAS Planning BART Sources Strategy Design Reasonable Progress Goals Policy Interpretation Air Quality Monitoring Baseline and natural conditions Emissions Inventory Base year and future year strategies Atmospheric Modeling States Develop Haze SIPs Base year and future year air quality
VISTAS Science Supports Regulatory Deci Air • gases Quality • particles • deposition • visibility Meteorology • topography Emissions • anthropogenic • biogenic Atmospheri c Model: • Chemistry • Transport • Deposition Air Quality Responses to Emission Controls Policy Interpretation
2001 Annual Average Light Extinction Mm-1 From VIEWS website
0 Everglades, FL Chassahowitzka, FL Okefenokee, GA Cape Romain, SC Swan Quarter, NC Linville Gorge, NC Shining Rock, NC Great Smoky Mtns, TN Sipsey, AL Mammoth Cave, KY James Rvier Face, VA Shenandoah, VA Dolly Sods, WV Extinction (Mm-1) Light Extinction on 20% Haziest Days - IMPROVE 19 250 200 150 100 50 Coarse Soil Organics EC NH 3 NO 3 (NH 4)2 SO 4 Rayleigh
VISTAS Emissions Inventory • Objective: provide inventories for modeling PM 2. 5 and regional haze • State and local agencies review and revise – 2002 – 1 st draft delivered Aug 03; 2 nd draft due Dec 03 – 2018 – 1 st draft due Mar 04, 2 nd draft due Sept 04 • Improve inventories – NH 3, fire, primary carbon PM 2. 5 – Hourly, daily, seasonal
VISTAS 2002 Inventory Responsibilities • MACTEC, Inc. : – point and area sources • E. H. Pechan & Assoc. , Inc. : – mobile onroad and non-road engines • State and local agencies: – provide latest existing inventory (99, 00, 01, or 02) – provide input for inventory improvements – review methods, products • VISTAS Participants: review methods, products
VISTAS 2002 Inventory Approach • Update NEI 1999 with state and local data – fill missing data (e. g. area & non-road NH 3, PM 2. 5) • Grow inventories to 2002: – state/local inventory, activity data – Bureau of Census – Economic Growth Analysis System • QA/QC and inventory review throughout project – Comprehensive Emissions Reporting Requirements – Data Exchange Protocol • Temporal and spatial allocation for
VISTAS 2002 10 -State Emissions Inventory Million tons/year 6 5 4 Nonroad On-Road Area Industry Utility 3 2 1 0 SO 2 NOx VOC PM 10 PM 2. 5 NH 3 Based on state/local inventory data or 1999 NEI v 2, grown to 2002
VISTAS 10 -State Emissions Inventory – 1999 NEI v 2 vs. 2002 VISTAS Million tons/year 7 6 5 Nonroad On-Road Area Industry Utility 4 3 2 1 0 SO 2 99 02 NOx 99 02 VOC 99 02 PM 2. 5 NH 3 99 02
Comparison of NEI and VISTAS Inventories Utility SO 2 800, 000 tons/year 600, 000 400, 000 200, 000 0 AL FL GA KY MS NC SC TN 1999 NEI v 2 VISTAS 2002 VA WV
Comparison of NEI and VISTAS Inventories Utility NOx 350, 000 tons/year 300, 000 250, 000 200, 000 150, 000 100, 000 50, 000 0 AL FL GA KY MS NC SC TN 1999 NEI v 2 VISTAS 2002 VA WV
Wildfire PM 2. 5 Emissions for 8 VISTAS Sta PM 2. 5 (Tons per year) SMOKE model - 1999 v 2 and 2002 Calculated 8, 000 6, 000 4, 000 2, 000 0 Jan Feb Mar Apr May Jun July Aug Sept Oct Nov D SMOKE- 1999 NEI v 22002 calculated *AL, GA, KY, NC, SC, TN, VA, WV; FL and MS did not submit wildfire data
Comparison of NEI and VISTAS Inventories Point Source Ammonia Tons per year 30, 000 25, 000 20, 000 15, 000 10, 000 5, 000 0 AL FL GA KY MS NC SC TN VA WV 1999 NEI v 2 VISTAS 2002
Fertilizer NH 3 Emissions Tons per year 2002 CMU model vs 1999 NEI v 2 25, 000 20, 000 15, 000 10, 000 5, 000 0 AL FL GA KY MS NC SC 2002 CMU TN 1999 NEI v 2 VA WV
Livestock NH 3 Emissions 2002 CMU model vs. 1999 NEI v 2 Tons per year 160, 000 120, 000 80, 000 40, 000 0 AL FL GA KY MS NC SC TN VA WV 2002 CMU 1999 NEI v 2
VISTAS 36 -km and 12 -km CMAQ Modeling Do
SO 2 Point Sources >5, 000 Tons per year 1999 National Emissions Inventory v 2 Annual SO 2 emissions 250, 000 125, 000
VISTAS Emissions Modeling (SMOKE into Modeled NO emissions from mobile sector – 12 km domain CMAQ) ENVIRON / U California, Riverside / Alpine Geophysics
Meteorological, Emissions, and Air Quality Modeling De Jan-Mar 2004 Define BART sources Aug 2003: Emissions Inventory Base 2002 Dec 2003: Revised Em Inv Base 2002 Jan 2004: Met, Em, AQ model testing 3 episodes Jan 2004: Modeling Protocol EPA- approved Modeling Protocol Mar 2004: CART: select sensitivity episodes Optional Before Jun 2005 Other Inventory: e. g. Draft 10/31/03 June 2004 Identify BART controls Mar 2004: Draft Em Inv 2018 July 2004: Revised State Em Inv Base 2002 Sept 2004: Revised Em Inv 2018 Oct-Dec 2004: Control Strategy Inventories Sept 2004: Annual Base Year Model Runs Apr 2004: DDM in CMAQ Dec 2004: Annual Run 2018 Jan 2005: Sensitivity Runs 2018 episodes Jan-Jun 2005: Control Strategy Runs 2018 Optional After Jun 2005 Model Runs: e. g. Power Plant Oct 2004: Sensitivity Runs 2018 3 episodes July-Dec 2005: Observations Conclusions Recommendations State Regulatory Activities