Uranium Medical Research Centre www umrc net The


- Slides: 23
Uranium Medical Research Centre www. umrc. net
The Analysis of Uranium Isotopes Abundance and Ratios in the Civilian Population of Eastern Afghanistan after Operation Enduring Freedom
A. Durakovic, A. Gerdes, F. Klimaschewski, I. Zimmerman Uranium Medical Research Centre Washington, DC, USA London, UK Toronto, Ontario, Canada Institute for Mineralogy JW Goethe University Frankfurt, Germany
Objective The purpose of this work was to determine the concentration and precise ratio of four uranium isotopes (234 U, 235 U, 236 U, 238 U) in the urine specimens of the civilian population in Eastern Afghanistan following Operation Enduring Freedom (OEF).
The Unique Signature of Artificial Uranium 238 U/235 U Natural Uranium: 137. 88 Depleted Uranium: 492. 60 Non-Depleted Uranium: 137. 88 + Ratio 236 U
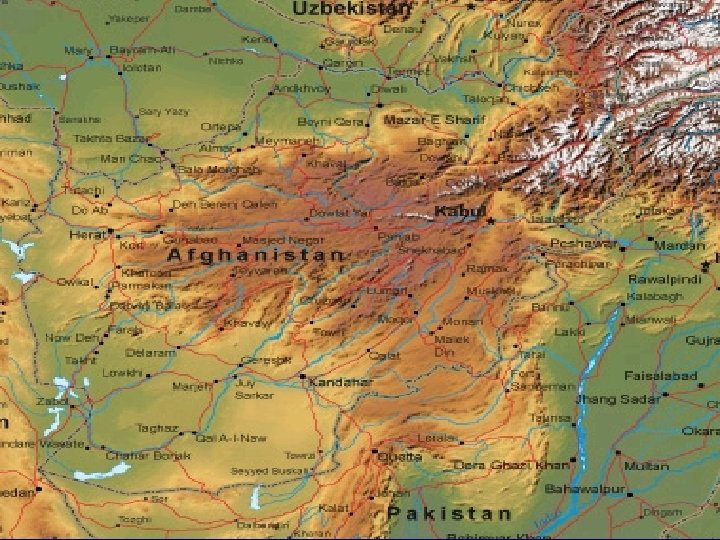
Bomb Crater, Jalalabad, Afghanistan
Subjects ► Twenty-one symptomatic subjects were chosen from various locations of Eastern Afghanistan by the UMRC Field Research Team in during two field trips in 2002. ► All subjects were presenting with symptoms of fatigue, fever, musculo-skeletal and neurological alterations, headaches, and respiratory impairment after inhalation of dust during the bombing raids in June, 2002. ► The subjects had their urine samples collected under controlled conditions.
Child Survivors of the Bombing of Houses in Bibi Mahrow
Controls ► Three subjects who were apparently healthy and reported to have been in parts of the country not effected by the bombing raids had their urine collected for comparison.
Sample Preparation ► Chemical preparation of the uranium in each urine sample involved preconcentration of the uranium using coprecipitation, evaporation, oxidation of organic matter, and purification of uranium by ion-exchange chromatography.
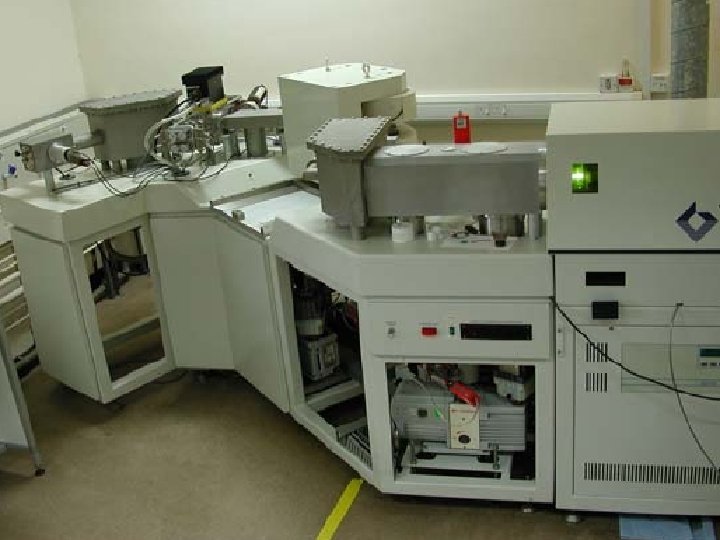
Sample Analysis ► The samples were analyzed using a double focusing Thermo-Elemental Plasma 54 multi-collector ICP-MS equipped with a Daly detector for ion counting and multiple faraday cups. ► The analysis was done at the NERC Isotope Geosciences Laboratory, British Geological Survey, Keyworth, Notts, United Kingdom
Analytical Methods ► Analytical blanks were negligible at less than 50 picograms U, and chemical recovery was > 80% in most cases. ► Along with the samples, analyses were conducted of a urine internal standard (with c. 11 ng/L uranium) of natural isotopic composition (atomic ratio 137. 88 for 238 U: 235 U) and certified isotopic standards of uranium, both of which returned the correct values for the standards.
Results ► The 238 U/235 U ratio was 138. 15 compared with 137. 88 for natural uranium. ► The 234 U/238 U ratio of 5. 75 x 10 -5 compared with 5. 54 x 10 -5 for natural uranium. ► The mean concentration of uranium 231. 23 ng/L was considerably greater than expected for a normal population 1 -20 ng/L ► 236 U was detected in 6 of the 21 samples with a 236 U/238 U ratio greater than the detection limit of 1. 0 x 10 -7.
Table 1: Isotopic Ratios Subject 238 U/235 U 2 Sigma 234 U/238 U 2 Sigma 236 U/238 U 2 Sigma 1 137. 65 0. 15 5. 53 x 10 -5 1. 27 x 10 -6 4. 61 x 10 -8 2. 20 x 10 -9 2 138. 09 0. 18 5. 43 x 10 -5 1. 22 x 10 -6 6. 67 x 10 -8 5. 60 x 10 -9 3 137. 55 0. 19 5. 55 x 10 -5 1. 37 x 10 -6 9. 60 x 10 -8 8. 20 x 10 -9 4 137. 95 0. 15 5. 44 x 10 -5 1. 19 x 10 -6 8. 9 x 10 -9 2. 60 x 10 -9 5 138. 08 0. 15 5. 45 x 10 -5 1. 17 x 10 -6 2. 2 x 10 -9 1. 60 x 10 -9 6 137. 98 0. 16 5. 44 x 10 -5 1. 31 x 10 -6 2. 65 x 10 -8 3. 60 x 10 -9 7 137. 82 0. 14 5. 62 x 10 -5 1. 57 x 10 -6 7. 79 x 10 -8 5. 20 x 10 -9 8 137. 86 0. 14 5. 63 x 10 -5 1. 54 x 10 -6 7. 35 x 10 -8 5. 00 x 10 -9 9 138. 52 0. 69 5. 40 x 10 -8 5. 72 x 10 -9 10 138. 93 0. 75 5. 40 x 10 -8 5. 72 x 10 -9 11 137. 72 0. 96 2. 30 x 10 -6 3. 08 x 10 -7 12 137. 74 0. 74 1. 80 x 10 -7 1. 76 x 10 -8 13 137. 91 0. 06 14 137. 97 0. 94 5. 70 x 10 -5 1. 70 x 10 -5 9. 40 x 10 -7 1. 15 x 10 -7 15 138. 26 0. 94 6. 20 x 10 -5 5. 34 x 10 -6 2. 50 x 10 -6 9. 0 x 10 -8 16 138. 50 0. 69 9. 20 x 10 -7 4. 60 x 10 -8 17 138. 47 0. 75 2. 70 x 10 -8 4. 06 x 10 -9 18 138. 58 0. 69 19 138. 68 0. 69 1. 50 x 10 -7 1. 08 x 10 -8 20 138. 27 0. 69 4. 90 x 10 -8 1. 00 x 10 -8 21 138. 70 0. 72 7. 10 x 10 -8 3. 32 x 10 -8 Average 138. 15 5. 75 x 10 -5 4. 02 x 10 -7 STD 0. 39 5. 29 x 10 -6 7. 56 x 10 -7 SE 0. 08 1. 53 x 10 -6 1. 69 x 10 -7 7. 20 x 10 -5 4. 76 x 10 -5
Table 2: Isotopic Abundance Subject % 238 U % 235 U % 234 U % 236 U 1 99. 2733 0. 7212 5. 49 x 10 -3 3. 67 x 10 -6 2 99. 2757 0. 7189 5. 38 x 10 -3 6. 63 x 10 -6 3 99. 2727 0. 7217 5. 51 x 10 -3 9. 53 x 10 -6 4 99. 2750 0. 7196 5. 40 x 10 -3 8. 84 x 10 -7 5 99. 2756 0. 7190 5. 41 x 10 -3 2. 16 x 10 -7 6 99. 2751 0. 7195 5. 40 x 10 -3 2. 63 x 10 -6 7 99. 2741 0. 7203 5. 58 x 10 -3 7. 73 x 10 -6 8 99. 2743 0. 7201 5. 58 x 10 -3 7. 30 x 10 -6 9 99. 2833 0. 7167 5. 36 x 10 -6 10 99. 2853 0. 7147 5. 36 x 10 -6 11 99. 2718 0. 7208 7. 15 x 10 -3 2. 28 x 10 -4 12 99. 2792 0. 7208 5. 66 x 10 -3 1. 79 x 10 -5 13 99. 2801 0. 7199 6. 16 x 10 -3 14 99. 2747 0. 7195 9. 33 x 10 -5 15 99. 2755 0. 7181 2. 48 x 10 -4 16 99. 2831 0. 7168 9. 13 x 10 -5 17 99. 2830 0. 7170 2. 68 x 10 -6 18 99. 2836 0. 7164 19 99. 2841 0. 7159 1. 49 x 10 -5 20 99. 2820 0. 7180 4. 86 x 10 -6 21 99. 2842 0. 7158 7. 05 x 10 -6 Average 99. 2784 0. 7186 5. 70 x 10 -3 3. 99 x 10 -5 STD 0. 0046 0. 0020 5. 27 x 10 -4 7. 51 x 10 -5 SE 0. 0010 0. 0004 1. 52 x 10 -4 1. 68 x 10 -5
Table 3: Uranium Concentration Subject U ng/L 1 279. 17 12 40. 19 2 245. 27 13 2031. 63 3 128. 03 14 29. 92 4 449. 97 15 99. 62 5 474. 42 16 57. 51 6 296. 48 17 74. 84 7 87. 88 18 44. 32 8 223. 18 19 90. 04 9 94. 07 20 39. 58 10 25. 78 21 33. 14 11 10. 88 U ng/L Average 231. 23 STD 434. 50 SE 92. 64
Controls Table 5: Control Uranium Concentration Subject U ng/L 1 59. 93 2 26. 79 3 9. 47 Average 32. 06 STD 25. 64 SE 14. 80 Table 6: Control Isotopic Ratios Subject 238 U/235 U 2 Sigma 234 U/238 U 2 Sigma 236 U/238 U 2 Sigma 1 138. 97 0. 94 6. 30 x 10 -5 8. 56 x 10 -6 5. 90 x 10 -6 1. 30 x 10 -8 2 139. 10 0. 72 2. 60 x 10 -7 2. 60 x 10 -8 3 137. 44 0. 96 2. 20 x 10 -7 1. 69 x 10 -7 Average 138. 50 STD 0. 92 3. 27 x 10 -6 SE 0. 53 1. 89 x 10 -6 6. 30 x 10 -5 5. 42 x 10 -5 2. 13 x 10 -6
Chart 1: Uranium Concentration
Conclusion ► Our results confirm a significantly elevated presence of uranium isotopes in the urine of Afghan civilians after Operation Enduring Freedom. ► This demonstrates contamination from a source consistent with natural uranium (NU), resulting in total uranium concentration levels of up to 100 times higher than the normal range of various worldwide geographic and environmental areas.
Conclusion ► Possible explanation of our findings may be either a consequence of exposure due to deployment of weapons containing nondepleted uranium (NDU) or unusually high levels of natural uranium (NU) in drinking water or soil in the particular geographic areas. ► The cause of the urinary presence of natural and non-depleted uranium may be consistent with our previously reported findings of contamination by inhalation of uranium containing aerosols.
Uranium Medical Research Centre www. umrc. net